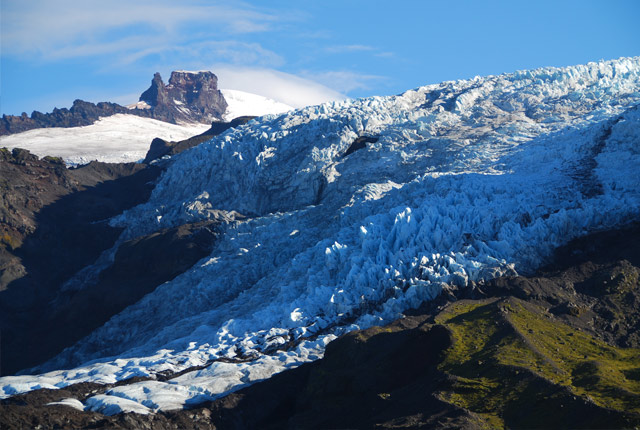
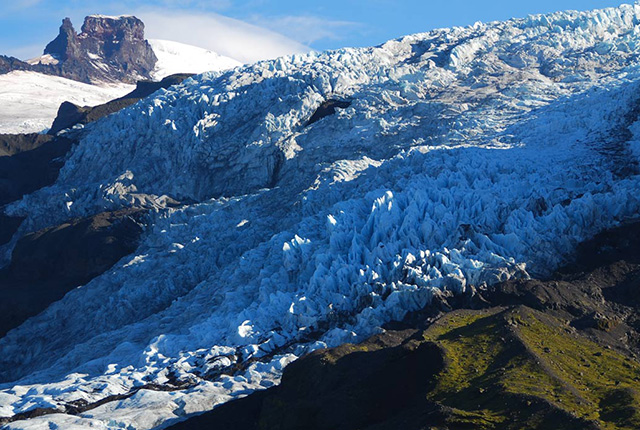
Like most glaciers in Iceland, Virkisjökull, in the south-east of the country, is retreating rapidly. Since 1996, the glacier margin has retreated nearly 500 m and it appears that this rate has accelerated over the last five years. We operate an observatory site at Virkisjökull, studying the evolution of the glacier (Icelandic: jökull) and the surrounding landscape, and their responses to regional climate (Figure 1).
Sensors at the site are constantly collecting climate and seismic data. Repeated high-resolution surveys study how the glacier, land surface and the deposits beneath change over time. Cutting-edge technologies, not used in such a combination anywhere else in the world, are used to give unique insights into processes of landscape formation and responses of glacial systems to climate forcing.
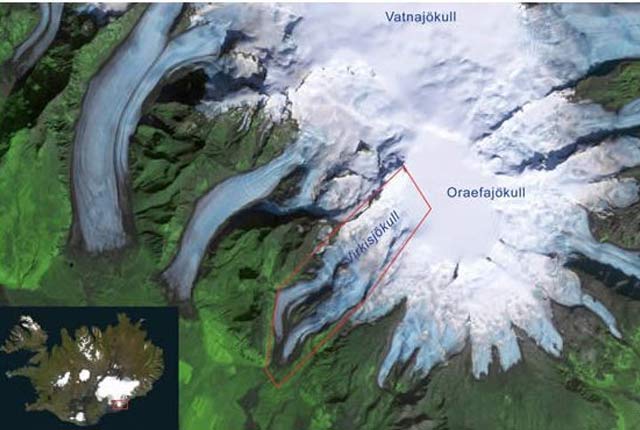

Figure 1: false-colour satellite image of the Öræfajökull ice cap, sitting on top and filling the crater of the Öræfi volcano. Several outlet glaciers drain radially from the crater, including Virkisjökull (outlined). Satellite image of the location of the Vatnajökull and Öræfajökull ice caps in Iceland are shown in inset. BGS © UKRI.
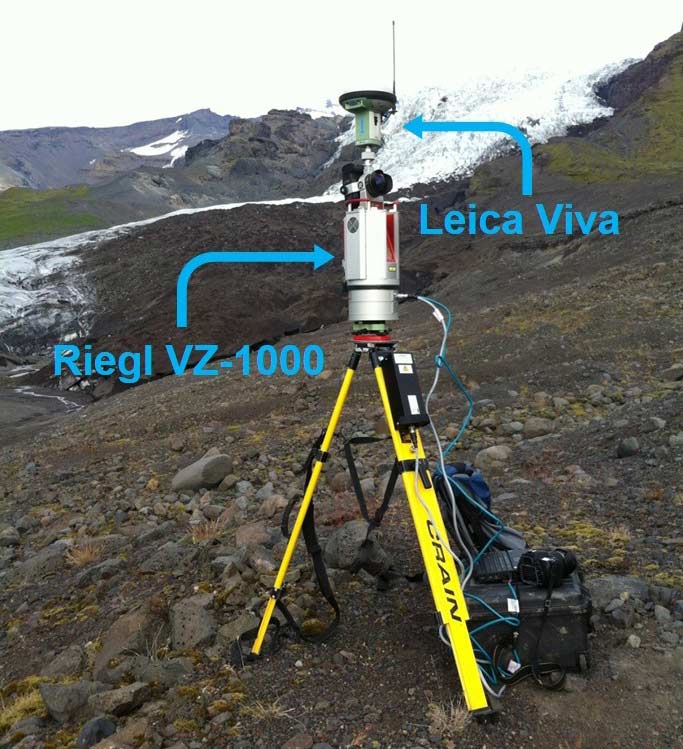
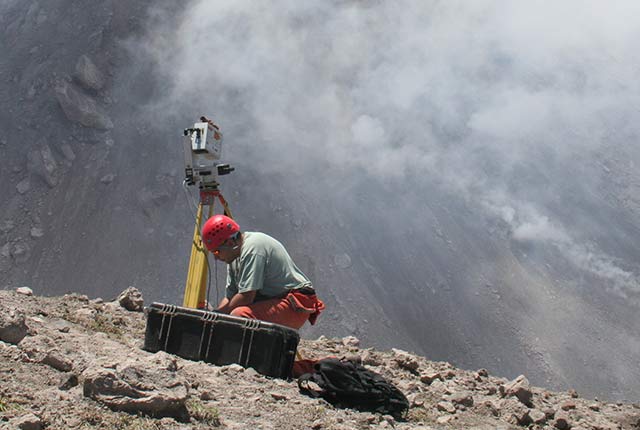
Figure 2: Riegl VZ-1000 terrestrial LiDAR scanner set-up on glacial foreland, east of the glacier. BGS © UKRI.
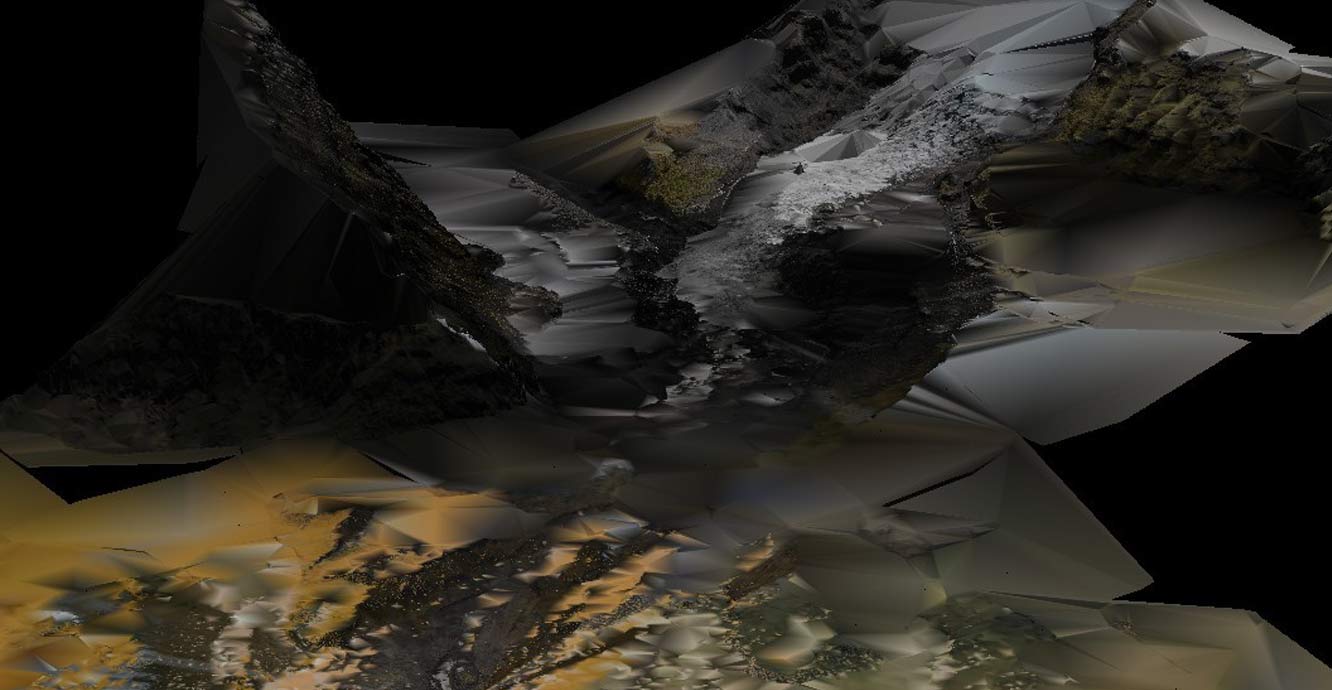
Figure 3: virtual outcrop model (VOM) of Falljökull and foreland. BGS © UKRI.
Equipment
In the 2009, 2010 and 2011 surveys, the scanner used was the Riegl LPM-i800HA. In the 2012 survey it was the Riegl VZ-1000. Both scanners have a high-resolution digital camera associated with them (Figure 2).
Scanning method
Multiple instrument set-ups at a series of locations around the glacier were required to obtain a complete surface model, as not all the subject area was visible from any one location. It is essential that these different datasets are accurately referenced to a common coordinate system. Multiple recording locations also minimised the number of ‘shadow areas’ (parts of the subject obscured from the scanners’ view) within the final compiled surface model, with each component scan containing at least three common points to assist with orientation and significant overlap, typically around ten per cent.
Scan production
The terrestrial LiDAR data produced by the oriented laser scan and GNSS survey were processed to develop a virtual outcrop model (VOM) of the glacier and glacial margin (Figure 3). The raw data produced by the RiProfile program, used in 2009 to 2011, consisted of point clouds comprising 70 million x-y-z points for the September 2009 survey, 40 million x-y-z points for the September 2010 survey and 70 million x-y-z points for the September 2011 survey. The raw data produced by the RiScanPro program, used in 2012, consisted of a point-cloud containing 300 million x-y-z points.
The data was oriented using the relative differential GPS positions of both the scanner and the back-sights and output as an ASCII file, made up of x-y-z intensity and RGB colour values. For the 2009 to 2011 surveys, the data was imported into the ImAlign package within Polyworks to align individual scans and to check for errors in orientation. In 2012, this was carried out in RiScanPro. Surface 3D digital elevation and change models between epochs (Figure 4) were created using Surfer and IMSurvey, and 3D coloured point-cloud models and video fly-throughs were created in QTModeler and Pointools.
In April 2012, six single-frequency GNSS units were deployed on Virkisjökull and Falljökull (Figure 5) and a dual-frequency GNSS unit was set up as a permanently recording base station near the car park. In September 2012, the first 140 days of data from these on-ice GNSS units and the base station unit were downloaded. The data was processed in Leica Geo-Office and positional change and velocities were calculated for the glacial flow in Excel (Figure 6).
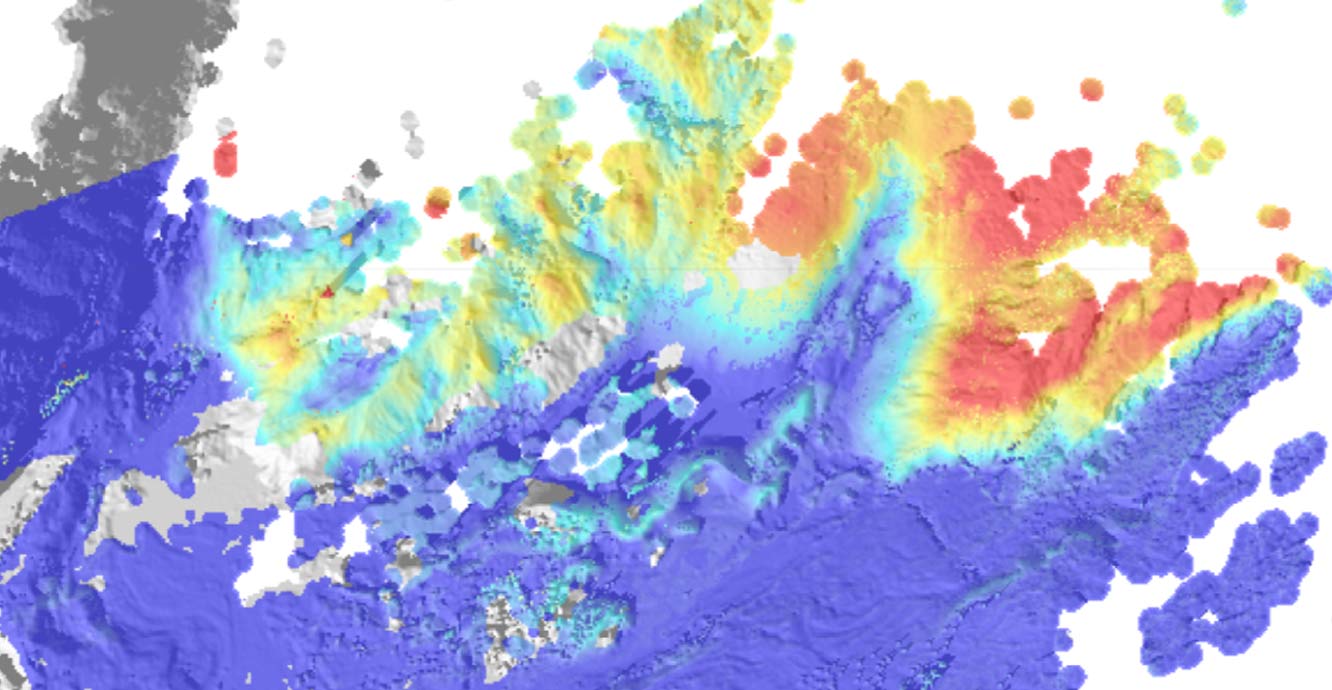
Figure 4: change model, 2009 to 2012. BGS © UKRI.
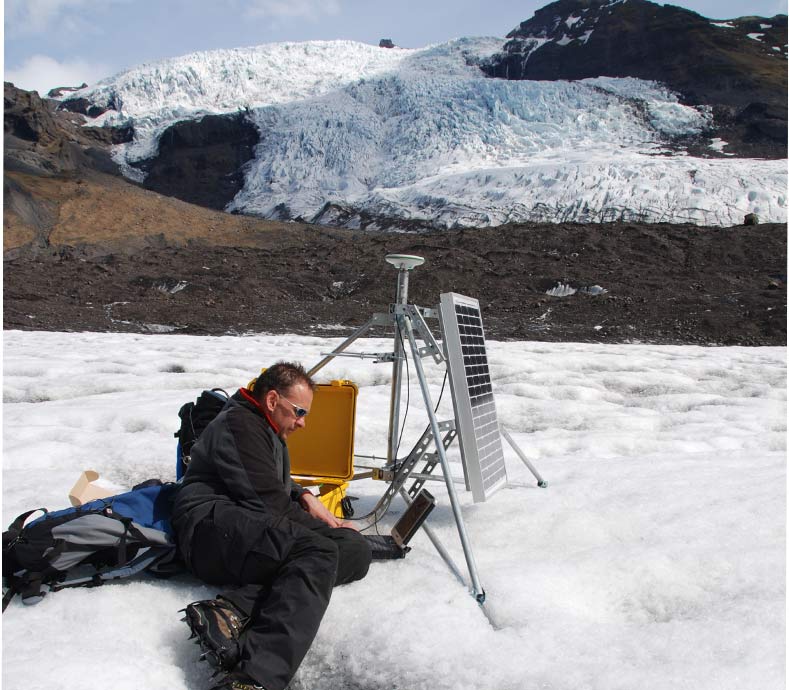
Figure 5: installation of on-ice GNSS. © Jez Everest. All rights reserved.
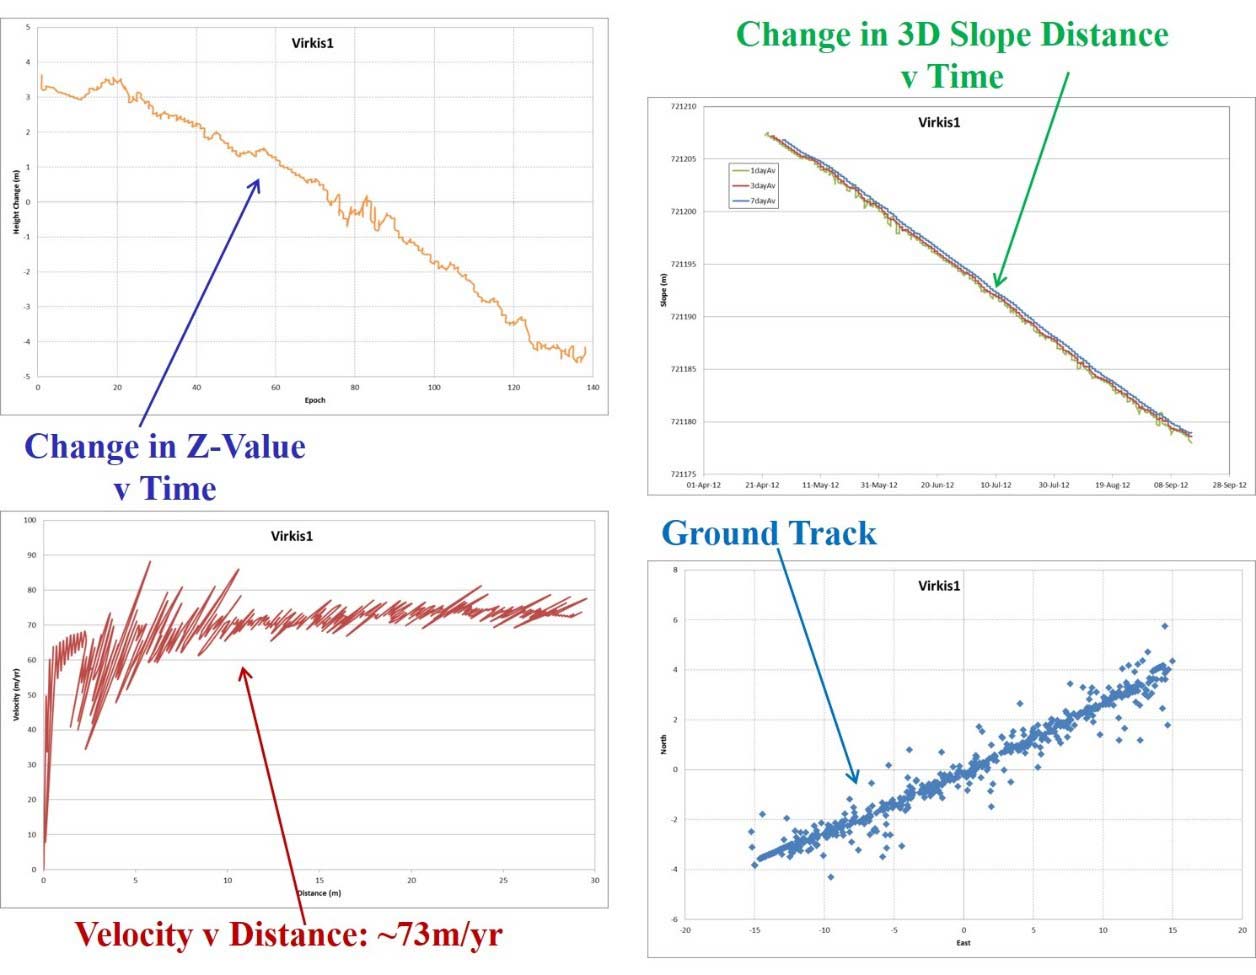
Figure 6: positional change and velocity measurements for Virkis1 on-ice GNSS. BGS © UKRI.
Challenges
The main issues with the LiDAR surveys carried out at the Virkisjökull Ice Observatory were with the locations of the scan sites themselves and, in 2009, problems with GNSS availability. The logistics of transporting 60 kg worth of surveying kit across the sandur and glacial foreland proved quite difficult; transporting the same amount of kit onto the glacier itself (wearing crampons) was hazardous.
The System 1200 GNSS units used in 2009 struggled with satellite availability at such a northern latitude, but from 2010 onwards the Viva GNSS unit, which utilises both GPS and GLONAS, coped much better. The 2009 scans were able to be correctly orientated by re-aligning them using ImAlign.
Contact
If you want to discover more then please contact Lee Jones.
Find out more about our research
Ground-based and near-Earth geomatic surveys
BGS has pioneered the use of ground-based (terrestrial) techniques for a variety of geoscientific applications since 1999.
Glacier monitoring
The BGS uses cutting-edge technology in Iceland to monitor how glaciers and their surrounding landscape change over time, and how they respond to climate.
GSNI project wins multiple awards at RegioStars event
17/10/2025
The AGEO project enjoyed a double success at the RegioStars awards, hosted at the European Commission in Brussels.
AI and Earth observation: BGS visits the European Space Agency
02/07/2025
The newest artificial intelligence for earth science: how ESA and NASA are using AI to understand our planet.
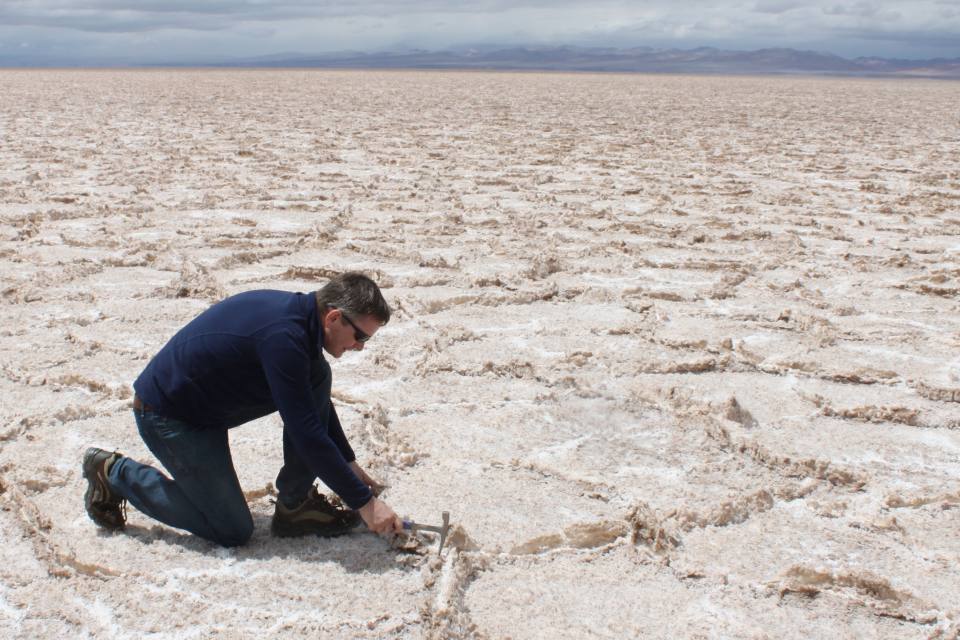
BGS collaborates with Icelandic colleagues to assess windfarm suitability
03/10/2024
Iceland’s offshore geology, geomorphology and climate present all the elements required for renewable energy resources.
Glacial, periglacial and permafrost modelling
Glacier ice and permafrost have important implications for global water security and energy infrastructure
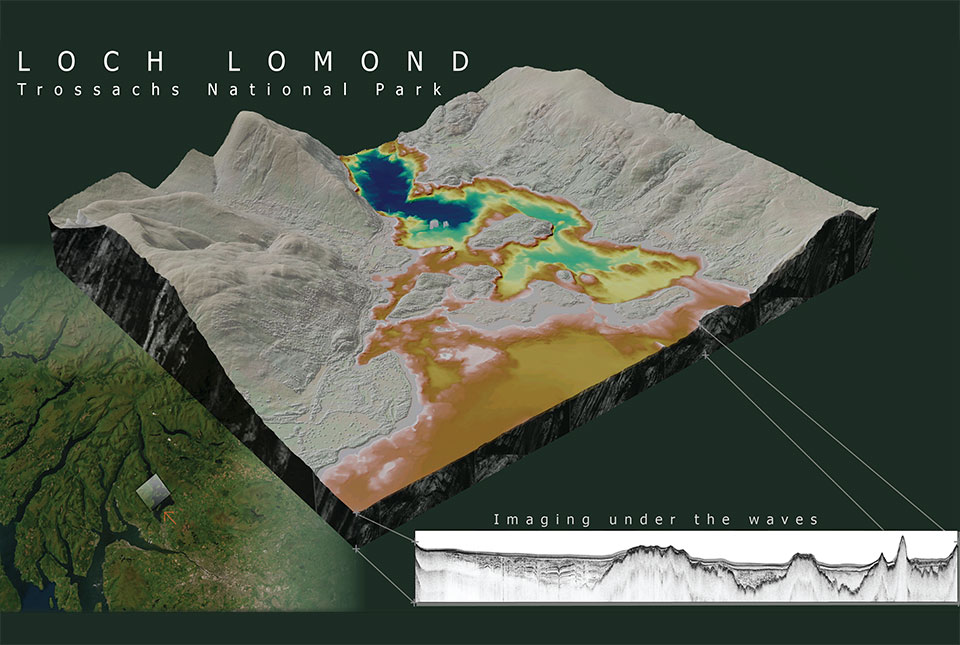
What lies beneath Loch Lomond?
17/10/2023
BGS geoscientists have visualised what lies beneath the waves of Loch Lomond, revealing an image of the loch bed and various sedimentary features of the subsurface.
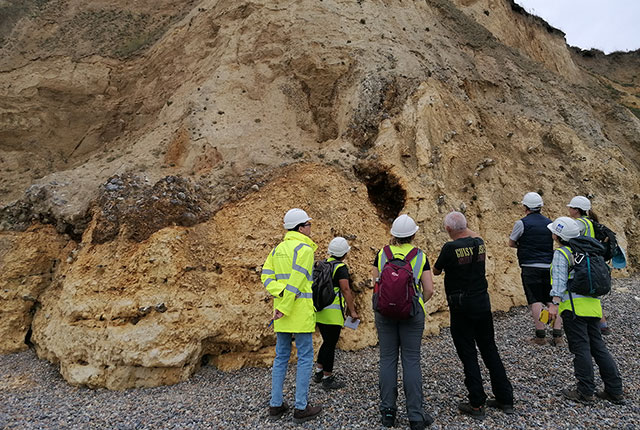
Notes from an applied glacial geology field course in Norfolk
28/10/2022
Marine geoscientist Catriona MacDonald and urban geologist Raushan Arnhardt share their experiences from a recent trip to north Norfolk to learn more about glacial geology.
Project findings provide essential insight into the last British–Irish ice sheet
29/09/2022
Understanding more about the north-west European continental shelf and improving forecasting for the Antarctic and Greenland ice sheets.
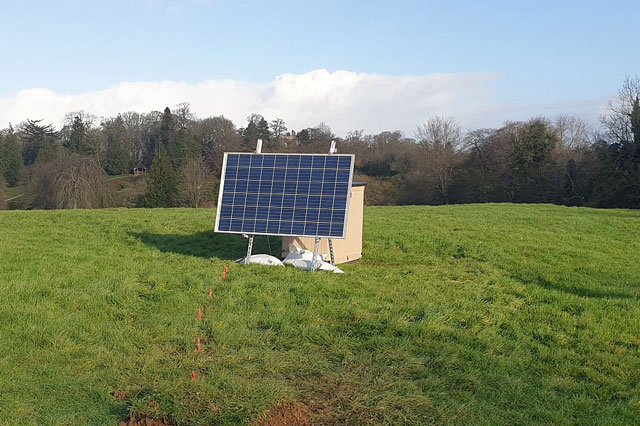
UK’s geomagnetic blind spots tackled with new observatories
28/07/2022
Three new geomagnetic observatories have been installed across the UK to fill in the country’s ‘blind spots’ and tackle the risk posed by space weather.
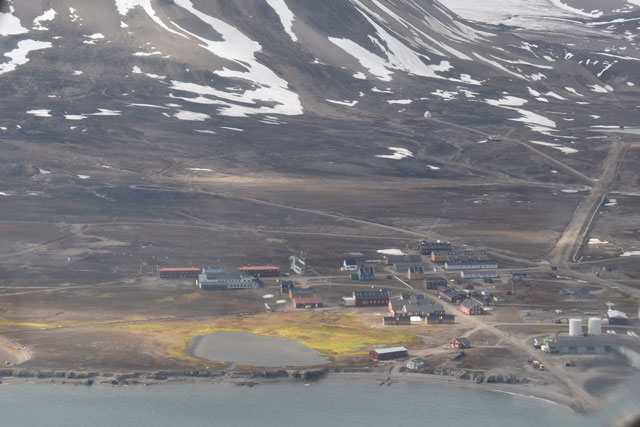
Glaciers retreat; soils emerge – summer fieldwork at 79°N
14/09/2021
Studying the evolution of newly emerging soils uncovered by retreating glaciers on the Svalbard archipelago in the Arctic Ocean.
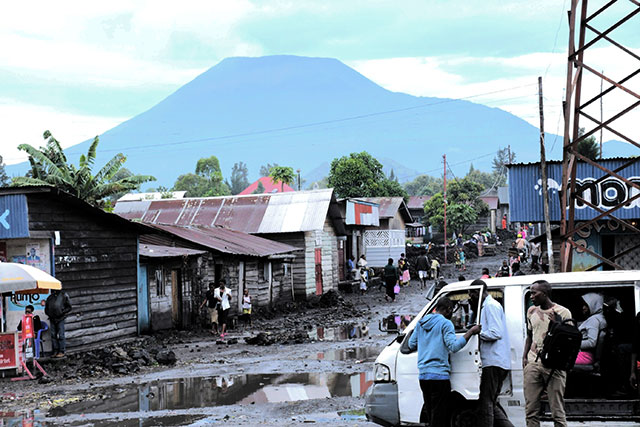
Using satellite imagery for emergency disaster response
06/07/2021
BGS has a long history of assisting relief efforts by providing satellite maps, data and interpretation to those affected by disasters, helping to identify hazardous areas to avoid.
Spaceborne data: an expanding role in disaster response
23/06/2021
Alessandro Novellino explains the importance of Earth observation to help facilitate successful emergency responses after natural hazard occurrences.
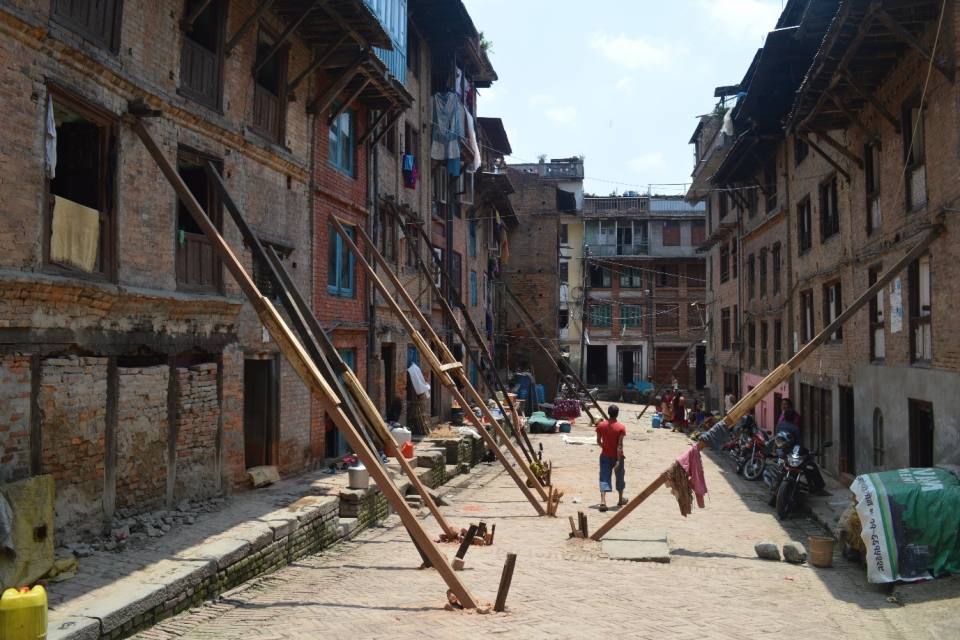
Virtual fieldwork during a global pandemic
03/03/2021
Virtual field reconnaissance can help maintain research momentum during the COVID-19 pandemic.