Earthquakes and seismology research
BGS Research
The BGS Earthquake Seismology Science Capability measures, records and analyses ground motions from earthquakes and other seismic events across the UK and surrounding area. Our data and research are the basis for understanding seismic hazard to guide risk assessment, planning and design of high-consequence structures such as nuclear plants, dams and reservoirs. We also use seismic waves to construct images of the Earth that help answer fundamental scientific questions about the nature of its interior.
Our monitoring network
We operate a real-time network of seismometers across the UK (Figure 1) to record and characterise earthquakes and their ground motions in order to inform UK Government, the public, industry and regulators following significant seismic events, to assess earthquake risk and to plan for future events.
The network also provides data to image the interior of the Earth and improve understanding of the driving forces of earthquakes and their interactions.
Recent earthquake data feeds
- Earthquakes in and around the UK (last 50 days)
- Induced seismicity in and around the UK (last 50 days)
- Significant world earthquakes (last 200 days)
- Online data feeds (GeoRSS & KML)
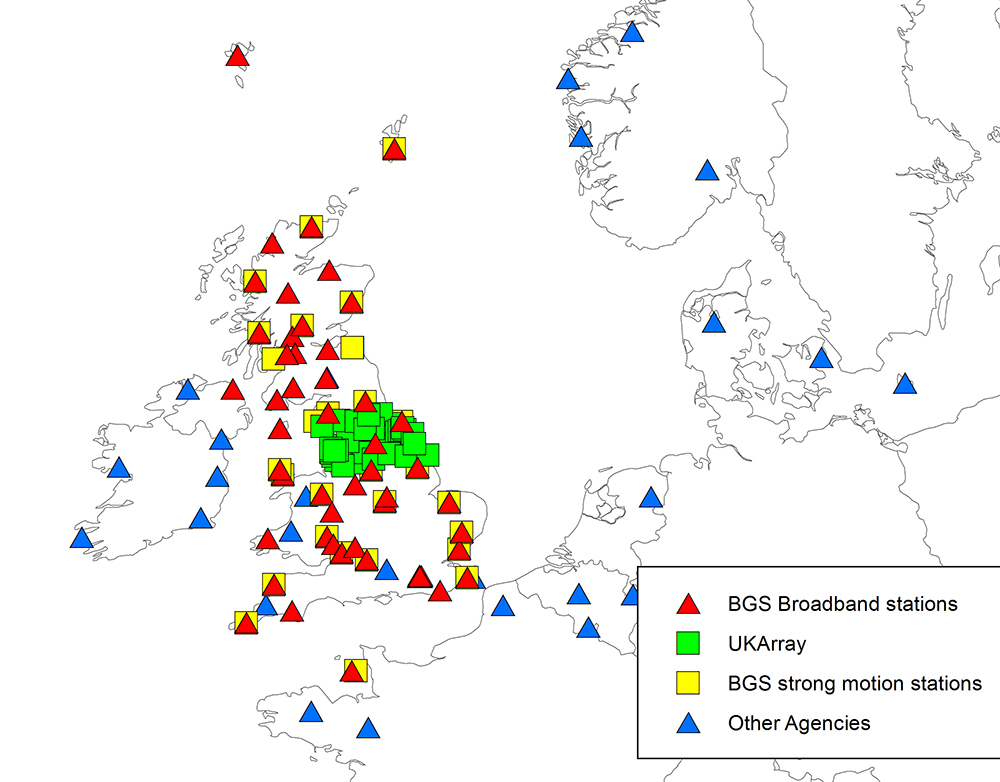

Figure 1: seismometers in the UK and surrounding area. BGS © UKRI.
Earthquake hazard
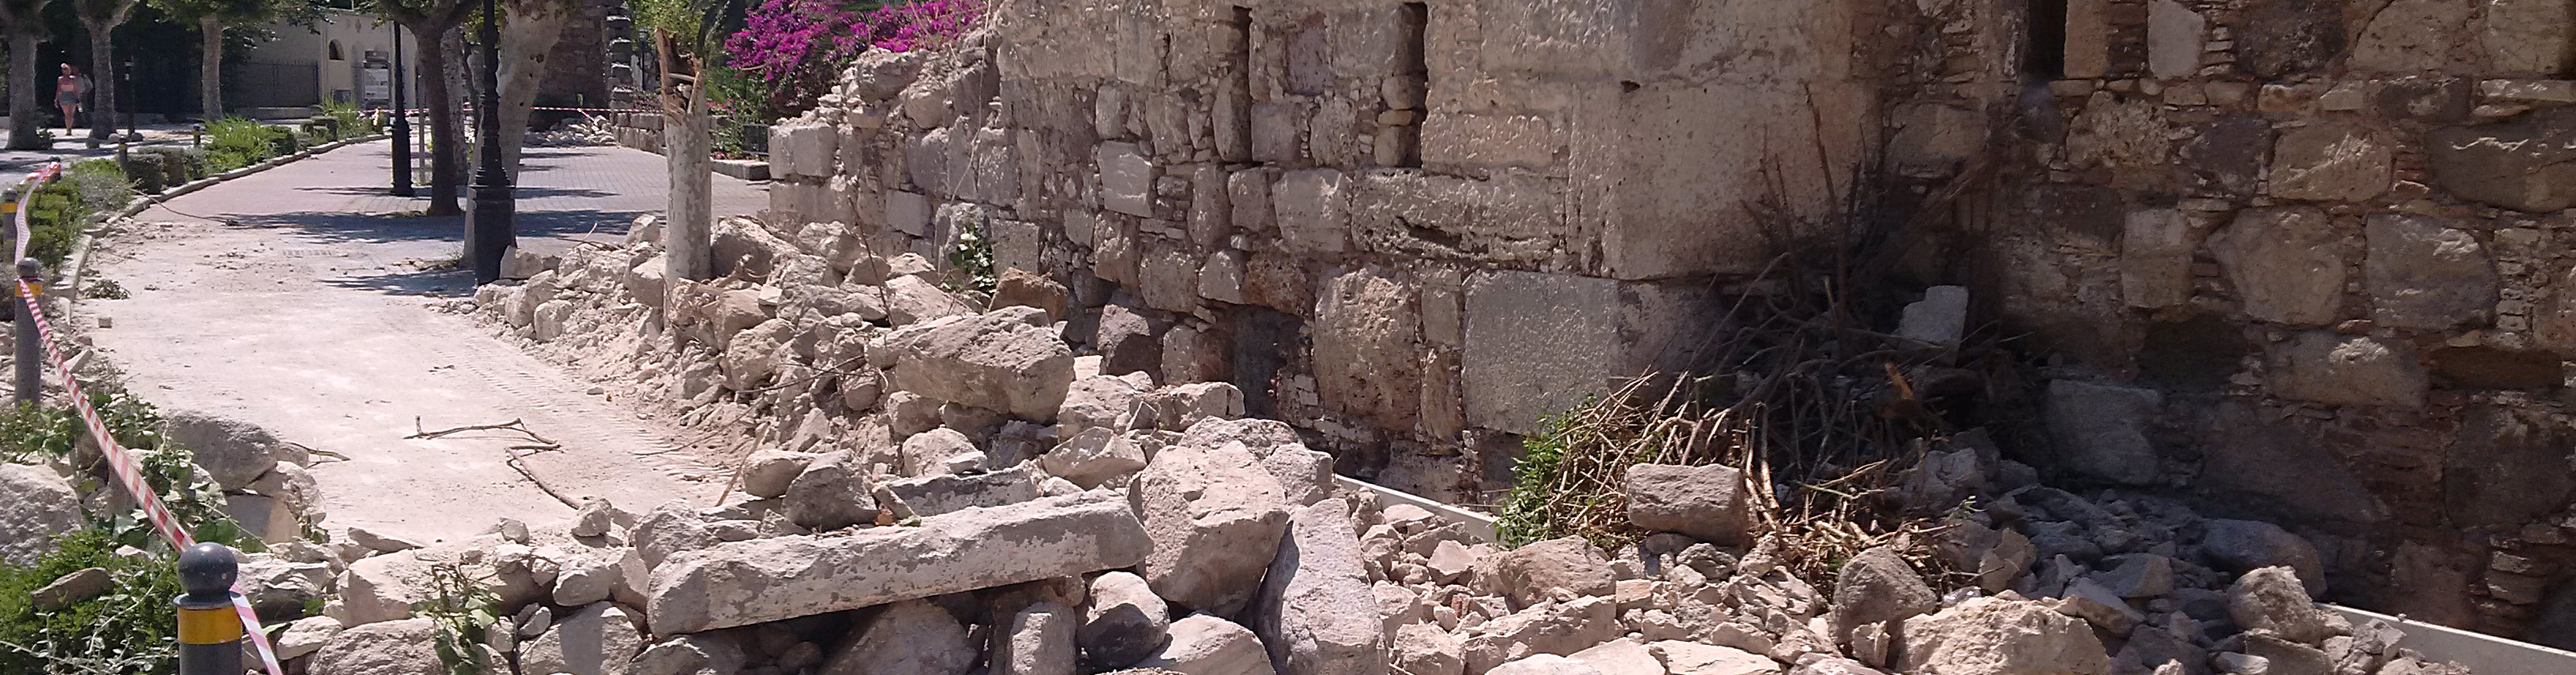
Earthquakes have a significant impact on people and infrastructure, both in the UK and worldwide. While damaging earthquakes are relatively rare in the UK, there are a number of well-documented examples over the past few hundred years (Figure 2).
The hazard is recognised by the government through the National Risk Register and National Risk Assessments. Long-term observation and measurement leads to improved confidence in seismic hazard assessments, helping regulatory decisions, setting of appropriate guidelines and safe operating practices in industry.
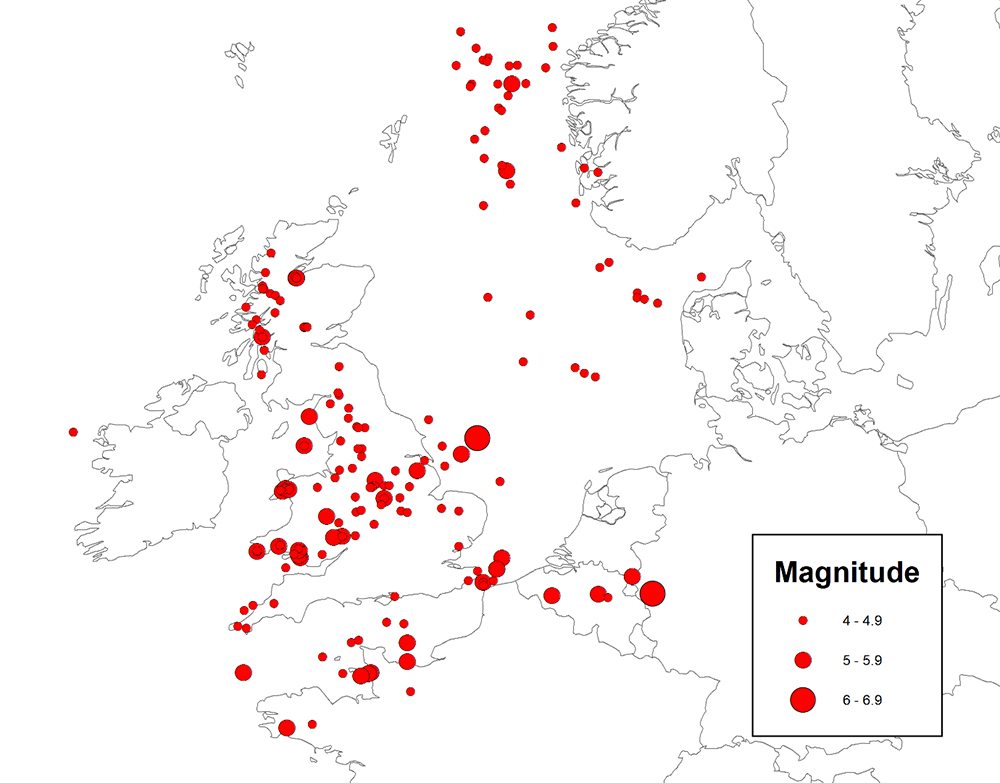
Figure 2: historical seismicity in the UK and surrounding area, dating back to 1358. BGS © UKRI.
What can earthquakes tell us?
Seismic waves from earthquakes contain information about both the earthquakes themselves and the structure and properties of the Earth. By analysing seismic waves recorded by this network of sensors, we can construct 3D images and infer values of crucial parameters of the subsurface (Figure 3).
In addition, monitoring changes over time allows us to understand and model Earth processes and structures on a variety of scales. This information helps us answer fundamental scientific questions about the subsurface and its future use both as a source for sustainable energy and as a means of energy and waste storage.
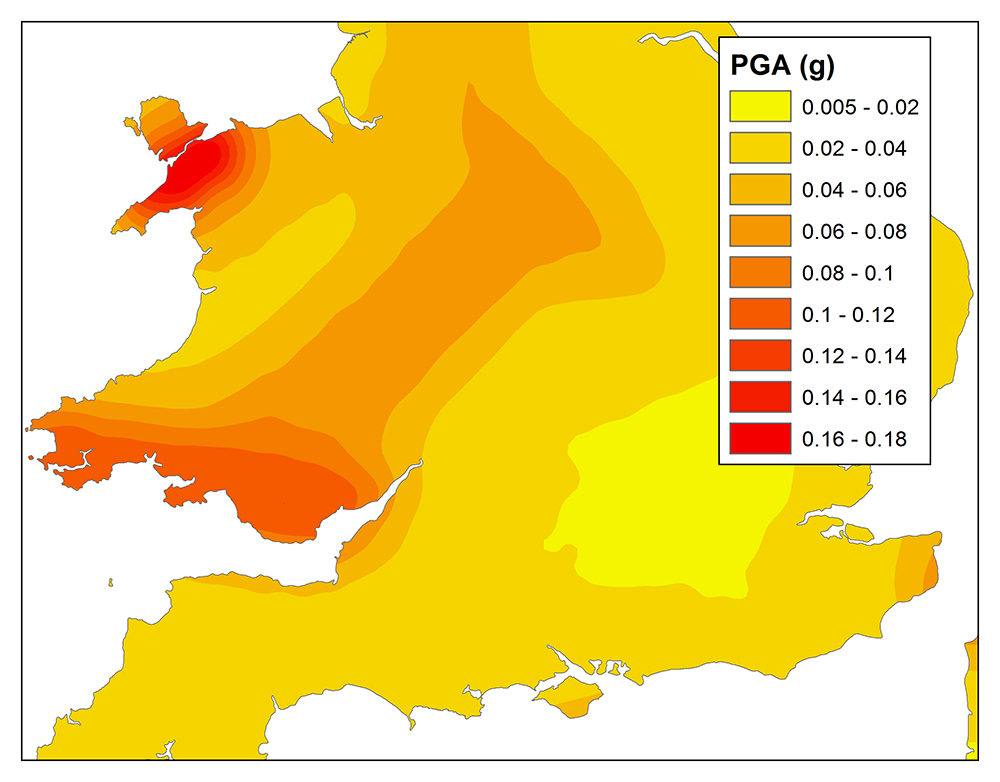
Figure 3: predicted peak ground acceleration for a 2500 year return period, from Musson and Sargeant (2008). BGS © UKRI.
Goals
- Operate a national network of seismometers that record earthquake ground motions, maintaining standards that comply with the best scientific practice and make the data widely available for scientific research.
- Provide prompt and objective information for significant earthquakes to help allay public concern, to co-ordinate an appropriate emergency response and to plan for future events.
- Improve confidence in seismic hazard assessments that lead to regulatory decisions, setting appropriate guidelines and ensuring safe operating practices in industry.
- Develop quantitative models of the interior of the Earth and its physical properties, monitor temporal change and constrain understanding of dynamic processes.
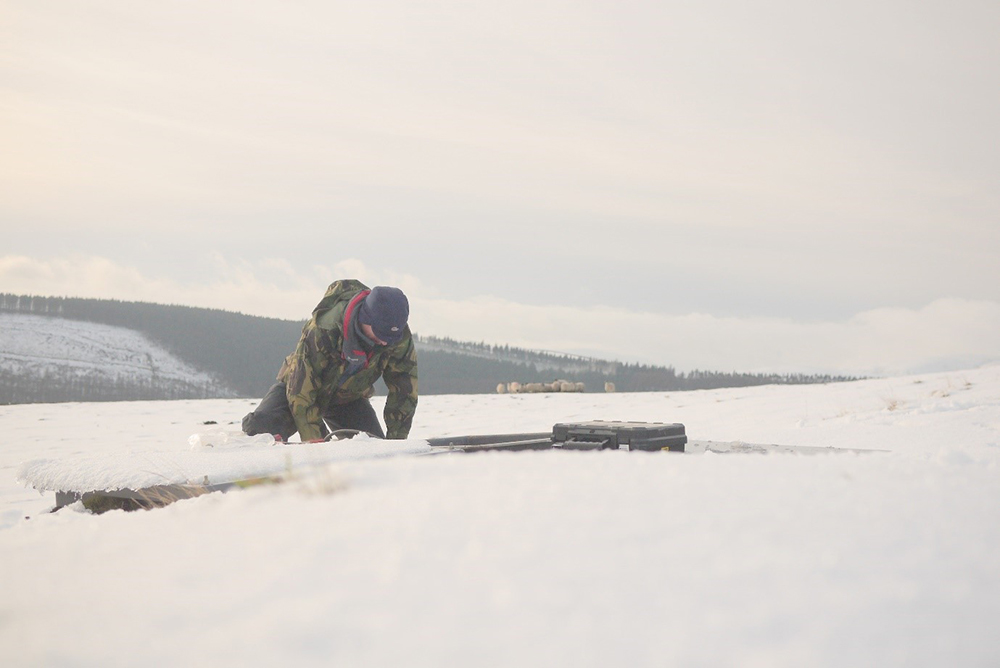
Figure 4: seismometer maintenance work can take place at any time and in any weather! BGS © UKRI.
ArcGIS Living Atlas earthquakes records
FAQs
Firstly, report a potential earthquake if you think you have experienced an earthquake — we’d be really grateful.
Even if we already know about an earthquake and know its magnitude and location, people’s felt experiences of an earthquake can provide valuable information about how the size and location of the earthquake translates into ground movement at any given point. Our analysts also normally process earthquakes in chronological order. If we start to receive felt reports, we prioritise processing that time range.
You can check to see if there has been any recent seismic activity in your area by checking our web pages, which contains information about earthquake activity in and around the UK in the last 60 days.
There can be several reasons for no evidence of a seismic disturbance being detected by the BGS seismograph network in your area, at the time and date you are enquiring about.
We record 20 to 30 earthquakes in the UK every year that are large enough to be felt by people, as well as many other smaller earthquakes that aren’t felt. However, we can’t detect all small earthquakes, so it is possible that you have felt an event that our instruments have not detected. Please report a potential earthquake, whether or not we have already detected it.
In many cases, our seismometers detect background noise from nearby human activity, which can be a particular problem in areas of high population density. If it is related to heavy traffic and industry or construction work, for example, we can often see that this activity shows a diurnal variation (differences between day and night time) and sometimes variations across week and weekend days too.
Noise from these sources is usually strongly localised and will only be recorded by nearby stations, whereas signals from seismic events such as earthquakes will be recorded at greater distances, so combining data from multiple sites helps us to detect more accurately.
Seismic events for which there is strong evidence that they have been induced by human activities are listed on our website.
Yes! You can access helicorder plots of the data for the last few days for each monitoring station on our website.
These charts show only one of the (at least three) components that each station has. You have the option to display a plot filtered by either ‘very long period’ or ‘short period’. The very long period has been filtered to make it better at showing large, distant earthquakes. The short period data has been filtered to make it better at showing smaller, more local earthquakes.
These are available in several different places.
- Our website lists earthquakes that have occurred over the last 50 days. We maintain separate web pages for events that we think are tectonic in origin or events that we think are induced by human activity
- We have an online database search that allows you to specify and area, time and magnitude to search, and gives you a list of earthquakes that is excellent for putting into a spreadsheet
- We contribute all identified earthquakes to the International Seismological Centre’s catalogue of earthquake activity around the world
- Our Onshore GeoIndex allows you to display earthquake locations on a map and to view images of seismic data from stations
A modern seismic station consists of an inspection cover, under which is there is a sensor that looks a bit like an upturned metal bucket.
Seismometers are very sensitive to ground motion; most of our seismic stations are in remote locations so that they aren’t distributed by people walking or driving past. These constitute a source of seismic noise that might hinder their ability to detect earthquakes.
Unfortunately we can’t help to implement your new prediction methods. New scientific discoveries need to be disseminated via publication in reputable, peer-reviewed scientific journals. Your first step would be to publish your science for it to be reviewed by other experts and BGS is not able to help with this.
BGS is unable to help to monitor damage caused by vibrations. There are commercial companies that specialise in carrying out this kind of vibration monitoring.
We go to a lot of effort to monitor and maintain our network, but faults can affect any technical equipment and our monitoring equipment is no different.
Most of our sites are in very remote rural areas where mains power can be less reliable. Where solar power is used, we can have problems in winter due to lack of light and solar panels can be damaged in storms, as can mains power lines.
For data transmission, we use a mixture of 3G, Satellite and ADSL. Reception of the 3G signal can be highly variable, satellite systems can be negatively affected by heavy rain/snow and when ADSL lines go down it can take a long time to get a repair done.
The monitoring equipment itself is also complex and can, from time to time, develop faults unrelated to any external factor.
Any of these issues could result in gaps in the data.
One of the challenges of seismology is that a source of ground motion that is small but close to a seismometer can cause it to record a ground motion that is larger than a powerful earthquake that is much further away. That means, for instance, that someone working in a field next to one of our sensors might create a signal that looks like an earthquake. That’s one of the reasons we need a network of sensors. We only treat something as an earthquake if we see it on multiple sensors. An event that is only seen on one sensor could just be a source of local noise that is very close.
No, definitely not! The smallest size of earthquake detected depends on the density of seismic monitoring stations: the more stations in an area, the smaller the earthquakes that can be detected. For the majority of mainland Britain, we would expect to be able to detect any earthquake of 2.0ML or above. In some places where we have more stations we can detect far smaller earthquakes. For instance, when we were monitoring an earthquake swarm near Gatwick Airport we were detecting earthquakes as small as -0.6ML.
That’s a more complex question than you may realise. The amount of shaking that you might feel is a function of the size (magnitude) of the earthquake, its distance from you, the type of building you are in and how high up in it you are, and the local geology. To what extent you might notice it will depend on what you are doing (asleep or awake; stood up or lying down) and how much human vibration is also being produced (for instance, if you live by a Tube line in London).
What we can say is we usually tend to start getting felt reports for earthquakes with local magnitude of 2 and above, but sometimes larger ones are not felt (or if felt, not reported) and sometimes smaller ones are felt and reported.
Each year we detect 200 to 300 earthquakes in the UK, but only 20 to 30 of them are felt.
We aim to provide the locations and magnitudes for the earthquakes that we detect as soon as possible after they occur. Usually, this process involves using measurements from as many monitoring stations as possible. However, sometimes, data from a station that would have recorded the earthquake may not be available because of data transmission or other problems. Adding measurements from these stations later may result in small changes to the location and magnitude.
We make the data from our monitoring stations available to agencies such as the European-Mediterranean Seismological Centre (EMSC) and the United States Geological Survey (USGS)’s National Earthquake Information Center to help detect and locate earthquakes from all around the world. These agencies, however, are primarily only interested in large or potentially damaging earthquakes and they may use only a subset of the available data for smaller earthquakes in the UK. This means that their estimates of the locations and magnitudes may differ from estimates that use all available data.
Detecting and locating large and damaging earthquakes, as the EMSC and the USGS do, involves processing a huge amount of data, so they use automatic methods that allow them to estimate the location and magnitude of events very quickly. These automatic estimates are often published before they are reviewed by a human analyst. While we also use these automatic methods, all the events that we report are reviewed by a human analyst before they are published, so our location and magnitude estimates may not be available as quickly. Very occasionally, the automatic methods can get things wrong but these are usually corrected after review.
Reference
Musson, R M W, and Sargeant, S. 2008. UK earthquake monitoring 2007/2008. British Geological Survey Open Report OR/08/072. (Edinburgh, UK: British Geological Survey.) (Unpublished.)
Find out more about our research

BGS Earthquakes and Seismology
As the UK’s national earthquake monitoring agency, BGS operates a network of sensors across the UK to monitor both British and overseas earthquakes, and provide objective information to government, industry and public.

Our projects

Centre for the Observation and Modelling of Earthquakes, volcanoes and Tectonics (COMET)
Analysing satellite measurements alongside ground-based observations and geophysical models to study earthquakes and volcanoes.
Related news
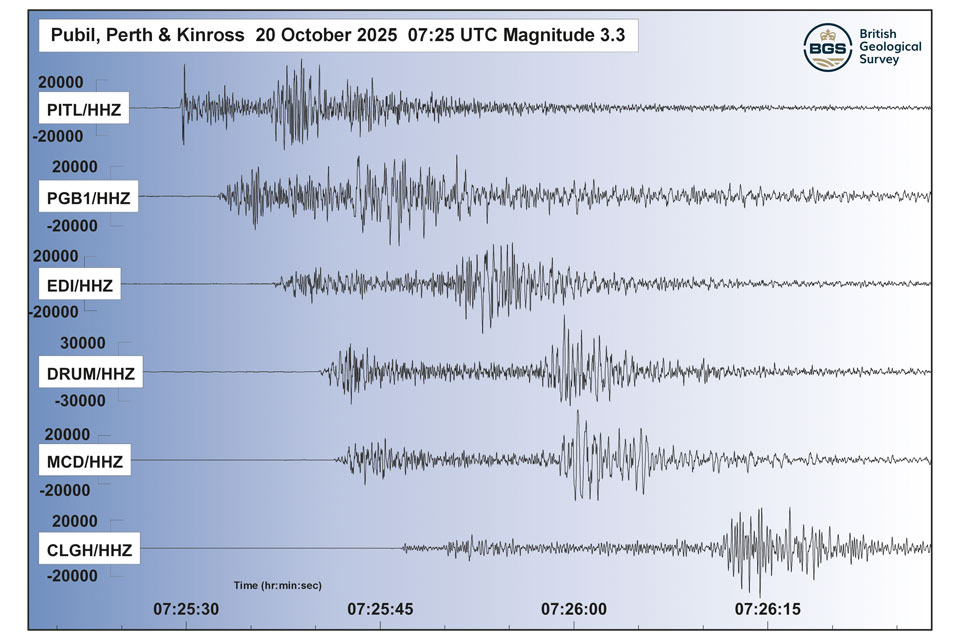
Perth and Kinross tops the UK’s earthquake activity charts for 2025
29/12/2025
Seismologists at BGS have published data on the number of seismic events over the past 12 months with over 300 earthquakes recorded.

New research shows artificial intelligence earthquake tools forecast aftershock risk in seconds
25/11/2025
Researchers from BGS and the universities of Edinburgh and Padua created the forecasting tools, which were trained on real earthquakes around the world.

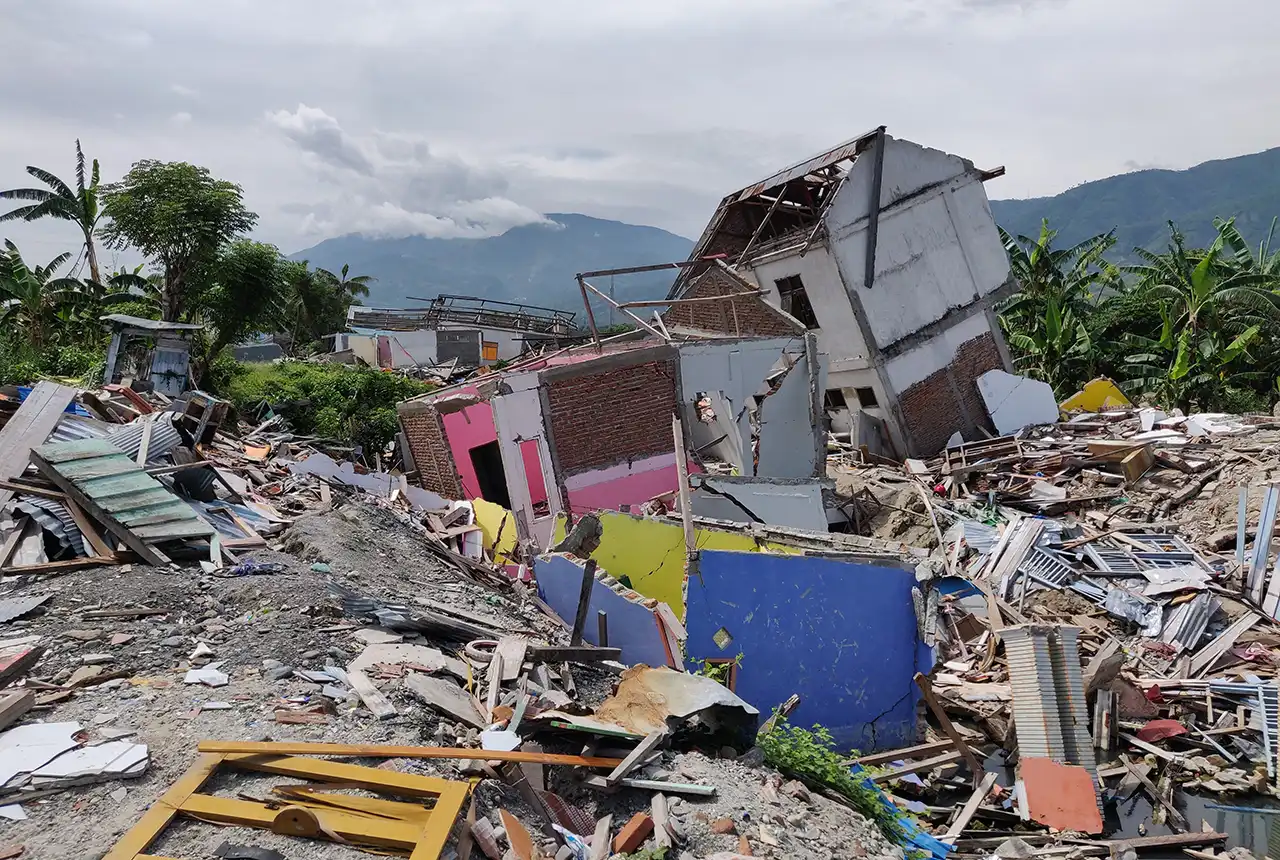
New research highlights significant earthquake potential in Indonesia’s capital city
04/11/2025
Research reveals that a fault cutting through the subsurface of Jakarta could generate a damaging earthquake of high magnitude.
New report sets pathway to reduce the impacts of geohazards in one of the world’s most hazard-prone nations
30/09/2025
A new White Paper, co-developed by Indonesian and UK hazard experts, presents a strategic roadmap to significantly reduce the impacts of geological hazards in Indonesia.

Oasis revealed as Scottish capital’s ‘most seismic’ concert
07/08/2025
Twenty years of evidence from earthquake monitoring proves the Britpop legends are the most ‘ground shaking’ musical act to perform at Murrayfield Stadium, with the chance to secure their position at the top of the charts this weekend.
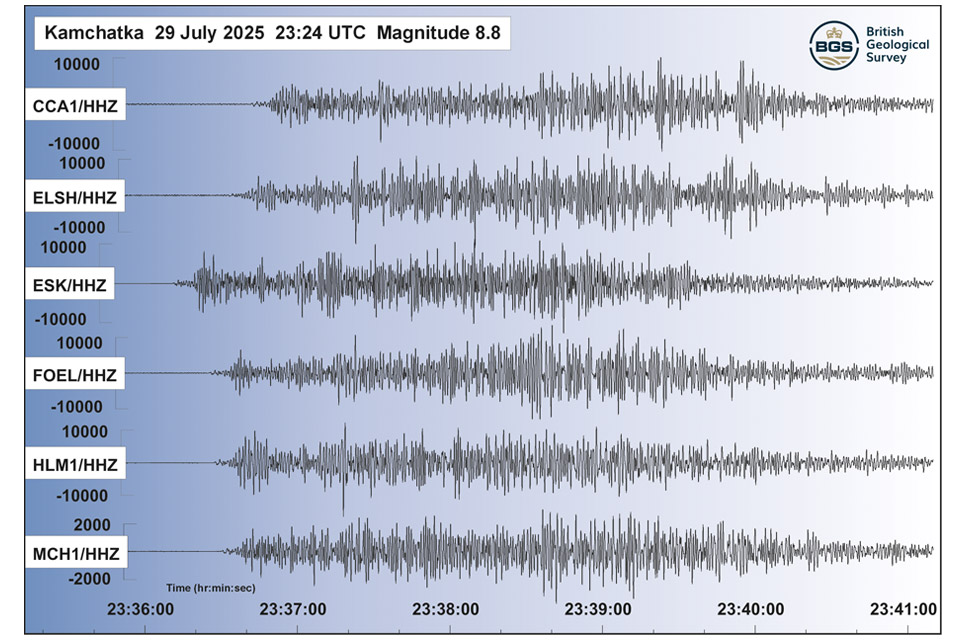
Kamchatka earthquake highlights the advances in tsunami early warning systems
31/07/2025
The response to the 8.8 magnitude earthquake in Russia has emphasised how far scientific understanding of tsunamis has come over the last two decades, and the improved mitigation measures that are now in place.
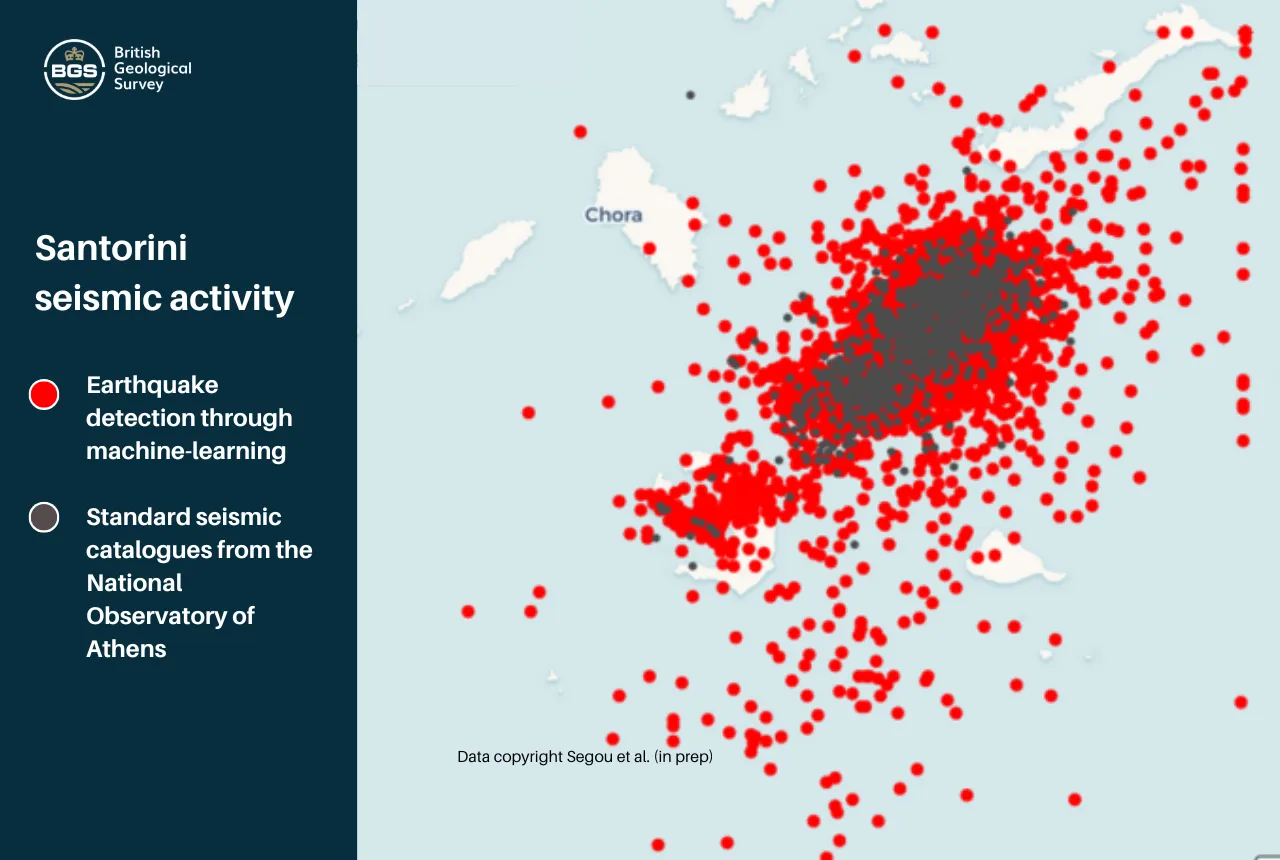
Artificial intelligence is proving a game changer in tracking the Santorini earthquake swarm
07/02/2025
Scientists are harnessing the power of machine learning to help residents and tourists by detecting thousands of seismic events.
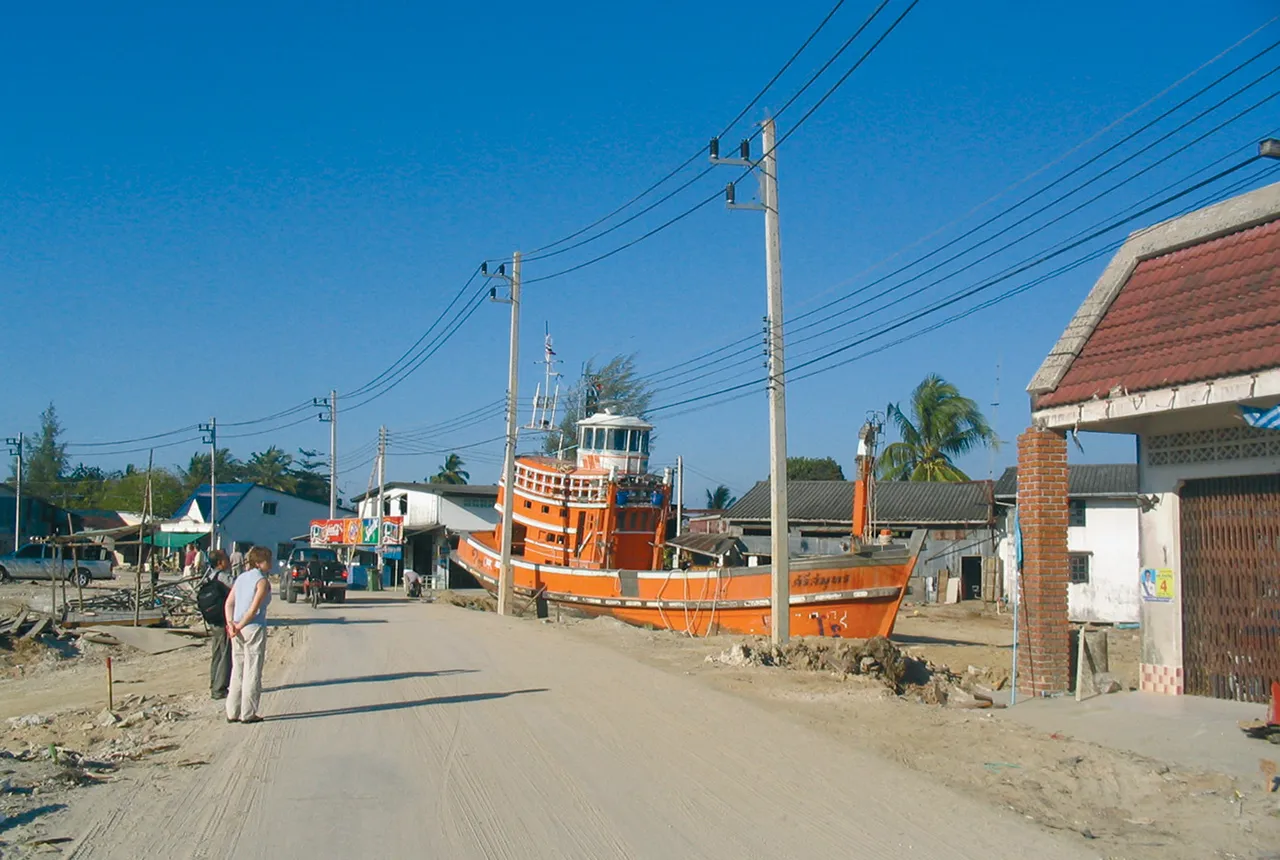
Twenty years on: the Indian Ocean earthquake and tsunami
26/12/2024
Boxing Day 2024 marks 20 years since the Indian Ocean earthquake and tsunami. Prof David Tappin reflects on the disaster and discusses what we have learnt since 2004.
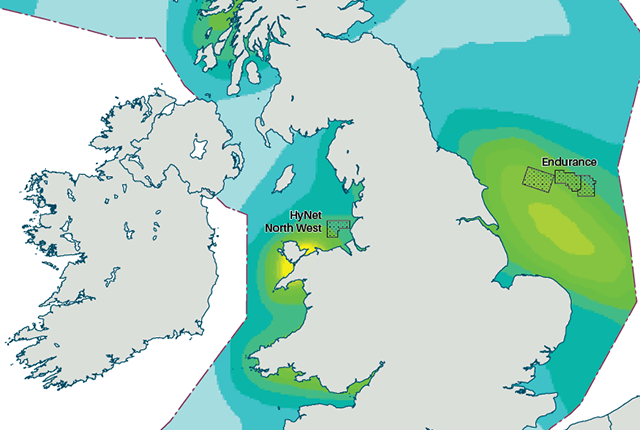
New hazard maps set to help safeguard UK offshore energy industry
12/09/2024
Essential geological model detailing seismic hazard published as the pursuit of new renewable energy infrastructure intensifies.
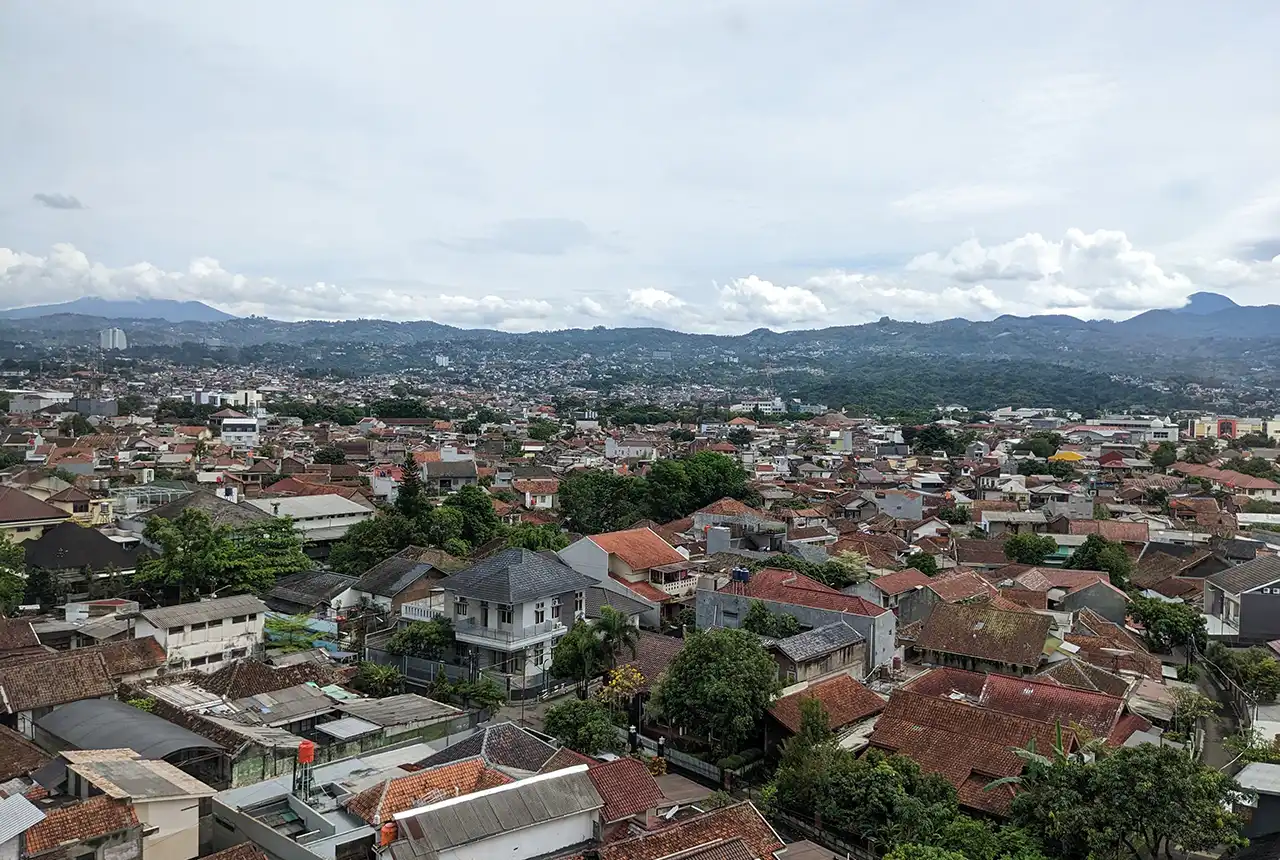
Nearly three million people in Indonesia’s second city could be affected by an earthquake
17/07/2024
BGS-led research reveals the number of people in the Bandung metropolitan region who could be exposed to a major earthquake.

Quake it off: Taylor Swift concerts shake Edinburgh
13/06/2024
Seismometers around Edinburgh were triggered by the rapturous Murrayfield crowds over the weekend.

BGS seismologist named editor-in-chief of Geophysical Journal International
29/02/2024
Margarita Segou has been appointed as the editor-in-chief of one of the world’s leading, peer-reviewed research journals in solid-Earth geophysics.
You may also be interested in
Shallow geohazards
Measuring, recording and analysing near-surface geological hazards including landslides, sinkholes and discontinuities.
Disaster response
BGS Geodesy and Earth Observation provides satellite imagery and expertise that is used to determine the effects of disaster events.