3D visualisation systems
BGS Research
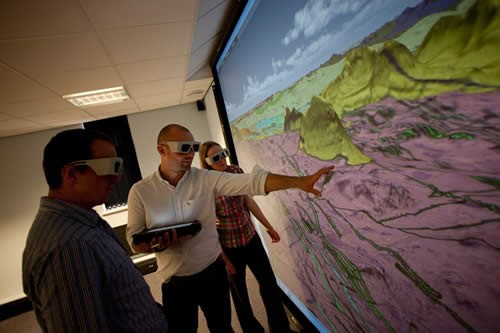
Geoscience visualisation is a fast-growing area and the BGS is one of the world leaders in its application and development. Visualisation systems enable geoscientists to communicate with each other and with end users from diverse disciplines to better understand complex and varied datasets.
The three-dimensional visualisation systems (3DVS) team works closely with business partners to develop immersive visualisation systems and techniques for geoscientists.
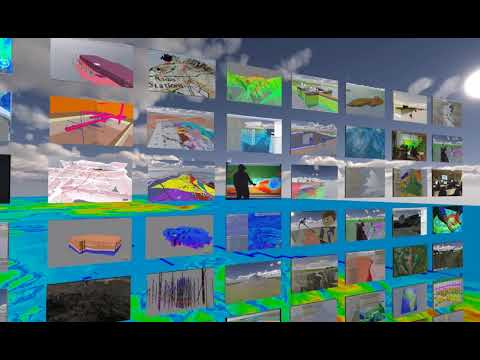


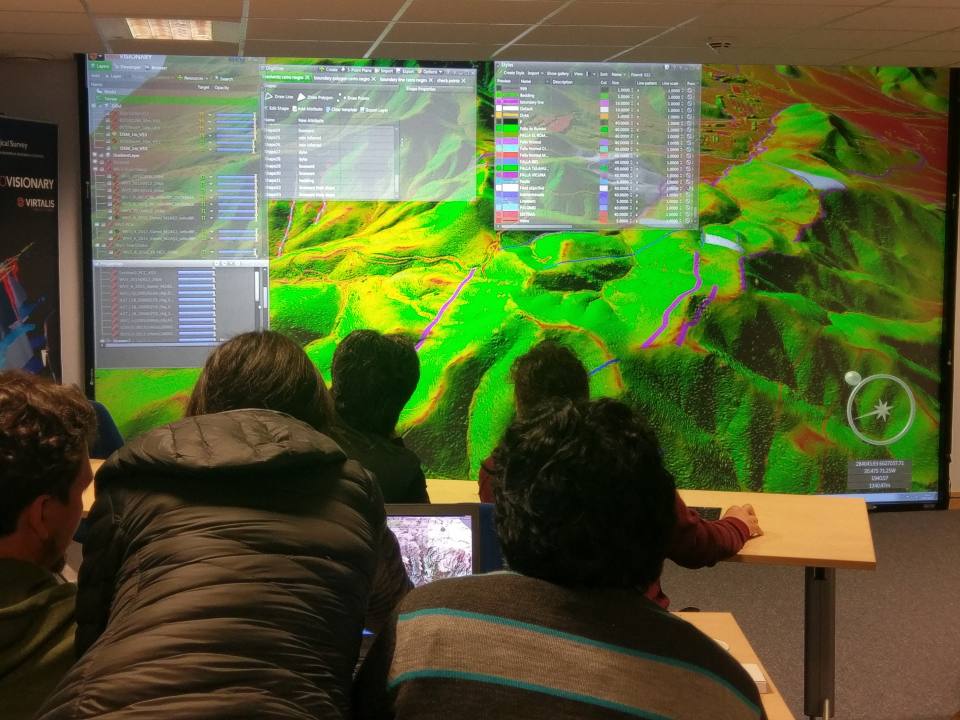
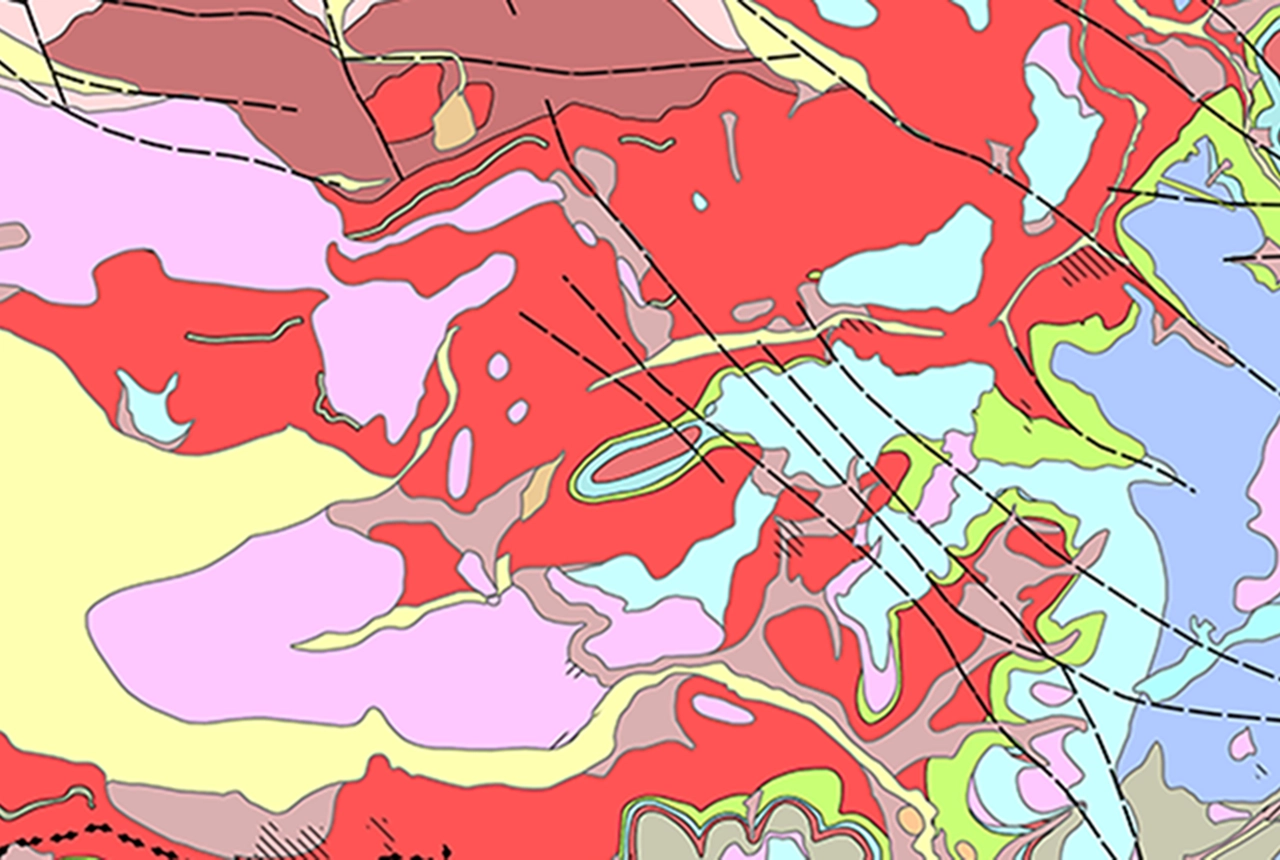
A montage of 3DVS visualisations in GeoVisionary. BGS © UKRI.
We use the latest software and hardware to visualise geoscience data in 3D and provide a mechanism for effective communication of BGS science. By using dedicated 3D visualisation facilities to run software such as GeoVisionary, geological understanding and risk/confidence is more easily conveyed.
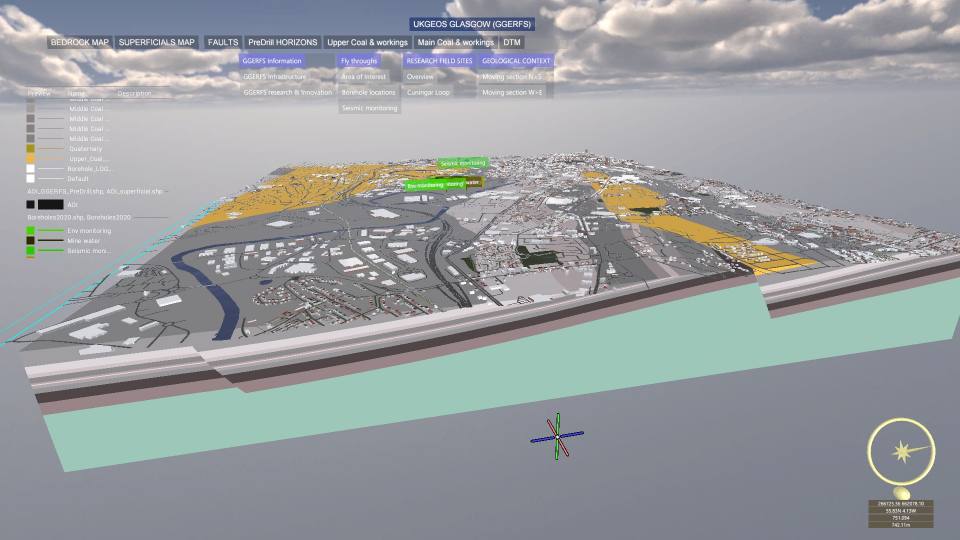
The 3DVS team has been involved in a number of high-profile projects such as the UK Geoenergy Observatories.
The BGS is proud to develop GeoVisionary in collaboration with Virtalis Ltd.
GeoVisionary is a world-leading geoscientific information system for visualisation and interpretation of geoscience datasets in a virtual reality environment.
Geoscientists use a wide variety of software to answer specific questions. Each is usually modelled and visualised in its own package. GeoVisionary is the first software to offer the ability to comprehensively visualise all of these elements together in a single, immersive, 3D stereoscopic environment, as well as on desktop PCs and laptops.
Geoscience datasets are often huge and high-resolution visualisation can be difficult with existing software. GeoVisionary solves this problem by loading entire baseline datasets (DEM and Imagery) of virtually unlimited size and detail, allowing the user to load localised data from diverse sources without delay. GeoVisionary’s powerful graphics rendering engine gives seamless, real-time access to the entire data resource.
We have created an add-in for ArcGIS that links the GIS with GeoVisionary, connecting traditional GIS with the 3D virtual landscape.
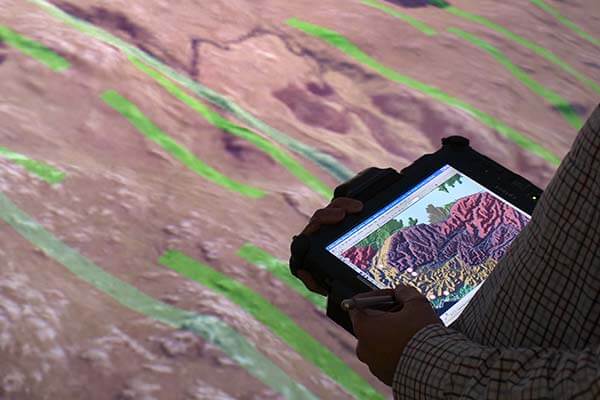
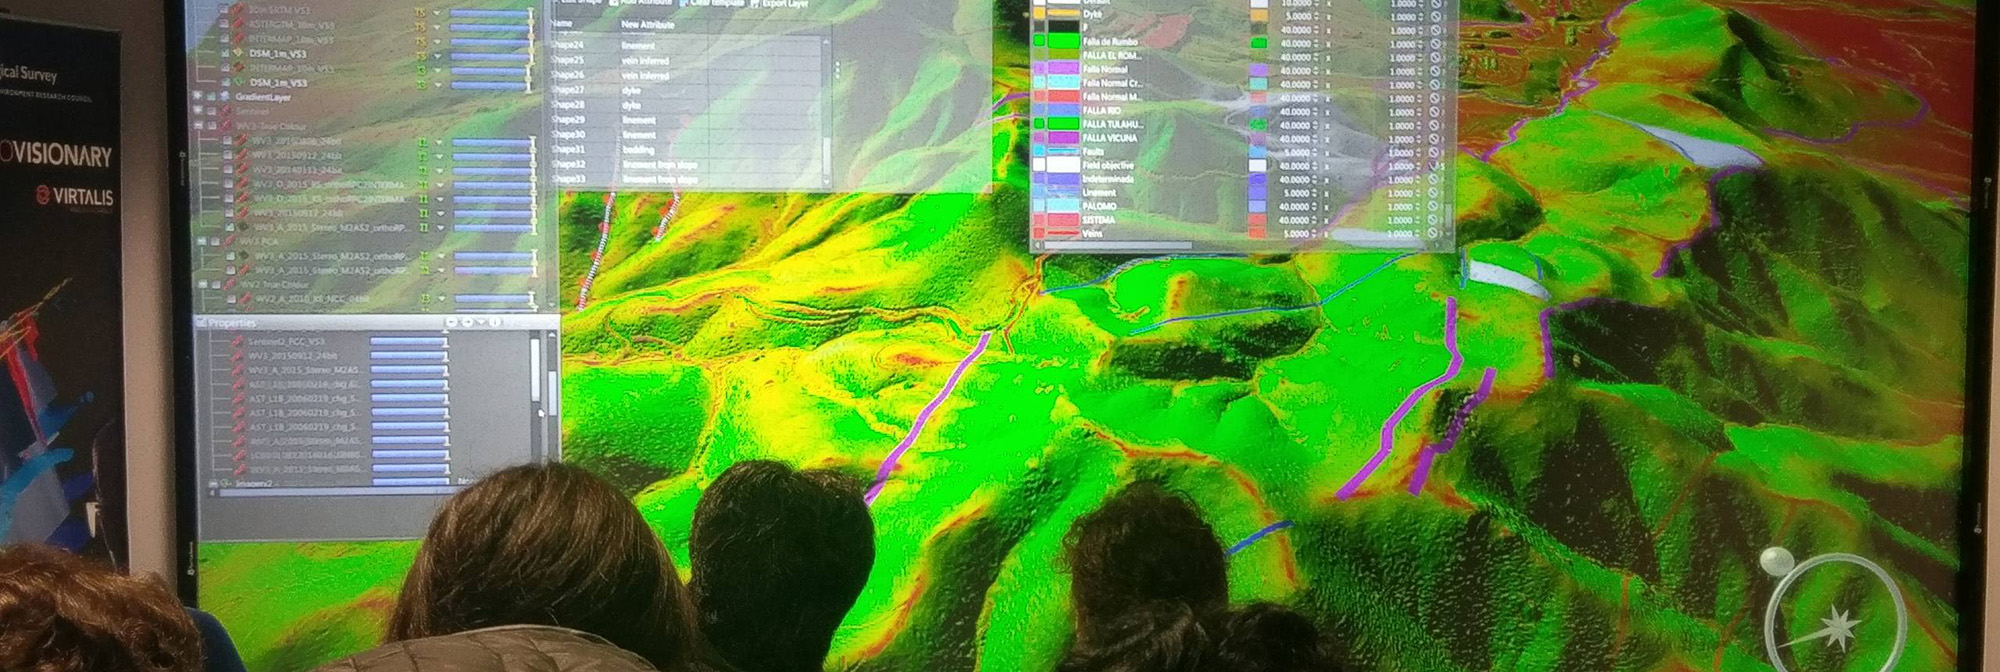
The BGS virtual field reconnaissance (VFR) workflow was recently used in cooperation with the Chilean Geological Survey (SERNAGEOMIN) and the Chilean National Mining Company (ENAMI) for geological mapping in a complex area of Andean geology.
Pre-fieldwork, geologists used GeoVisionary with high-resolution satellite imagery, terrain models and geological information to digitise geological features, re-interpret existing maps and identify and prioritise targets for field investigation.
This interpretation was taken to the field locations to be verified and augmented by geologists using the BGS digital data capture system (BGS•SIGMA), leading to a final geological interpretation and creation of a geological map.
Using GeoVisionary and the BGS VFR workflow means that geologists go into the field with a good understanding of the terrain that they are interpreting. Pre-field interpretation and target prioritisation focus the field effort and increase efficiency; valuable field time is not wasted in areas that could be interpreted with VFR. The result is an improved geological map in less time.
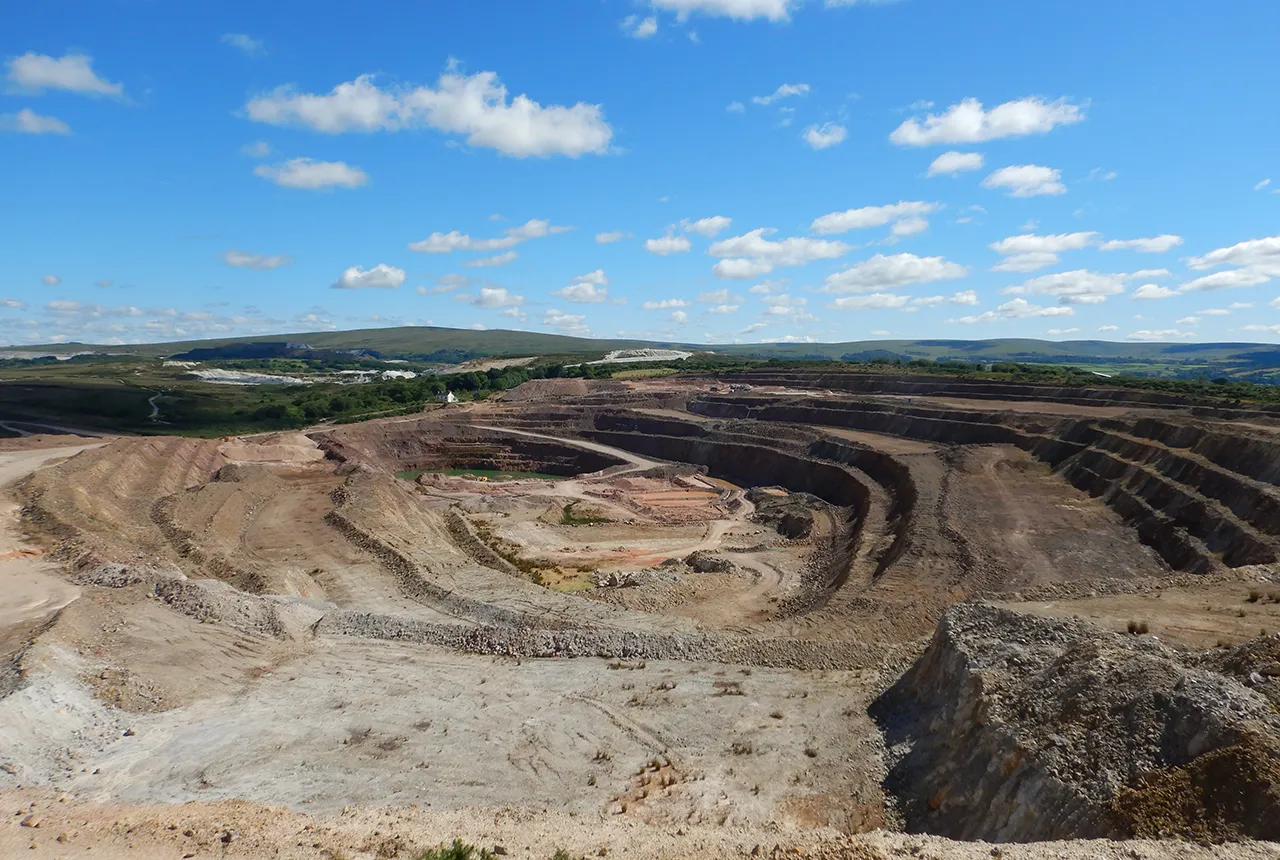
Visualisation and interpretation of regional resources and their properties is important for assessing potential reserves and hazards associated with their extraction and their impact on the environment. The 3DVS team can help bring together hundreds of datasets into GeoVisionary to show relative locations and analyse such things as:
- aquifers and their permeability
- shale rock gas/oil net maturity
- lithological variation of soils and rocks in and around cities
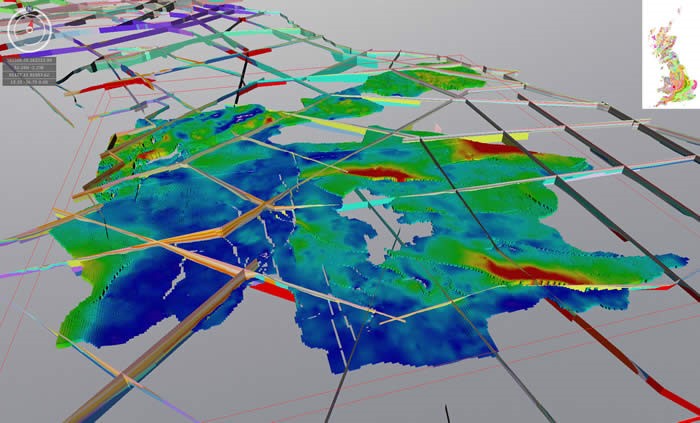
Voxel model showing distribution of Bowland Shale in the north of England. BGS © UKRI.
LiDAR laser scans are routinely used to capture the morphology of quarries, cliffs, caves and tunnels along with other geological data to attain very fine-resolution datasets to millimetric precision. These scans can contain a number of points ranging from a few thousand to several billion. The 3DVS team works closely with our laser-scanning experts to help visualise these points in the virtual world.
Figures 1 and 2 show how laser-scanned point clouds have been visualised with GeoVisionary to help monitoring and understanding of coastal erosion. Loading multiple scans allows measurements to be taken between scans from different dates. Stitching together the onshore LiDAR and offshore bathymetry data, both at 1 m spatial resolution, results in a seamless elevation surface.
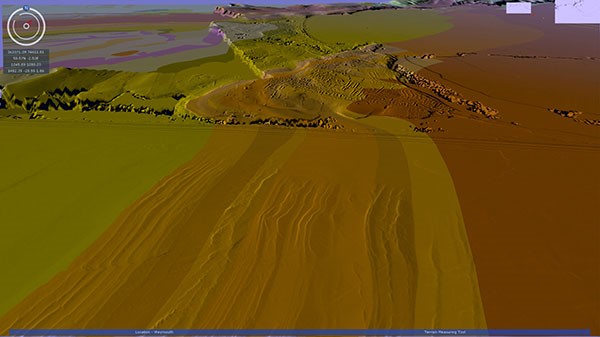
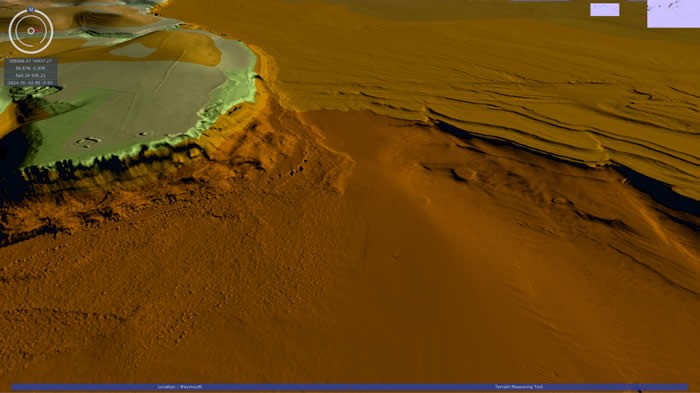
Figure 2: St Alban’s Head white ribbon. View in GeoVisionary looking east at St Alban’s Head near Swanage, showing the cliffs of Portland Group limestones continuing into the drowned landscape beneath the sea. BGS © UKRI.
Images contain SurfZone Digital Elevation Model 2014 under Open Government Licence.
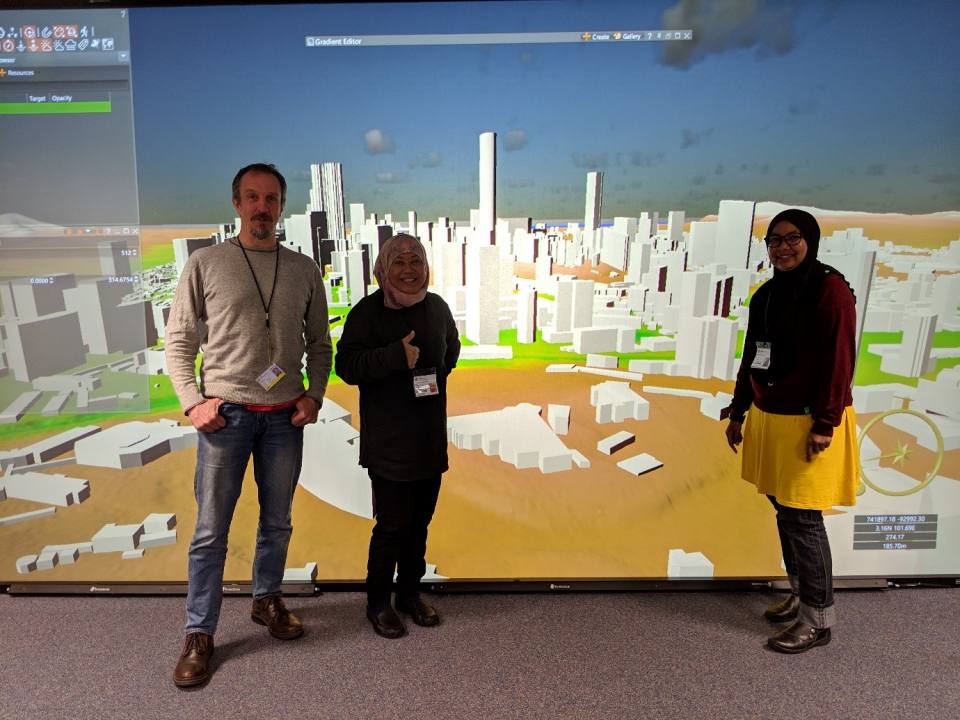
GeoVisionary provides simultaneous high-resolution 3D visualisation of city models and geoscientific models. UNITEN in Malaysia use GeoVisionary for their ViGMAS Geohazard Virtual Reality for Assets Management System research project.
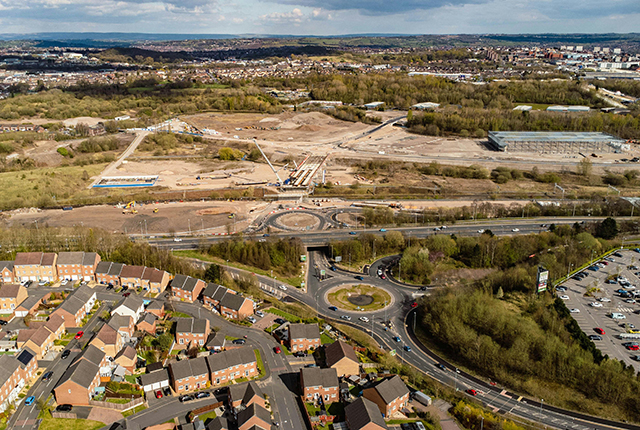
GeoVisionary helps us to understand the geology under our feet, but it is also an important tool for visualising future developments and communicating risk and environmental impact.
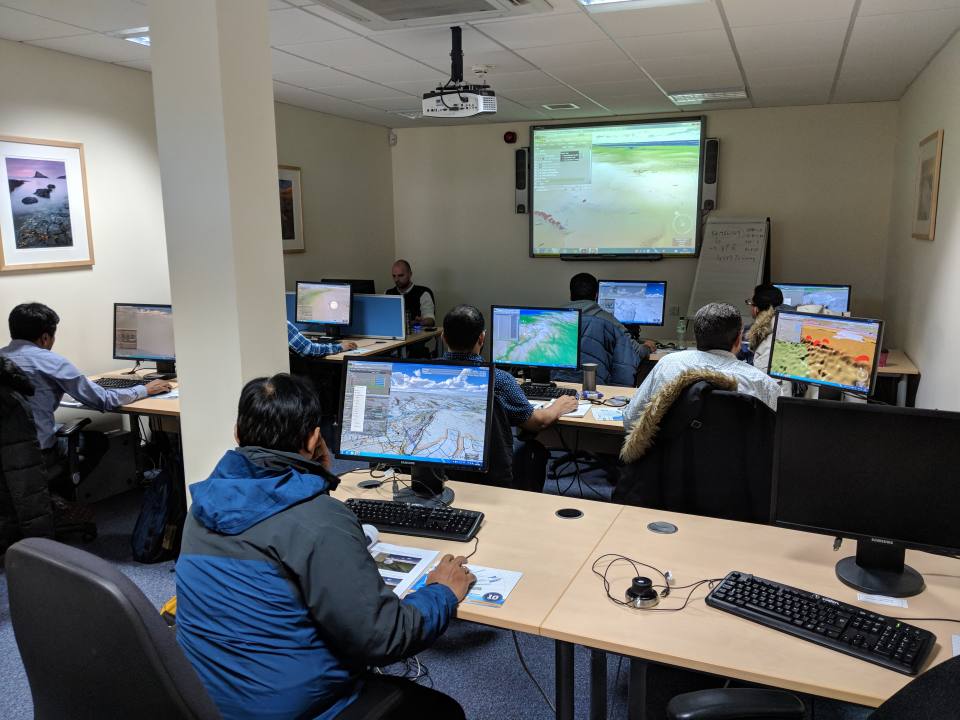
3DVS offer training in GeoVisionary, whether via teach-yourself movies or classes of up to 10 at our Keyworth headquarters in Nottinghamshire. We can also deliver training at customers’ own premises or by video link.
For more information, see the BGS GeoSchool, or contact our BGS Learning and Development (training@bgs.ac.uk) for course fees, scheduling and availability.
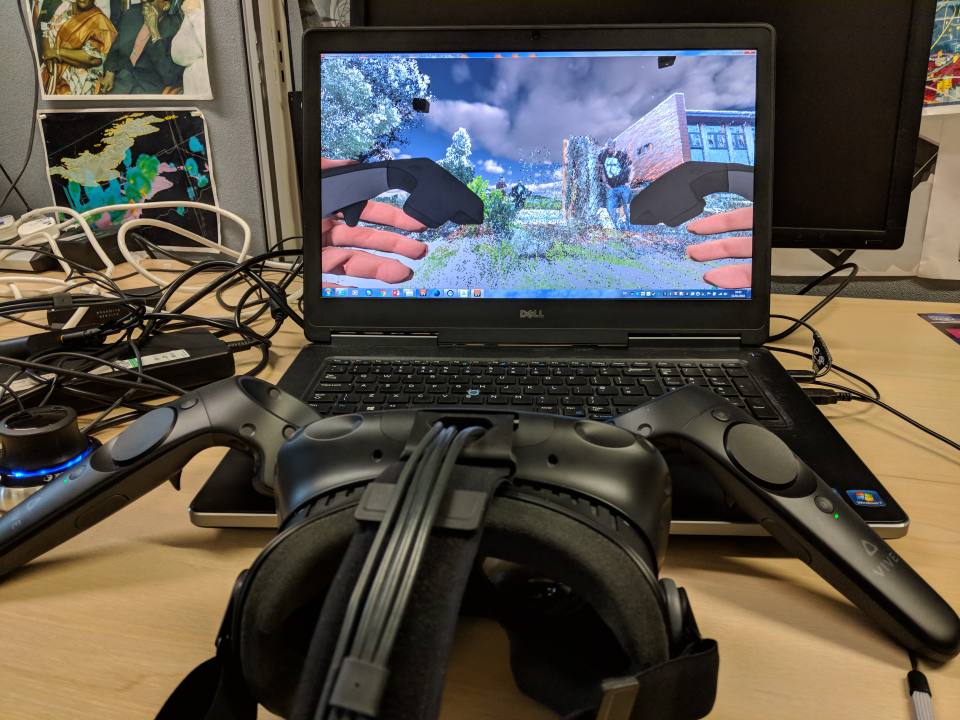
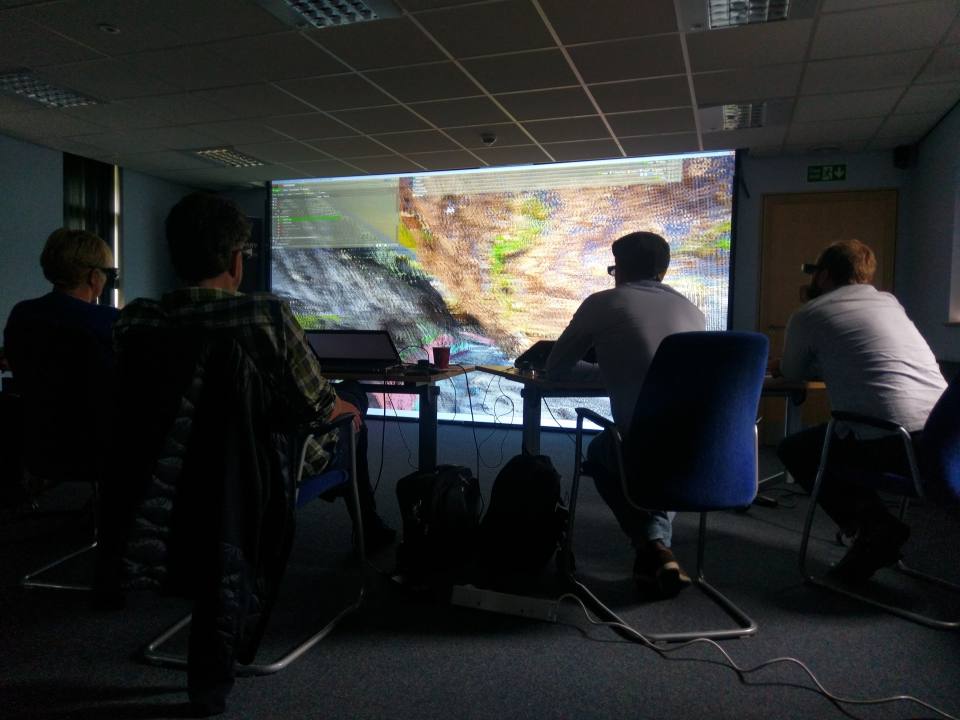
We have a Virtalis ActiveWall single-channel stereographic visualisation system at our headquarters in Keyworth, Nottinghamshire. This system is powered by a PC feeding into a Christie 4K30 projector.
The 3DVS team provides support, training and expertise for the visualisation and analysis of data from GIS and geological models in software such as GeoVisionary, ArcScene, ArcGlobe, Google Earth, NASA World Wind and QT Modeler.

We have installed an augmented sandbox exhibit at our headquarters in Keyworth, Nottinghamshire. Known as the SARndbox, the interactive exhibit was primarily set up for school science events and public open days. However, visitors are welcome to drop anytime during our office opening hours (Monday to Friday, 08:00 to 17:30) and have a play.
Originally designed and implemented by Oliver Kreylos at UC Davis’s W. M. Keck Center for Active Visualisation in the Earth Sciences, a small team of BGS staff (Vince Hulland, Bruce Napier and Humphrey Wallis) took the design and developed an improved version. (See Oliver’s original design.) Our improved design uses a better projection path, which produces a cleaner surface image with less shadowing compared to its original counterpart. It also requires a space with lower ceiling clearance than previous models.
The SARnbox system runs on a Dell T5610 PC with the Fedora 19 (KDE edition) operating system on an SSD drive. The PC uses an Intel i7 combined with a Geforce 780GTX graphics card and 8Gb of RAM. On top we are using an Epson EB 4550 central throw projector with an Xbox 360 Kinect. The Kinect acts as the 3D imaging camera/detector.
As you dig around in the sand, the Kinect is able to detect the changes in the sand’s surface using a laser light and some basic trigonometry. These changes are then fed back to the SARnbox program, which in turn dynamically remaps the surface image to reflect any changes. This is then output via the overhead projector back on to the surface of the sand. The process is repeated 30 times a second.
Using the same dynamic model, the SARndbox can also calculate and project fluid motion over the virtual surface with some very impressive results.
Meanwhile back at Davis University, Oliver continues to develop the SARndbox app with many new and existing features planned for the next release.
Related news

New 3D model to help mitigate groundwater flooding
08/12/2025
BGS has released a 3D geological model of Gateshead to enhance understanding of groundwater and improve the response to flooding.
Latest BGS Geology 50K mapping data launched
06/11/2025
Some of our most widely used maps have received a major update, including the 1:50 000-scale map series that now includes enhanced coverage of Great Britain.
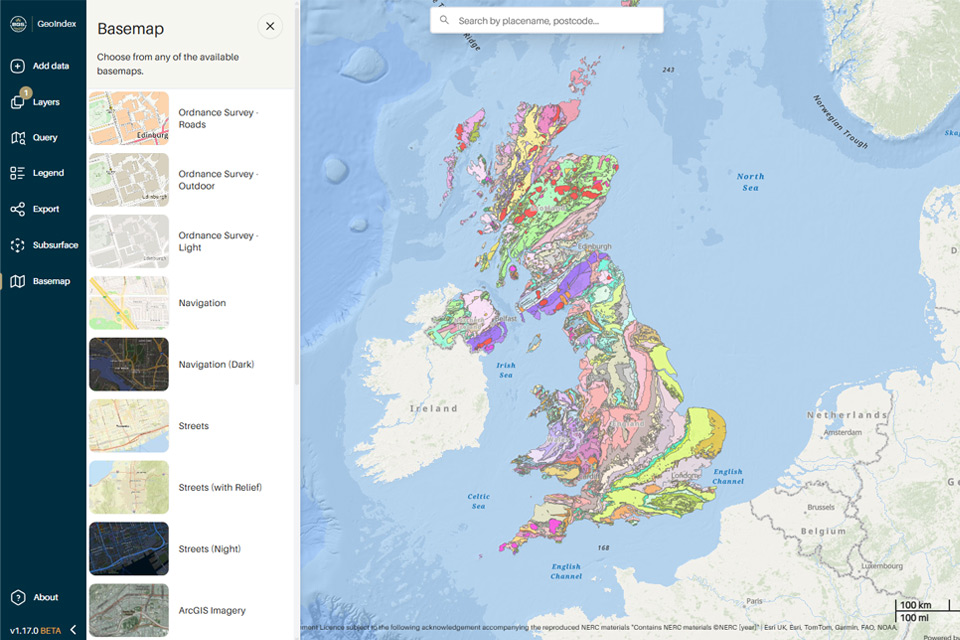
New BGS GeoIndex viewer released for user testing
24/09/2025
The premium map-viewing application has been given a major upgrade and made available as a beta release.
New tool helps identify coal mine gas risk for housing developments in Scotland
05/08/2025
Scientists have co-developed a new tool for North Lanarkshire Council to help screen coal mine gas emissions prior to the development of new houses and buildings.
Celebrating 20 years of virtual reality innovation at BGS
08/04/2025
Twenty years after its installation, BGS Visualisation Systems lead Bruce Napier reflects on our cutting-edge virtual reality suite and looks forward to new possibilities.
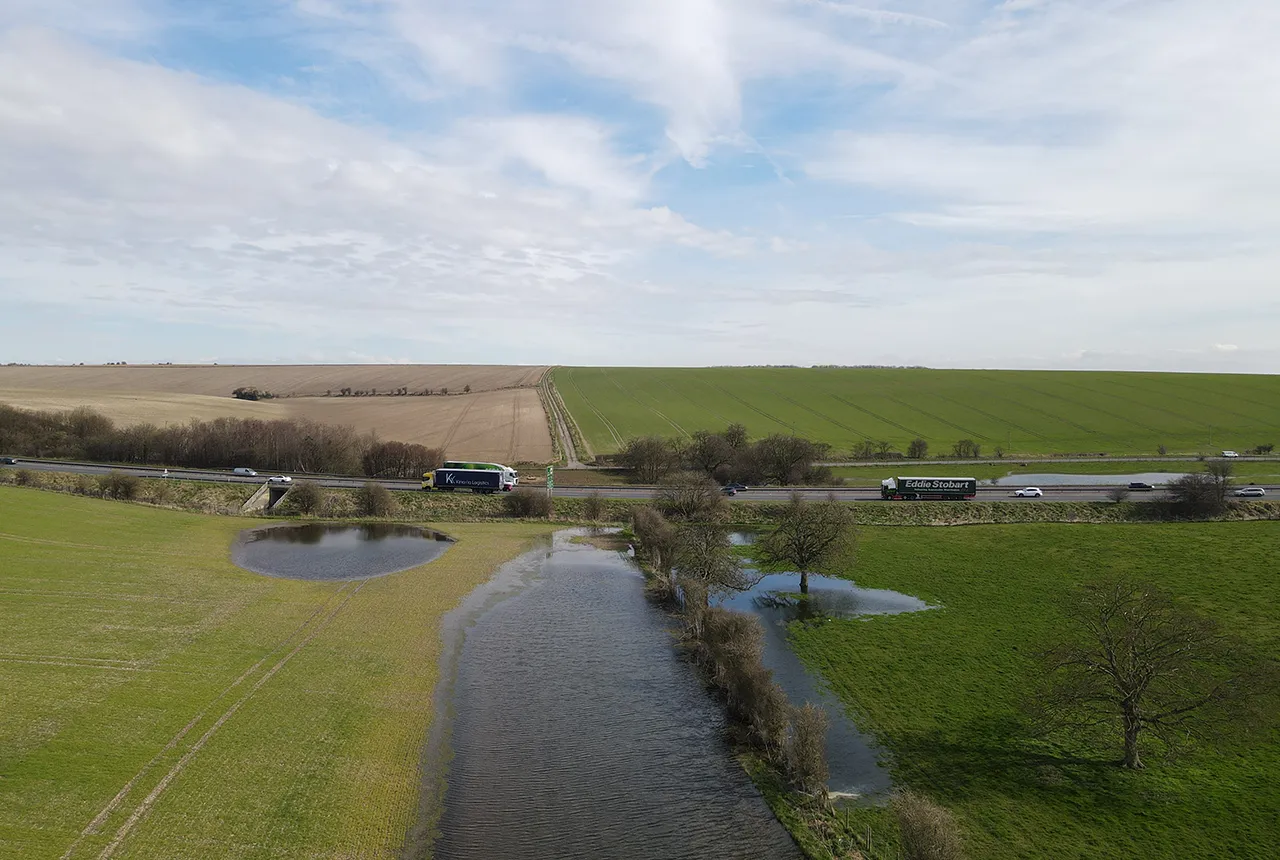
Pioneering tool expanding to analyse agricultural pollution and support water-quality interventions
06/02/2025
An online tool that shows which roads are most likely to cause river pollution is being expanded to incorporate methods to assess pollution from agricultural areas.
BGS makes significant advance in mineral data accessibility
10/12/2024
A new public application programming interface for the BGS World Mineral Statistics Database will revolutionise how users interact with critical data.
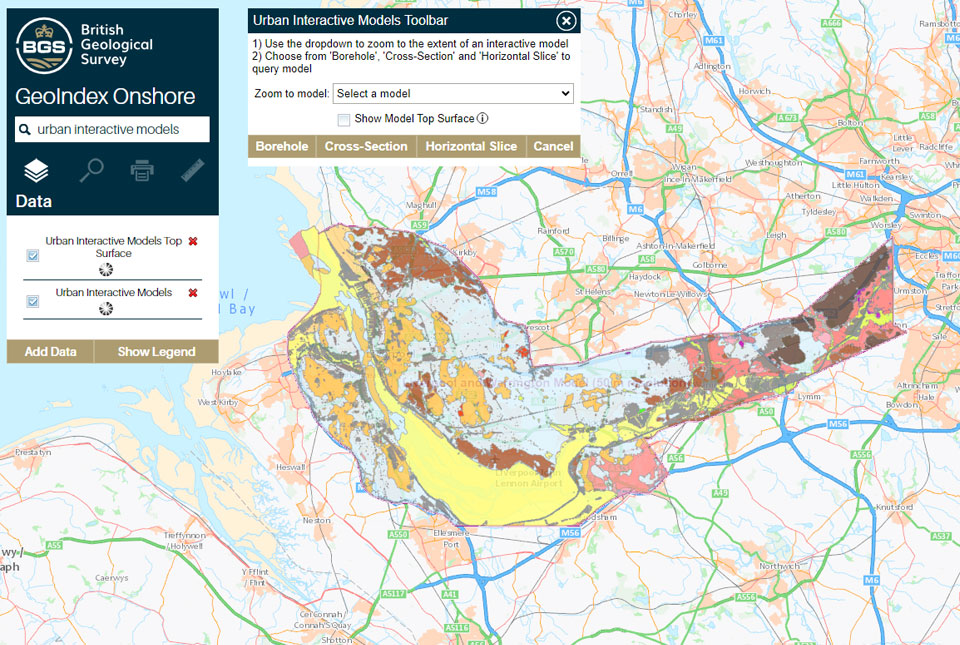
What lies beneath Liverpool?
11/10/2024
The geological secrets lying under the surface of Liverpool and Warrington have been unveiled for the first time in BGS’s 3D interactive tool.
Update released for BGS open-source database software, ETL Helper
09/07/2024
The software tool helps simplify the process of data transfer into and out of databases.
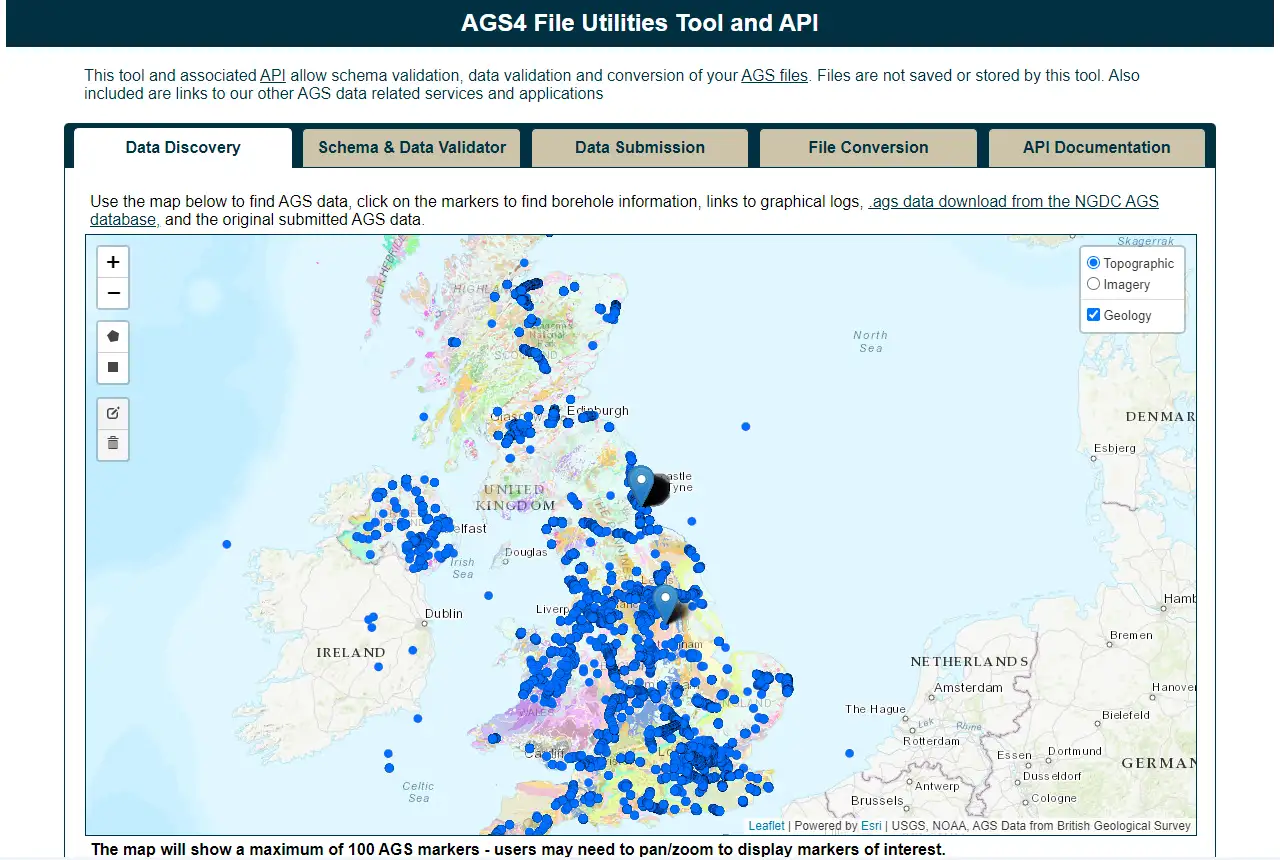
Update to BGS’s AGS file utilities tool released
19/06/2024
BGS has released significant updates to its online tool for validating geotechnical data held as AGS files. The update includes improvements to the tool’s user interface and the ability to convert AGS data into MS Excel files.
New report on the National Land Data Programme published
06/06/2023
The report, based on pilot projects across the UK, explains how spatial data and modelling can support better decisions on land use.
AGS file utilities tool: production release
16/05/2023
BGS’s online tool for validating AGS files against the official AGS data format rules and its own NGDC data submission requirements goes live.
You may also be interested in
Digital lab
Developing, testing and providing new tools and technologies that support delivery of the BGS science strategy enabling world class research across BGS.