BGS’s test site at Aldbrough is located approximately midway on the extensive Holderness coast in the East Riding of Yorkshire [NGR 525770 439605] about 10 km south-east of Hornsea. The approximately 300 m stretch is centred on the road accessing the caravan park (Figure 1). The cliff faces north-east, is low (17 m) and of regular height. It consists of till and is actively receding, by both toppling and rotational mechanisms (Figure 2).
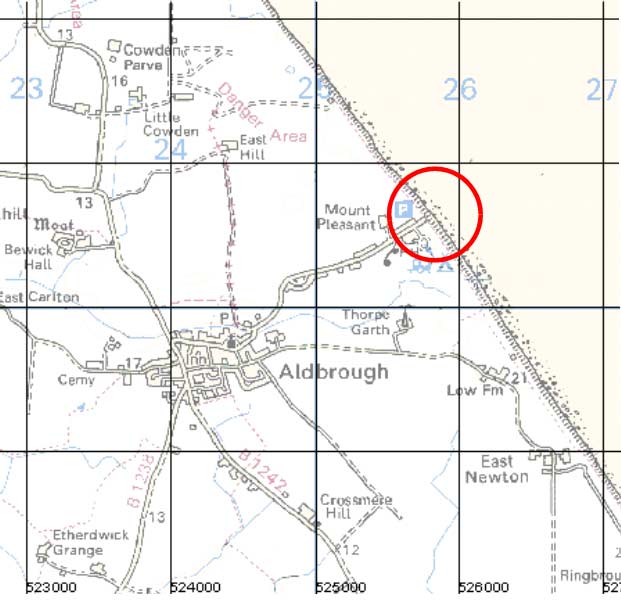

Figure 1: location of test site at Aldbrough, Yorkshire. Contains Ordnance Survey data © Crown Copyright and database rights 2020.
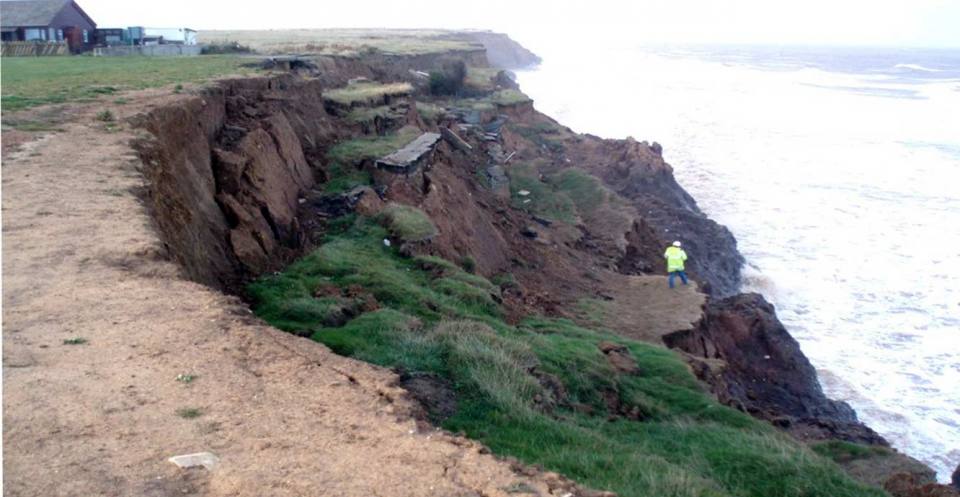
Figure 2: rotational landsliding is the primary mechanism at Aldbrough. BGS © UKRI.
Refer to BGS research report OR/11/063 for a detailed discussion of the Aldbrough project including the geology, geomorphology and geotechnics.
Terrestrial LiDAR surveying at Aldbrough
Terrestrial LiDAR surveys have been carried out at the Aldbrough site since 2001 and are continuing today (47 scans in total), centred on the same section of cliff and platform at a point slightly to the south of Seaside Road. The scans have varied in the area covered and have necessitated clipping to an arbitrarily defined datum in order for digital terrain models, change models and volume calculations to be produced from them (Figures 3 and 4).
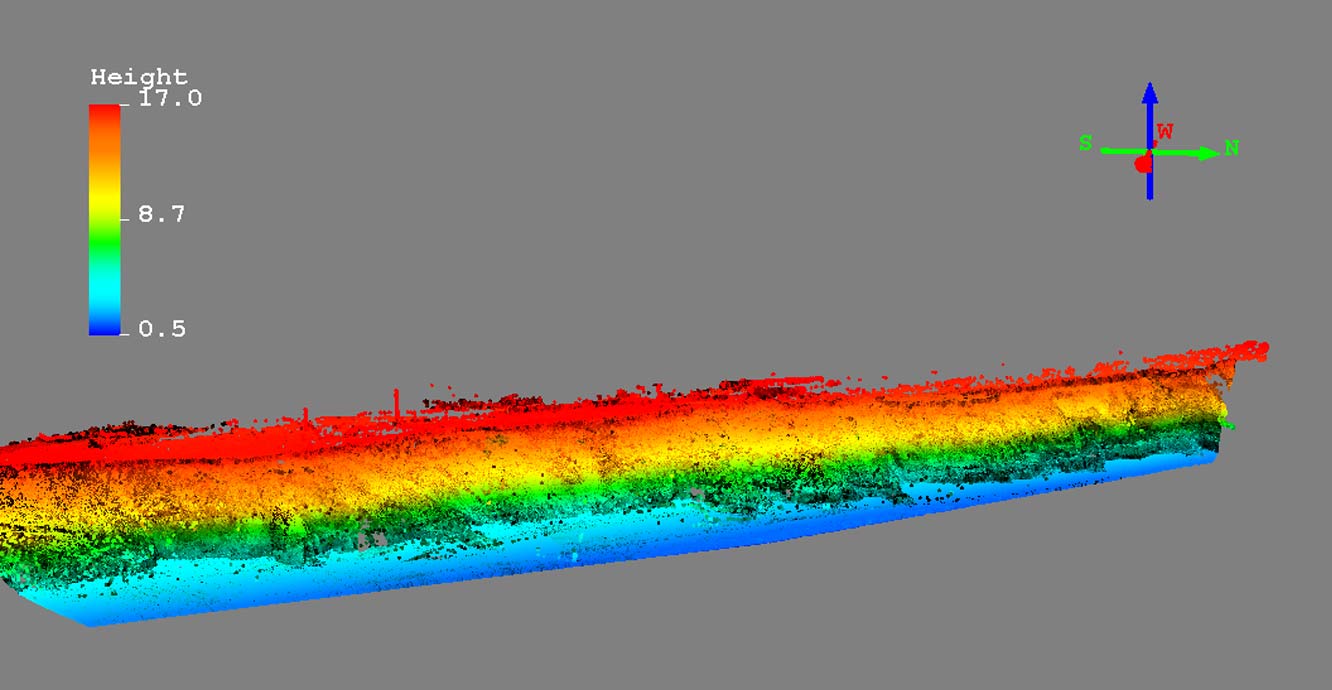
Figure 3: point cloud for July 2010 scaled according to height (0 to 17 m) and clipped to datum. BGS © UKRI.
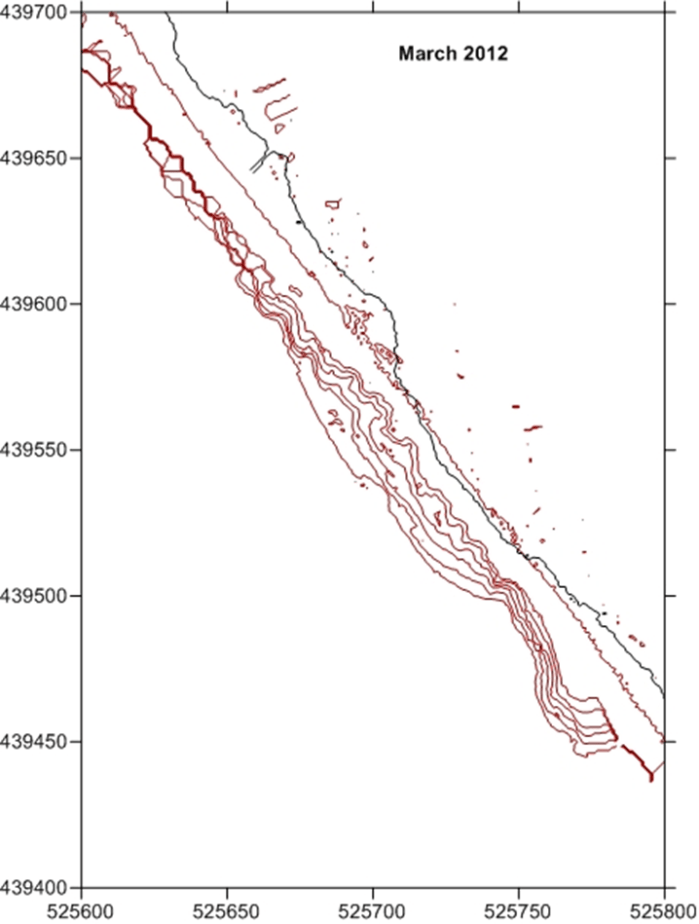
Figure 4: cliff line taken from 2001 (black) and 2012 (red) LiDAR scans. BGS © UKRI.
Positioning of the surveys has relied on the global navigation satellite system (GNSS) throughout. In the early days of the project (2001 to 2002), this was poor in quality and led to inaccurate positioning. From 2002 onwards, the accuracy of the positioning was greatly increased.
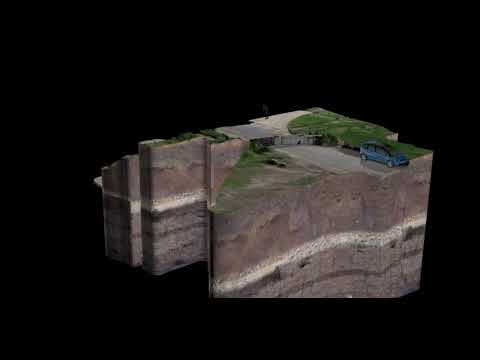

Video 1: 3D model of the Aldbrough rotational landslide. BGS © UKRI.
Equipment
Up to 2004, the scanner used was a Riegl LPM2K, which produced low-density point clouds. From 2005, a higher-speed Riegl LPMi800HA scanner was used to produce denser point clouds and, from 2012 onwards, the VZ-1000 was used. These scanners also feature a calibrated digital camera, the results from which were used to attribute the point clouds with their RGB colour as well as their point intensity.
Survey method
The method developed for the slope dynamics project was to establish ‘baselines’ running parallel to the cliff, both on the platform and on the cliff top (Figure 5). The laser scanner is set up at each end of the baseline and a ‘backsight’ or ‘tiepoint’ reading taken of a target fixed at the other end. This provides horizontal angle data relative to the datum within the scanner. At the same time, both ends of the baseline are located with the GNSS to establish the location of the baseline in national grid coordinates. Multiple scans taken from different locations at the same site are carried out in order to minimise shadow areas (areas invisible to the laser).
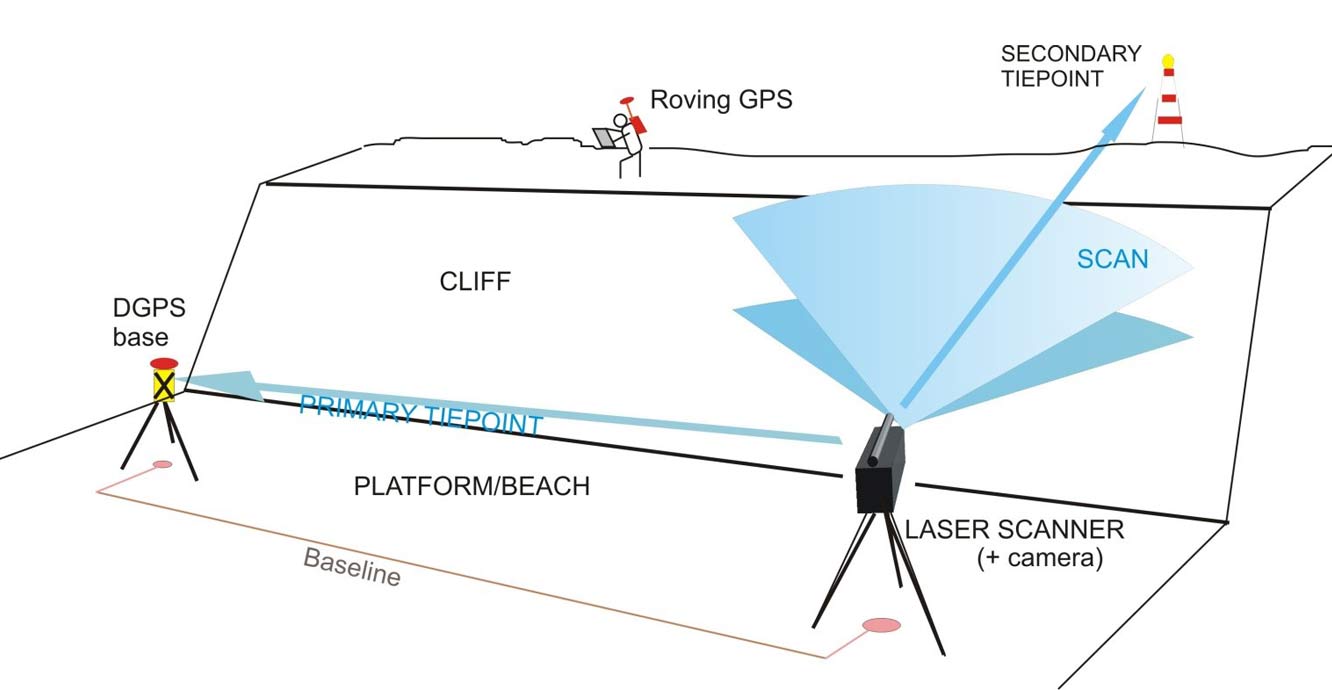
Figure 5: schematic of ‘baseline’ method of laser scanning linear features. BGS © UKRI.
Challenges
Weather and tide conditions meant that not all surveys were carried out to the same standards of coverage and accuracy. For example, it was not always possible to eliminate shadow areas, even by increasing the number of scan locations. This was due to time constraints for work on the platform due to strong onshore winds, adverse weather conditions (heavy rain) or lack of access to the platform, meaning the survey had to be carried out solely from the cliff top.
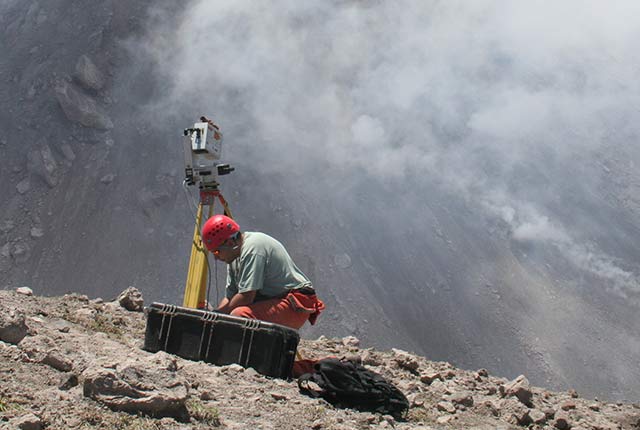
Another problem associated with scanning from the beach was caused by tripod stability issues due to wet sand washing away from the feet of the tripod, causing it to tilt. The vibration caused by the movement of the scanner itself could also cause the wet sand to liquefy. Attempts were made, with limited success, to solve this by using oversized tripod feet but ultimately the scans had to be re-oriented using ImAlign.
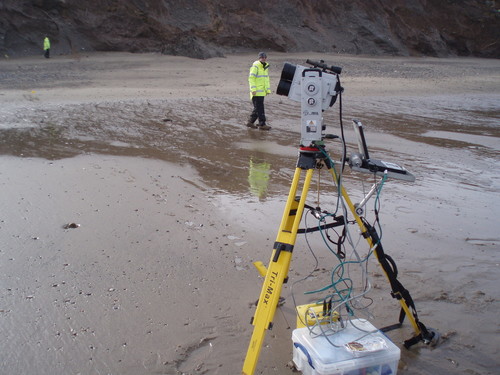
Figure 6: keeping the equipment stable on a wet beach proved to be difficult! BGS © UKRI.
Positional accuracy was of paramount importance for these surveys due to the lack of a fixed scan position. However, satellite drop-out was frequently encountered in the early years of the project. From 2005 onwards, a system using a base station that logged its position over the duration of the survey and sent radio updates to a rover unit was used.
Since 2010, the GNSS has utilised a telephone link to a UK-wide, real-time kinematic (RTK) network allowing live updates to be received by the unit directly, removing the need for a base station. During some surveys the telephone link has intermittently failed, due to the remote location or due to line usage at the time, therefore the base station method has been reverted to.
Improvements
Since 2012, the utilisation of the Riegl VZ-1000, with its improved scan range of 1400 m, accuracy of ±8 mm, measurement rate of 62 000 points/second and high-resolution digital camera, has improved the quality and resolution of the scans, therefore the surfaces created from them have also improved considerably (Figure 7). Added to this is the improvement in the acquisition and pre-processing software (RiSCANPro; Infinity), the post-processing software (I-Site Studio; Cloud Compare) and the visualisation software (QT Modeler; Global Mapper; GeoVisionary) leading to improvements in the ability to visualise change more accurately and at better scales (Figure 8).
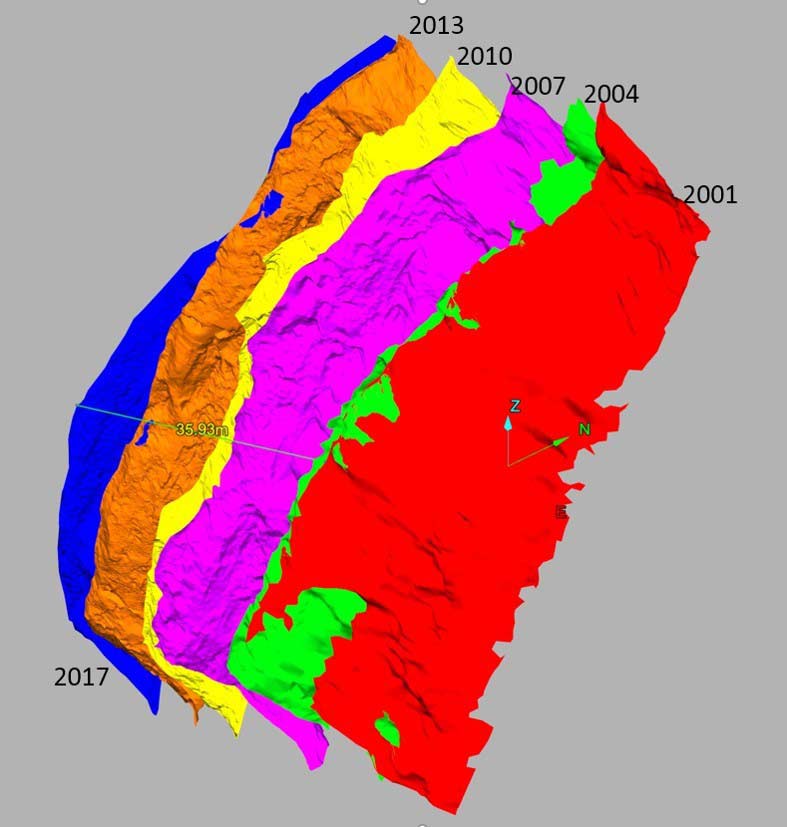
Figure 7: 3D models of the retreating cliff line at Aldbrough, 2001 to 2017. BGS © UKRI.
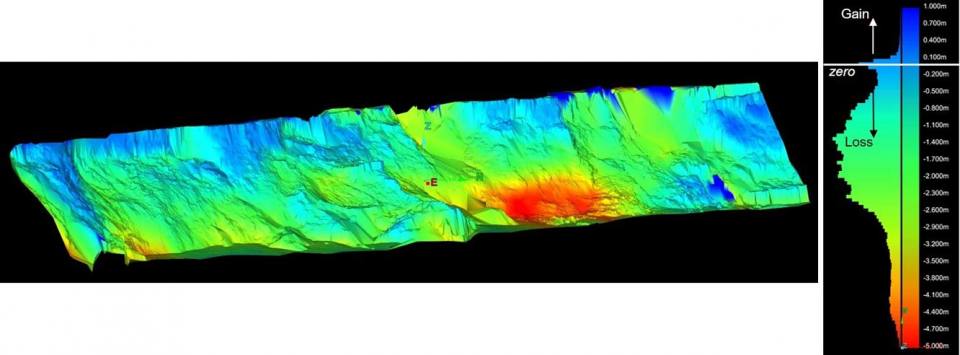
Figure 8: Aldbrough change model, coloured by elevation change. BGS © UKRI.
In 2018, BGS acquired a Leica Pegasus Backpack, a mobile mapping solution with five cameras, two LiDAR profilers and a triple-band GNSS and IMU (Figure 9). It has an accuracy of 20 mm, a measurement rate of 600 000 points/second and can scan as fast as you can walk. This has meant that we have been able to extend the survey area beyond the original 100 m section, taking in the adjacent bays and promontories.
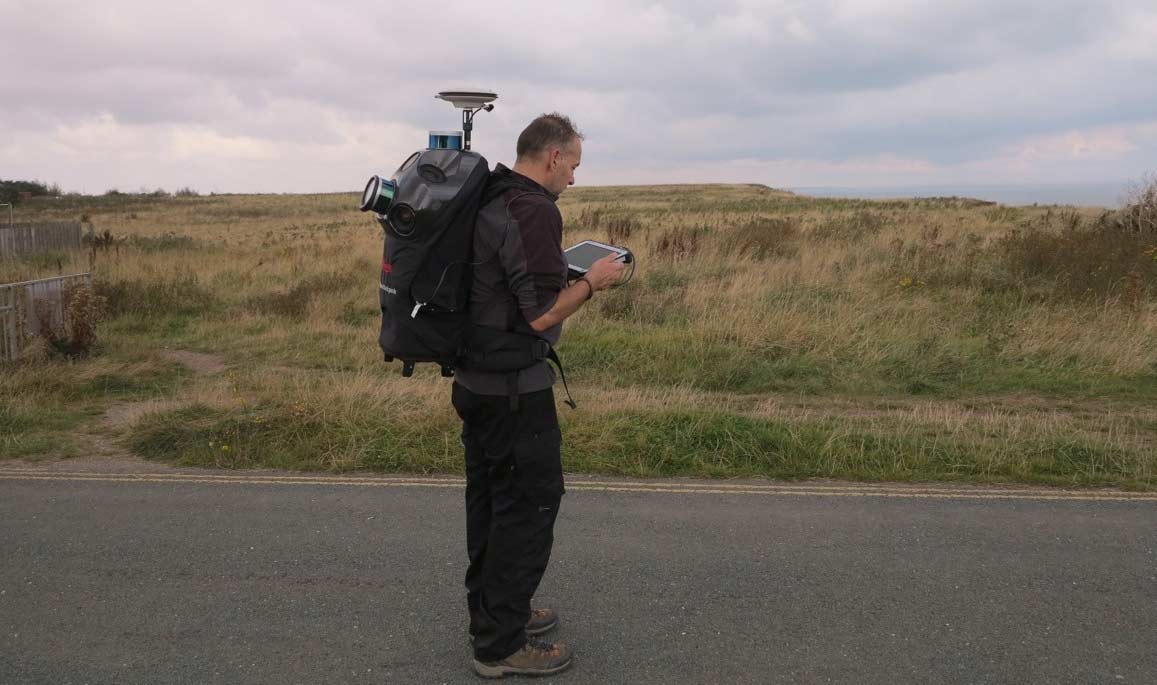
Figure 9: Pegasus backpack in use at Aldbrough. BGS © UKRI.
Contact
If you want to discover more then please contact Lee Jones.
Find out more about our research
Ground-based and near-Earth geomatic surveys
BGS has pioneered the use of ground-based (terrestrial) techniques for a variety of geoscientific applications since 1999.

GSNI project wins multiple awards at RegioStars event
17/10/2025
The AGEO project enjoyed a double success at the RegioStars awards, hosted at the European Commission in Brussels.
AI and Earth observation: BGS visits the European Space Agency
02/07/2025
The newest artificial intelligence for earth science: how ESA and NASA are using AI to understand our planet.
UK’s geomagnetic blind spots tackled with new observatories
28/07/2022
Three new geomagnetic observatories have been installed across the UK to fill in the country’s ‘blind spots’ and tackle the risk posed by space weather.

Using satellite imagery for emergency disaster response
06/07/2021
BGS has a long history of assisting relief efforts by providing satellite maps, data and interpretation to those affected by disasters, helping to identify hazardous areas to avoid.
Spaceborne data: an expanding role in disaster response
23/06/2021
Alessandro Novellino explains the importance of Earth observation to help facilitate successful emergency responses after natural hazard occurrences.
Virtual fieldwork during a global pandemic
03/03/2021
Virtual field reconnaissance can help maintain research momentum during the COVID-19 pandemic.
BGS data supports new tool to track geological changes in abandoned coal mines
20/11/2020
BGS data supports new tool to track geological changes in abandoned coal mines.
Joint project aims to support sustainable development in Kenya
12/10/2020
BGS is part of a joint UK-Kenyan international project that aims to blend data and information with local stakeholder input to explore the sustainable supply of sand and aggregates in Kenya.
Geodesy and Earth observation
Developing and using innovative Earth observation techniques to characterise and monitor Earth processes that affect lives and livelihoods.
Ground-based and near-Earth geomatic surveys
BGS has pioneered the use of ground-based (terrestrial) techniques for a variety of geoscientific applications since 1999.