Spotlight on BGS coastal erosion data
BGS GeoCoast data can support researchers and practitioners facing coastal erosion adaptation challenges along our coastline.
18/07/2024 By BGS Press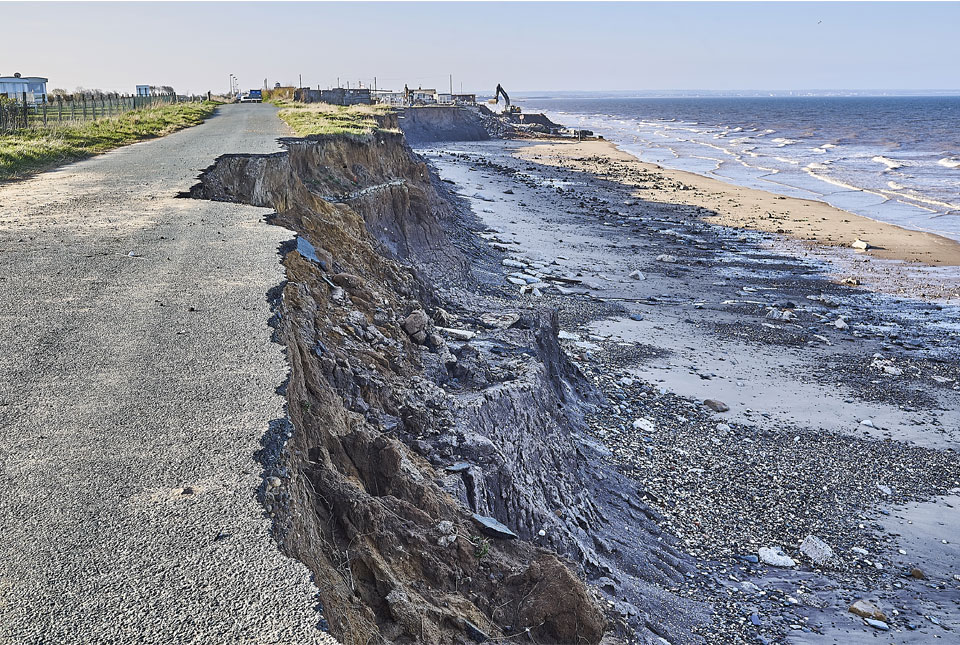

The Flood and Coastal Erosion Risk Management (FCERM) research and development programme’s areas of interest launched at the beginning of May 2024. Following this, we are highlighting the BGS datasets that can support coastal researchers and practitioners facing adaptation challenges at the coast.
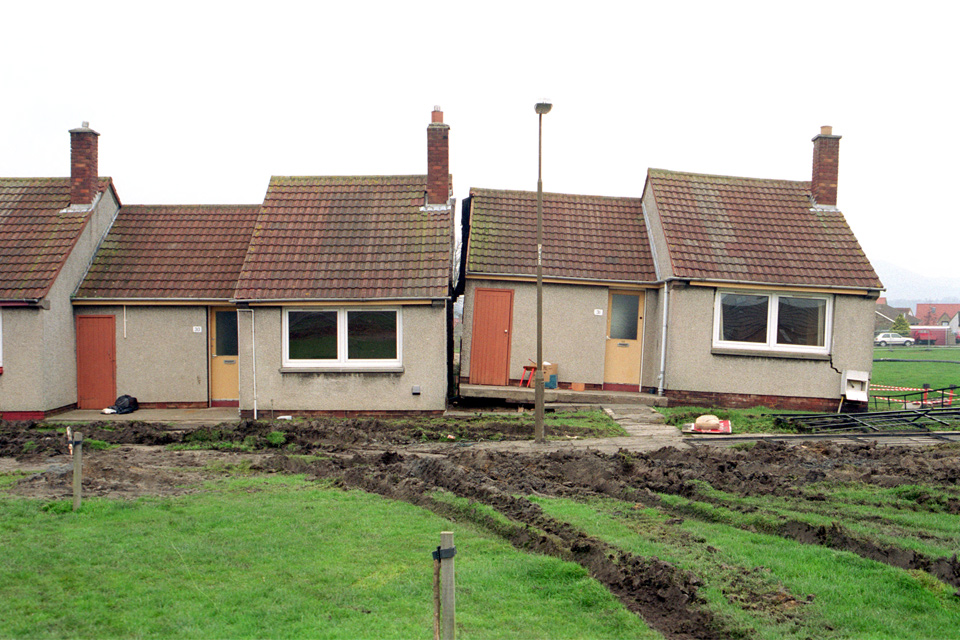
As a result of the complex interaction of natural properties and processes, a range of geohazards converge at the coast and make it a hotspot for financial and societal costs. One such example of these issues is demonstrated by the plight of Fairbourne, a village in west Wales that is at risk of being reclaimed by the sea. The third UK Climate Change Risk Assessment (CCRA3) has highlighted that all four UK nations are poorly adapted to climate-driven changes at the coast and the UK lacks national ‘projections of risk to the viability of coastal communities, either from erosion or catastrophic flooding’.
Existing methodologies for assessing national coastal erosion vulnerability often fail to consider how the localised properties and structures of geological deposits can affect coastal change when combined with coastal processes. For example, the National Coastal Erosion Risk Mapping project (NCERM) for England and Wales states, ‘Details of geologically complex areas known as “complex cliffs” are, in general, not included within the dataset due to the inherent uncertainties associated with predicting the timing and extent of erosion at these locations.’
BGS GeoCoast
BGS GeoCoast aims to plug this data gap by providing a suite of nationally consistent geological properties data that can be used by stakeholders as key components within a coastal modelling environment.
BGS launched GeoCoast in 2022. It is an integrated geographical information system (GIS) package of datasets designed to inform and support coastal management, planning and adaptation around Great Britain. GeoCoast is based on the outputs of numerous research programmes, stakeholder advice and data analytics and provides sufficient data for users to analyse and assess a range of coastal risks.
GeoCoast Premium
GeoCoast Premium is a licenced package that identifies coastal properties at a 50 m scale and consists of three layers:
- erosion susceptibility
- coastal properties
- groundwater flooding zones
Erosion susceptibility
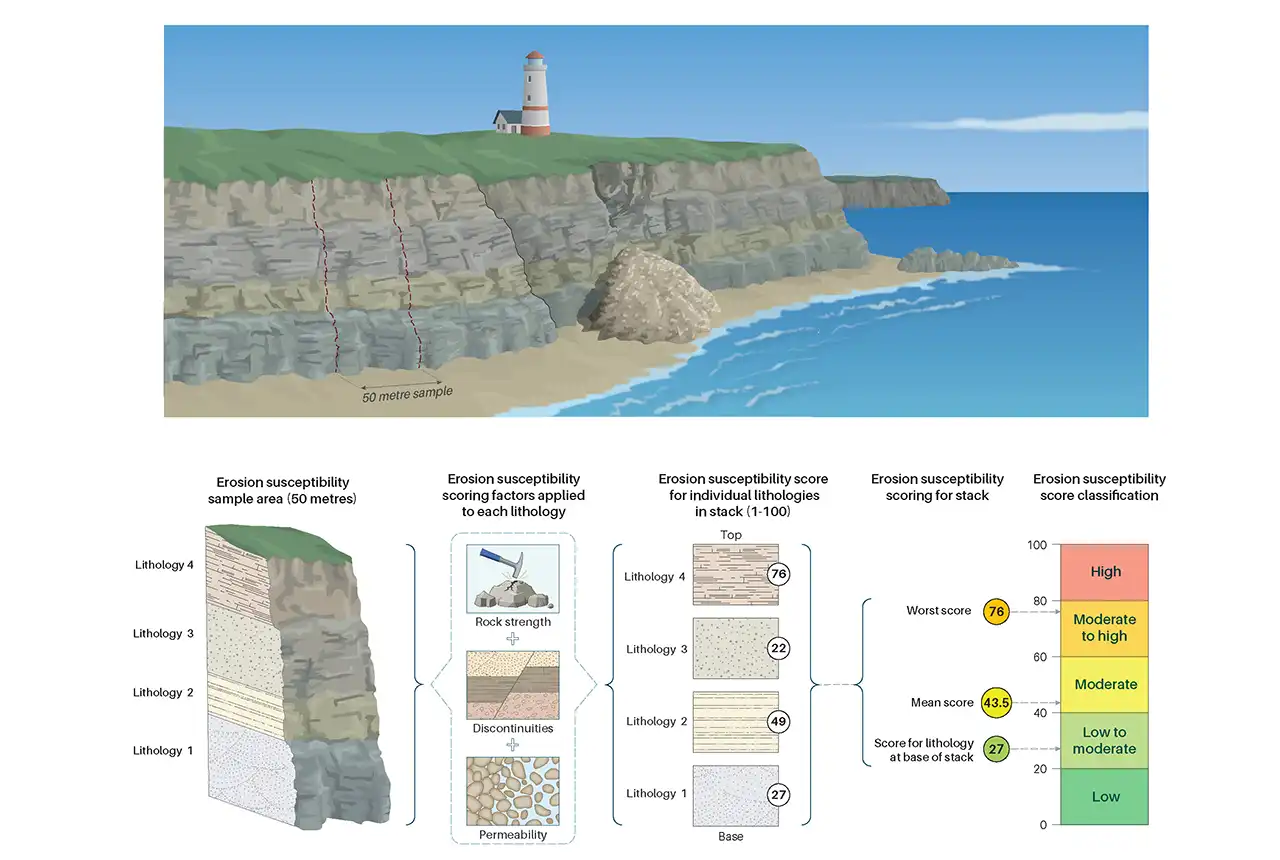
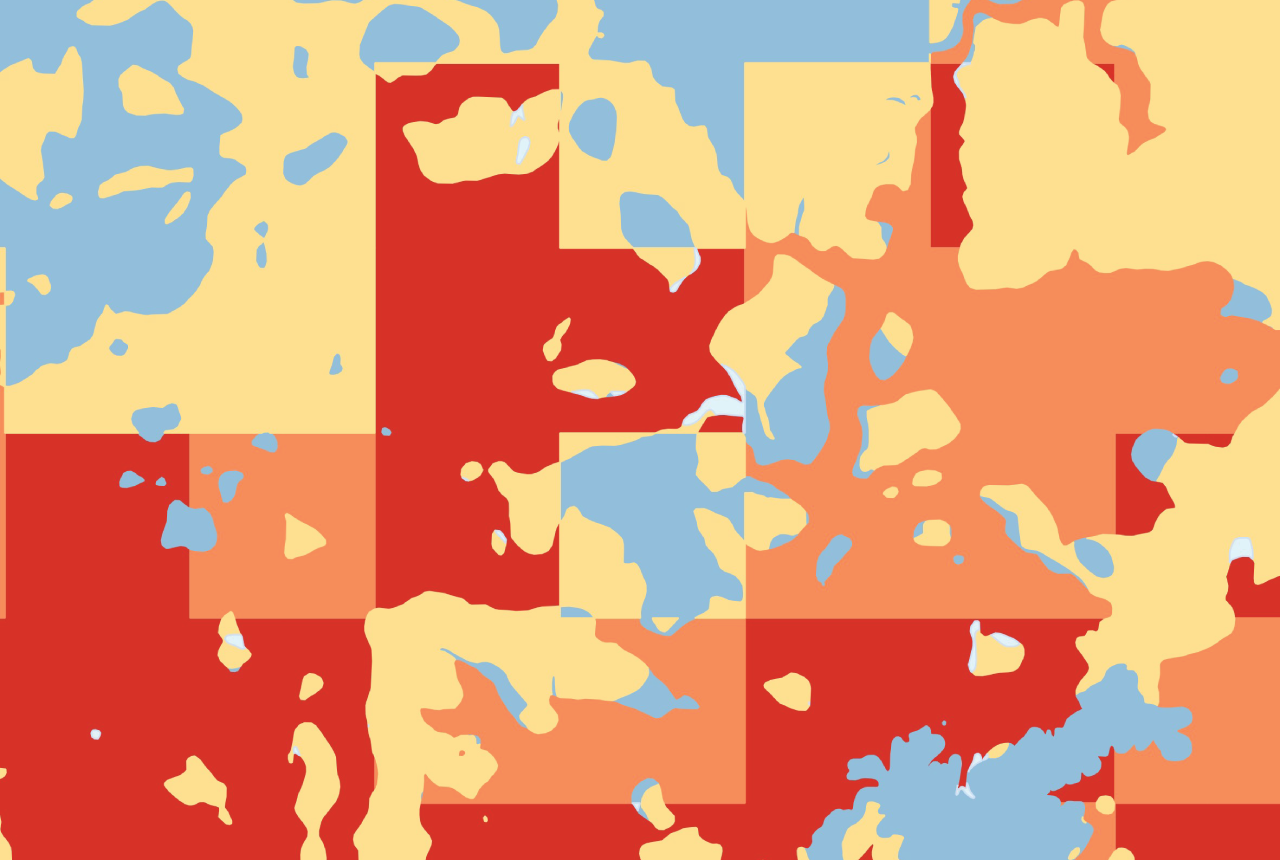
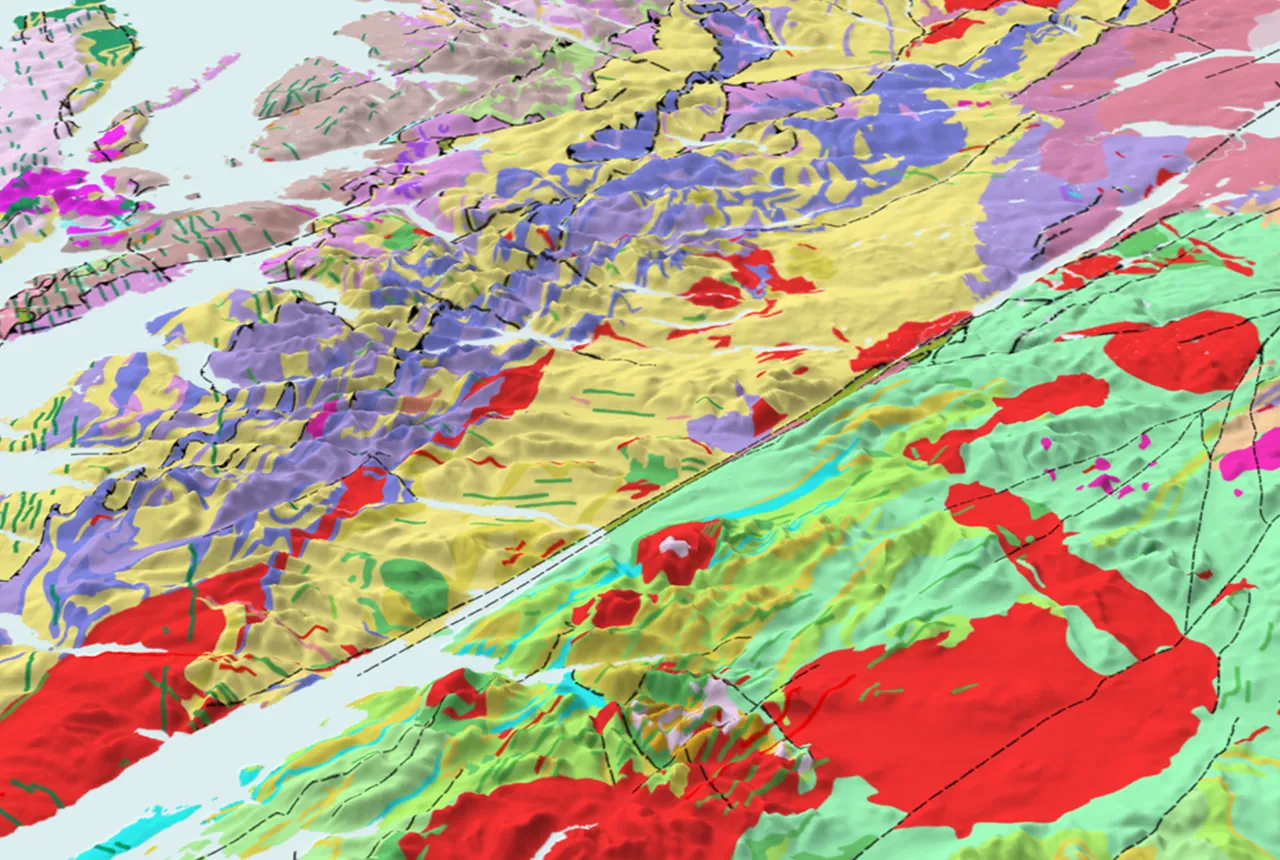
GeoCoast erosion susceptibility. BGS © UKRI.
The first layer provides an erosion susceptibility assessment of the coastal stratigraphy. Our regional geology experts considered the 3D geological ‘stack’ of rock types on the coasts of Great Britain, providing unique insight that is not always available from 2D geology maps.
Each rock type in the stack is scored based on a series of geological properties:
- type of discontinuities
- material strength
- permeability
A total score is calculated per rock type and a worst and mean erosion susceptibility score provided for the entire stack. Scores are also classified from ‘low’ to ‘high’, with special consideration given to the rock type at the bottom of the stack as this is most likely to interact with wave action and tidal processes.
Additional information is provided on:
- cliff profile
- complexity of the geological structure of the stack
- whether there have been any previous landslides mapped at this location
This is repeated every 50 m around the high-water line of mainland Great Britain. Projected rates of erosion calculated by the NCERM project are also provided for England and Wales.
Coastal properties grid
The coastal properties grid provides information on a wider coastal range, covering the foreshore and backshore region. Using the data to consider Fairbourne as an example, the grid provides a condensed version of the erosion susceptibility assessment.
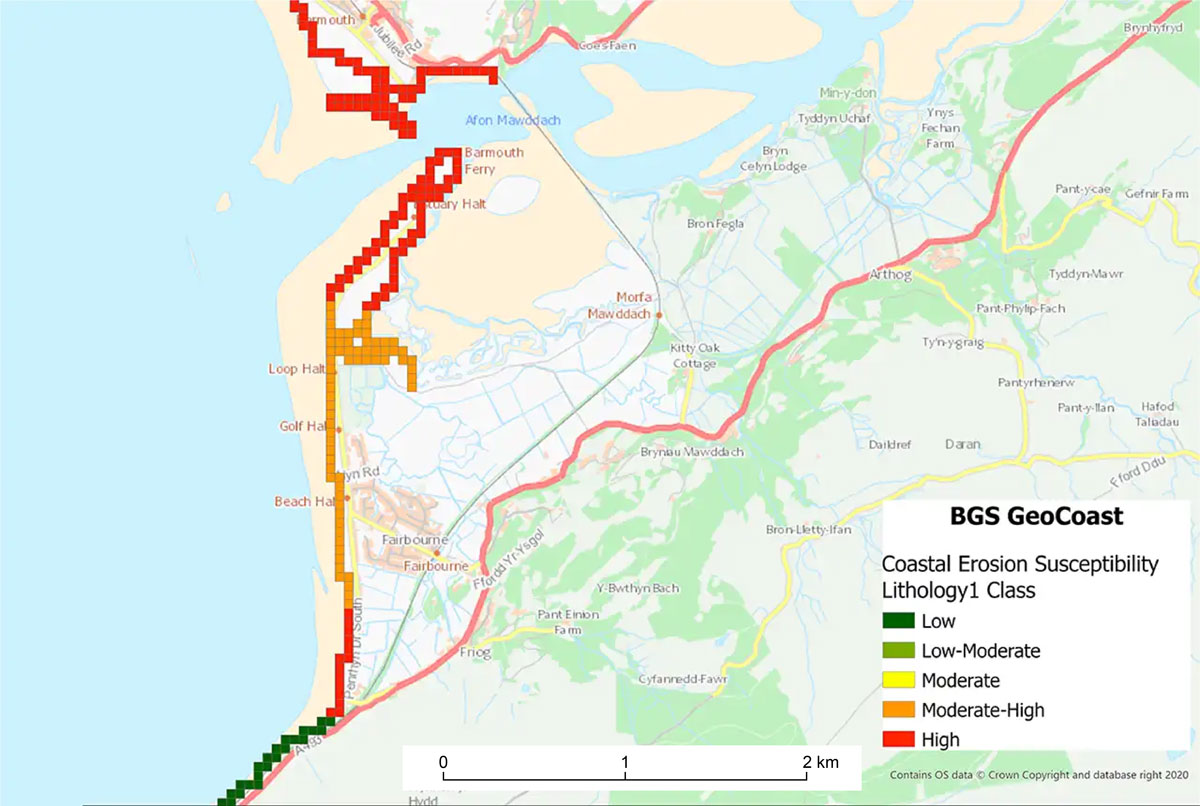
BGS GeoCoast Coastal Properties Grid erosion susceptibility classification for Lithology1, the lithology at the base of the coastal stack, at Fairbourne. BGS © UKRI — contains OS data © Crown Copyright 2024
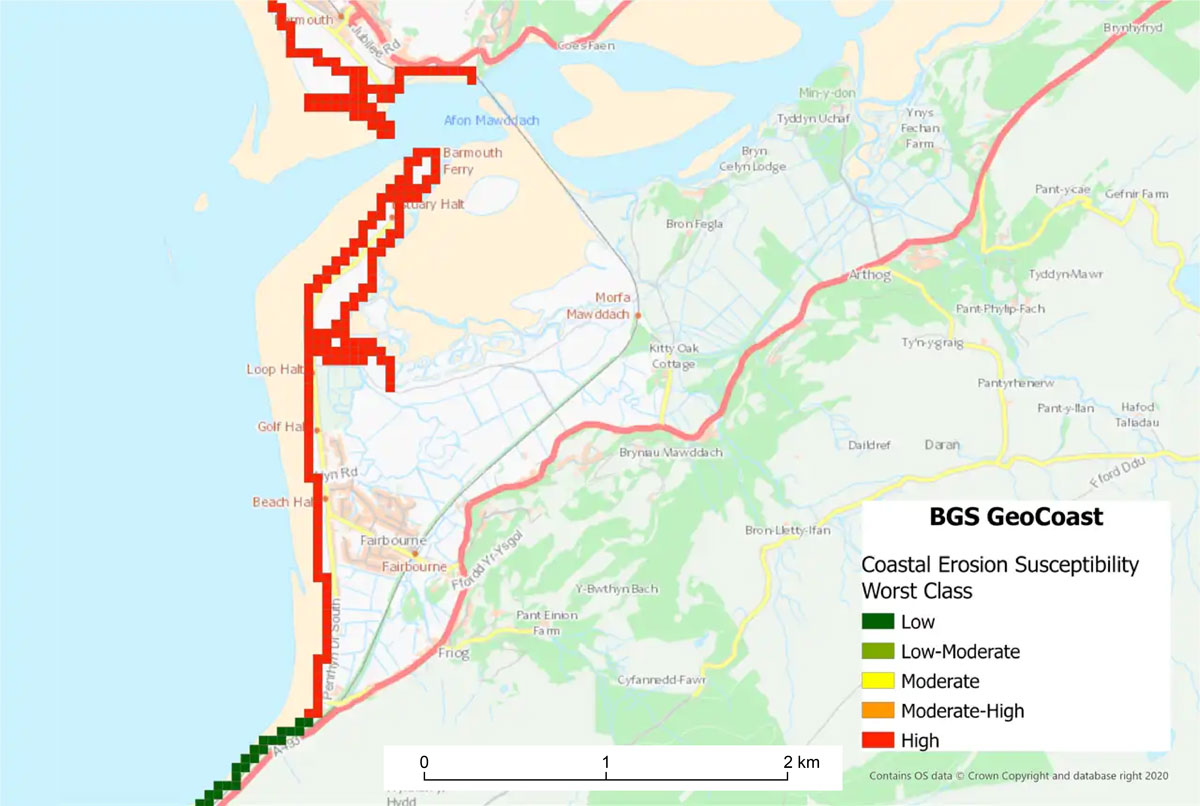
BGS GeoCoast Coastal Properties Grid erosion susceptibility worst classification at Fairbourne. BGS © UKRI — contains OS data © Crown Copyright 2024
Projected coastal inundation extents consider sea level projections from UK Climate Projection (UKCP) 18 under the RCP 4.5 emissions scenario. These projections offer a worst case, undefended view of coastal inundation and therefore do not account for any engineered defences.
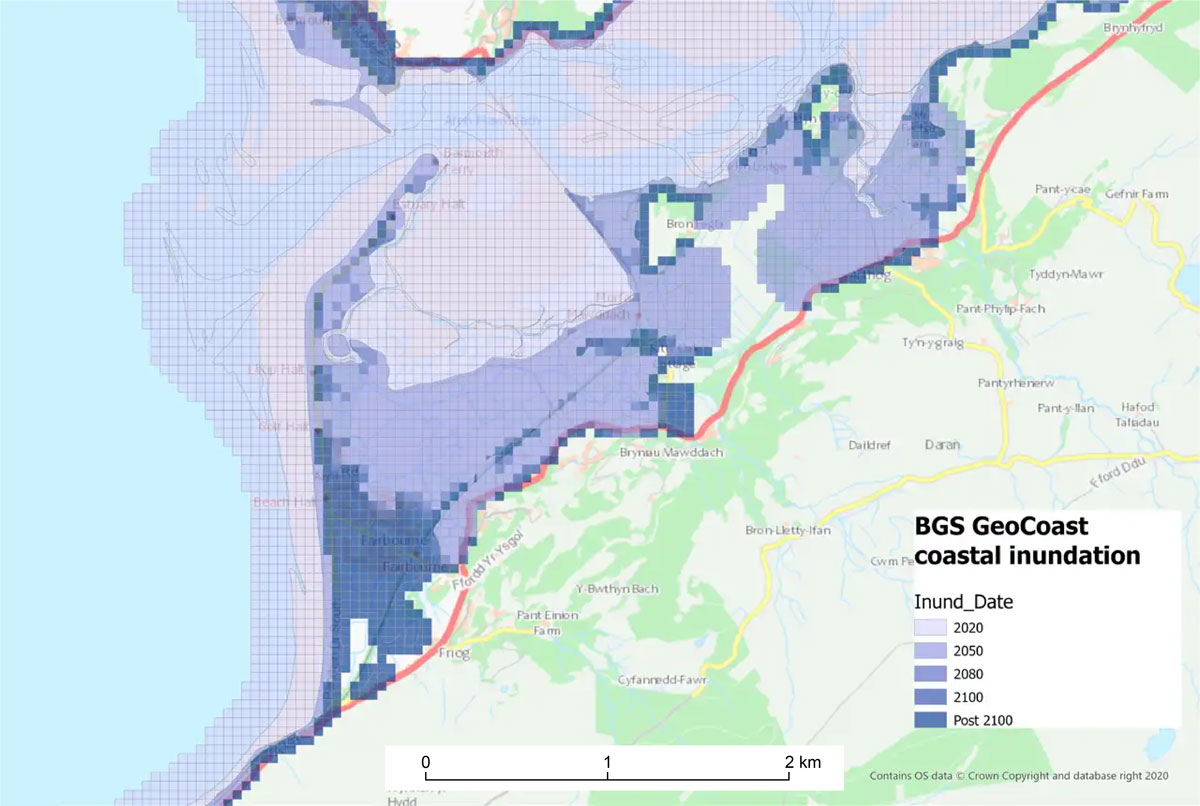
BGS GeoCoast Coastal Properties Grid coastal inundation susceptibility at Fairbourne. BGS © UKRI — contains OS data © Crown Copyright 2024
The susceptibility of the underlying geology and observed ground motion data have been used to calculate subsidence rates for the entire foreshore and backshore area. It is also available as a potential percentage volume reduction.
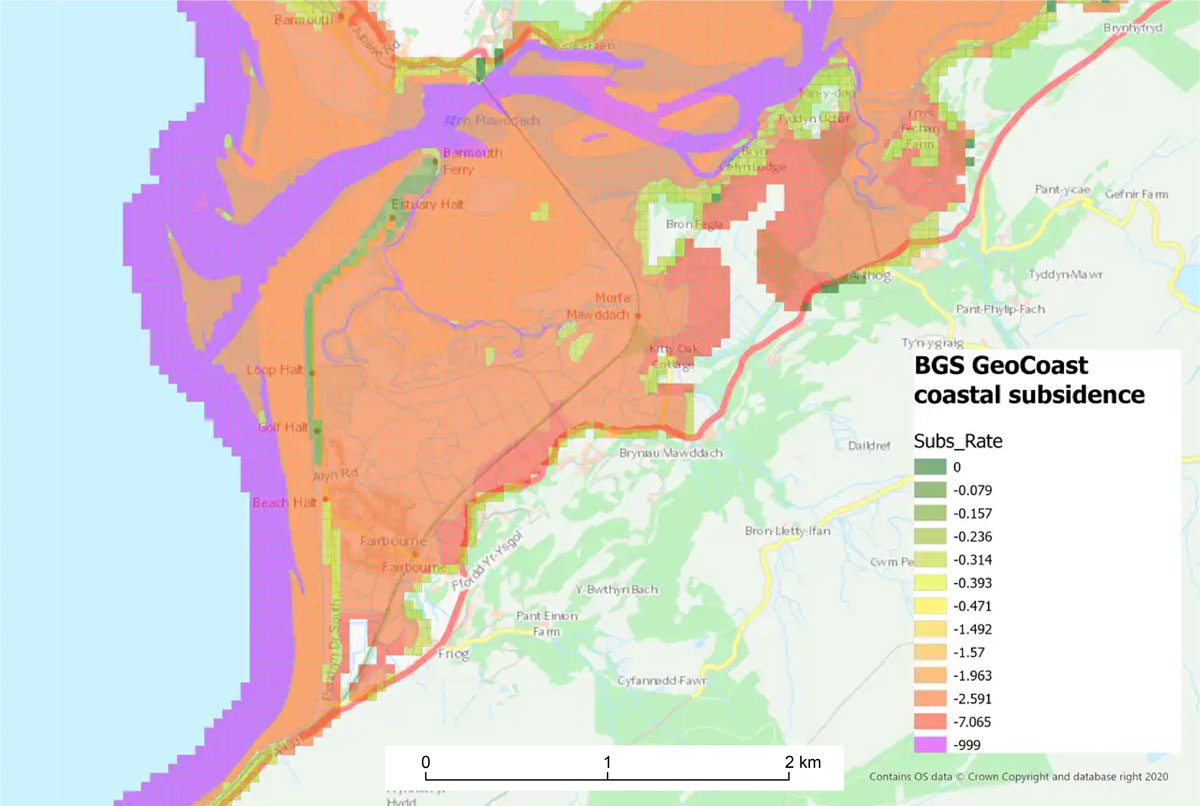
BGS GeoCoast Coastal Properties Grid coastal subsidence susceptibility at Fairbourne. BGS © UKRI — contains OS data © Crown Copyright 2024
The coastal zone has been classified by coastal type.
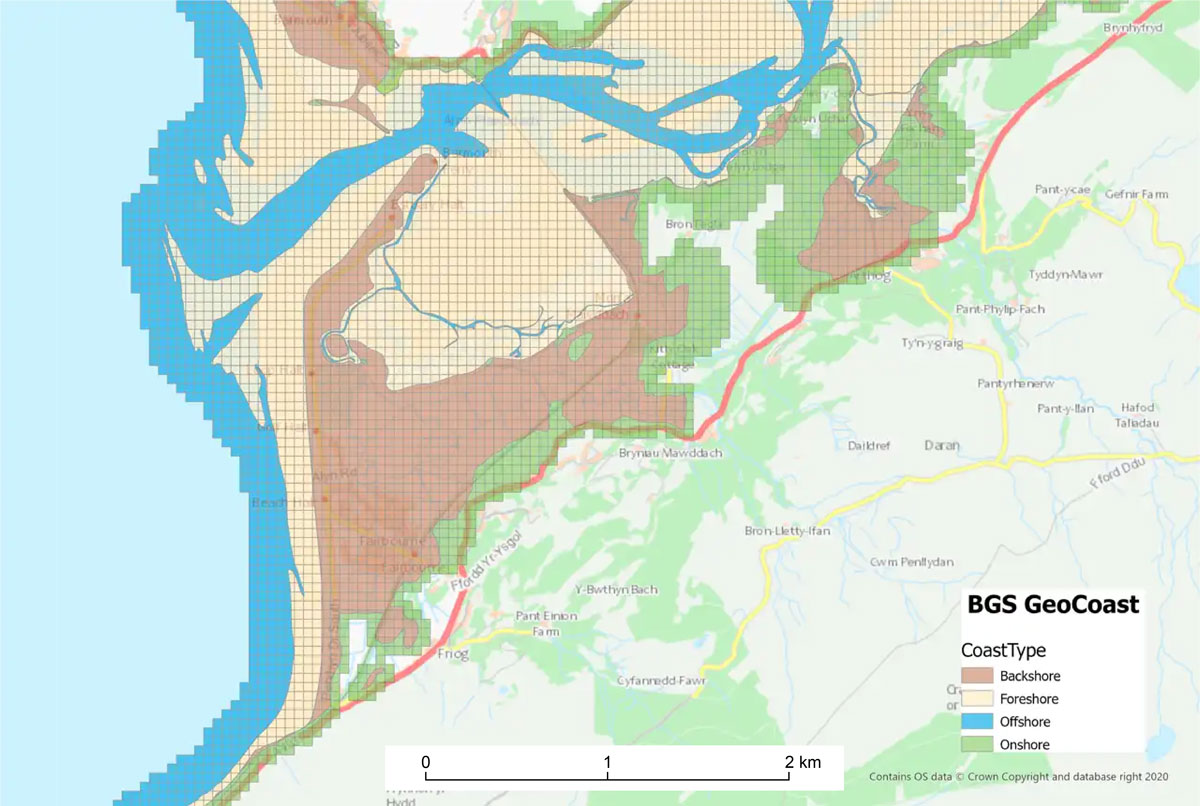
BGS GeoCoast Coastal Properties Grid coastal type at Fairbourne. BGS © UKRI — contains OS data © Crown Copyright 2024
Groundwater flooding zones
The third component of GeoCoast Premium is the groundwater flooding zone. This layer allows for coastal inundation and groundwater flooding to be considered in tandem as groundwater flooding can exacerbate and prolong coastal flood events and have a particular impact on buried assets such as utilities and foundations. In this layer, a current view of coastal inundation susceptibility is considered rather than a projected view.
This data highlights some 133 km2 of coastline classed as ‘high susceptibility to erosion’ with a further 195 km2 in the ‘moderate to high susceptibility’ class. Even if defences are maintained, this is a staggering amount of coastline under threat and there are some 30 000 properties within 25 m of potentially highly susceptible coast. Counties such as Lincolnshire, Hampshire, Norfolk and Lancashire are particularly affected.
GeoCoast Open
GeoCoast Open data is freely available on the BGS GeoIndex and for download. This package provides a range of historic images and diagrams extracted from our archives, memoirs and other publications that can provide a reference for coastal change. It also contains a detailed suite of statistical data based on the GeoCoast Premium datasets. These include, for example, percentage of a shoreline management plan area or local authority coastline at threat from inundation and percentage of coastline with high susceptibility to erosion. In addition, there is a tool to compare or share best practice at a regional scale and streamline the consideration of multiple underlying datasets through a simple, high-level scheme, presented as domains.
A series of interactive case studies are available for seven coastlines of natural importance demonstrating the attribution and application of the datasets. For more information, please visit the BGS GeoCoast web pages or do not hesitate to get in touch (digitaldata@bgs.ac.uk).
Relative topics
Related news
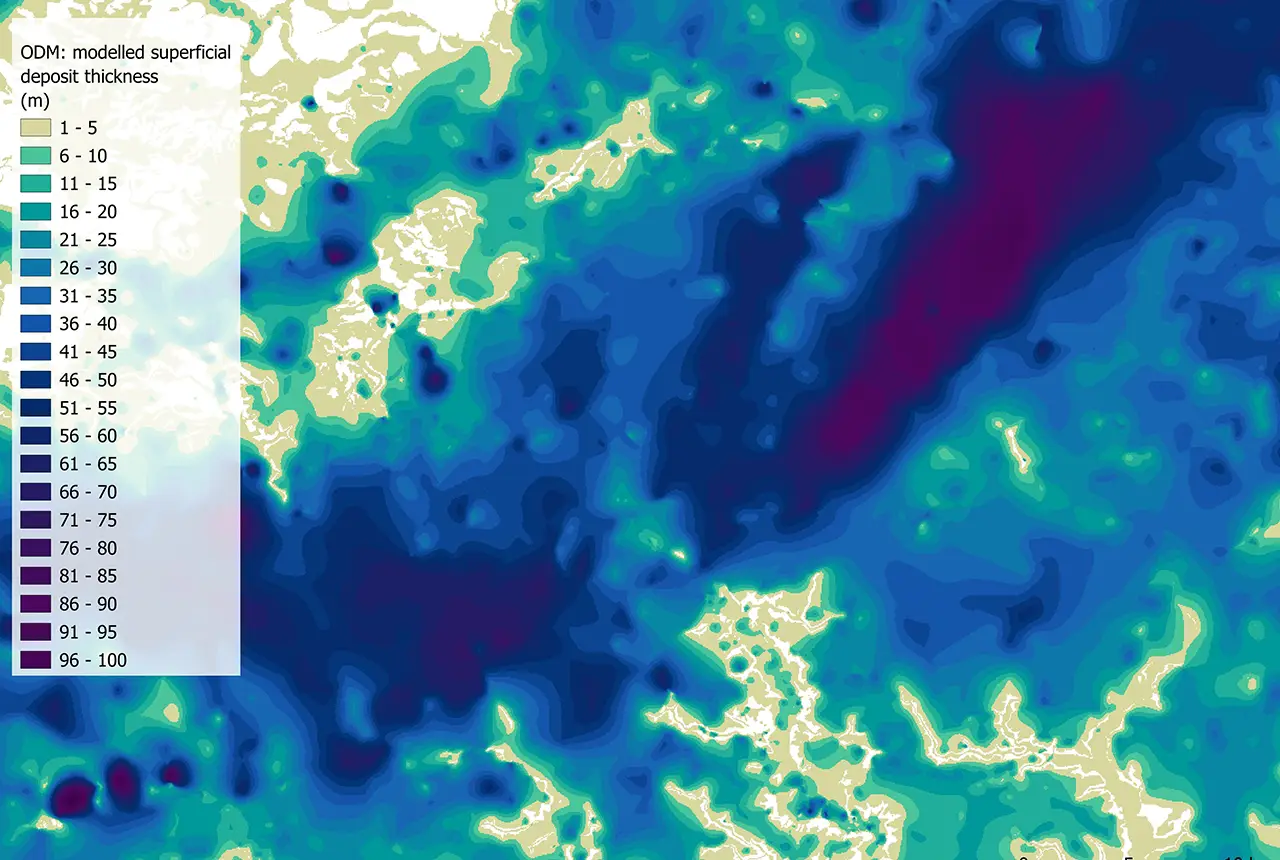
Updated national 3D model will determine the depth to the solid bedrock beneath our feet
13/07/2026
The BGS Superficial Deposit Thickness Model now includes an elevation model of geological rockhead for the first time, providing important data for civil engineers, geoscientists and environmental scientists.
GeoClimate Shrink–Swell
GeoClimate clay shrink-swell provides information on the projected future change in susceptibility of clay shrink–swell across Great Britain due to climate change.

BGS GeoClimate – dataset launch webinar
Event on 02/06/2026
The virtual launch of our new BGS GeoClimate dataset – helping mitigate the economic risk from shrink-swell subsidence. Event recording now available
Is your region susceptible? Britain’s geohazard hotspots revealed
14/08/2025
From sinkholes to radon: new maps highlight the most geologically at-risk regions
New data reveals latest mineral workings around Great Britain and Northern Ireland
01/04/2025
The newest release of BGS BritPits provides information on an additional 6500 surface and underground mineral workings.
BGS Groundwater Flooding Susceptibility: helping mitigate one of the UK’s most costly hazards
25/09/2024
Groundwater flooding accounts for an estimated £530 million in damages per year; geoscientific data can help to minimise its impact.
Spotlight on BGS coastal erosion data
18/07/2024
BGS GeoCoast data can support researchers and practitioners facing coastal erosion adaptation challenges along our coastline.
BGS announces collaboration with Ordnance Survey
29/05/2024
Ordnance Survey and BGS have teamed up to add a range of geological data products to the OS Data Hub, making it easier for users to access and use geospatial data.
BGS data product licence fees to rise
01/03/2024
New direct licence fees to be introduced from 1 April 2024.
Evolving policies in the face of climate change: BGS data can help
25/08/2023
Climate change is increasingly recognised as a major challenge for organisations, with the need for adaptation driving a wave of policy updates and reforms across multiple sectors. BGS data holdings are relevant to many of these changes and the following examples outline how these data packages can be applied.

Six BGS datasets for assessing shrink–swell subsidence hazards
17/02/2023
Shrink–swell subsidence is one of the most significant geological hazards affecting the UK. BGS has six datasets to help assess the problem.
Introducing the BGS Debris Flow Susceptibility Model for Great Britain
21/11/2022
Debris flows are a landslide hazard of particular concern to transport infrastructure managers and local authorities.