Introducing GeoCoast: new coastal datasets from BGS
GeoCoast is an integrated GIS package of datasets designed to inform and support coastal management and adaptation.
20/04/2022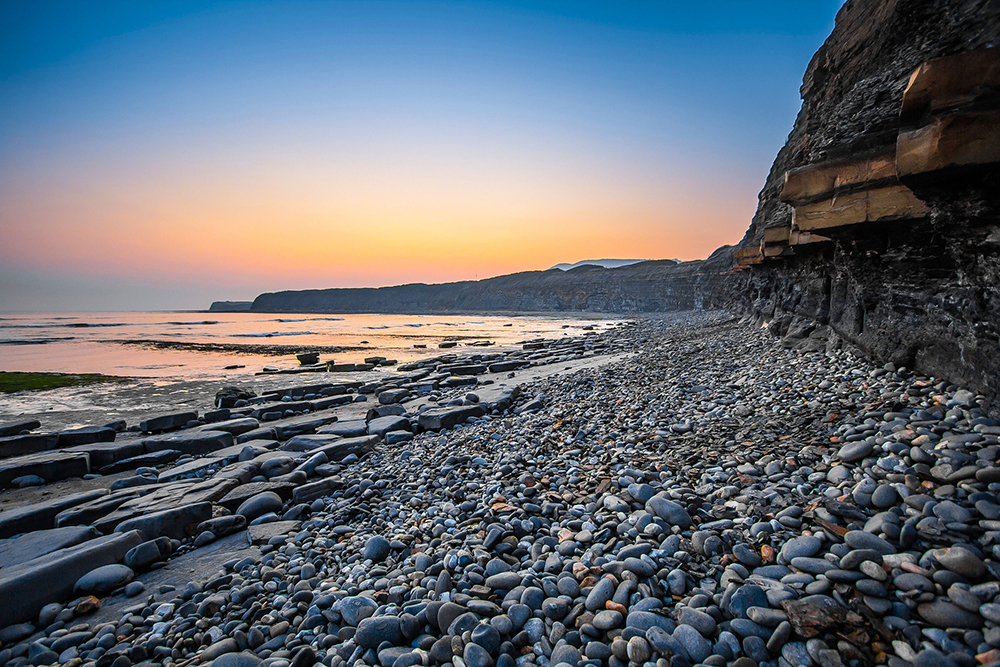

In our previous posts, we shared a broad overview of our coastal regions, with examples of our coastal environments and potential future changes. Here, we dig a little deeper into more specific vulnerabilities and focus on how our new GeoCoast data product can support coastal management and adaptation initiatives. This new dataset has been designed to assist future planning, with resilience considerations based on the natural geological characteristics of the coastal region.
Low-lying areas
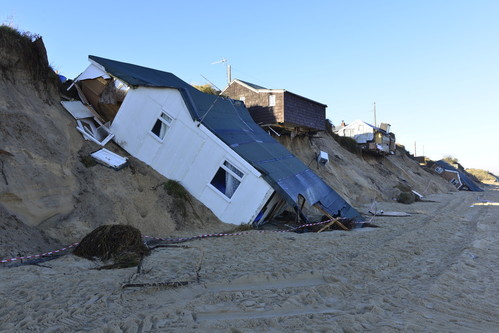
Damage caused by the winter storm surge of 2013, Hemsby, Norfolk. BGS © UKRI.
Low-lying coastal areas are already vulnerable to inundation (flooding by the sea). However, with increasing sea levels and storminess, impacts could be felt over a wider area than we think.
- Many dune sites are already in fragile equilibrium
- Damage to infrastructure, agricultural production and a loss of homes and businesses could be felt
- Groundwater levels at the coast are likely to rise, and the combination of rising groundwater and inundation from the sea, mean that flooding events could become more severe, extensive and prolonged
- Groundwater is also likely to become more saline (salty), causing added pressure on water resources, which in some parts of the UK are already critical (for example, in southern England)
Shoreline defences
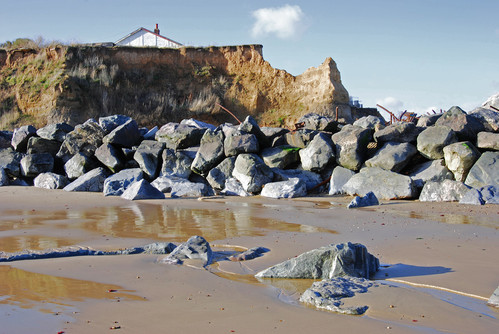
Boulders forming the latest sea defence efforts at Happisburgh, Norfolk. BGS © UKRI.
Shoreline defences and their management are also under threat in many areas. How long can we continue to repair defences or implement new schemes; to what extent can we manage the realignment — or should we let nature take its course and adapt rather than resist? In a 2015 report, the Environment Agency and Defra detailed their long-term costing tool to help understand whole-life costing in flood risk management, including coastal erosion and protection.
There are many factors affecting our coastline and its resilience to these factors has been an ongoing debate for many years. Climate scenarios (UKCP18) predict that sea levels will continue to rise, wave heights will increase and freak storms might become more regular events by 2080 and 2100.
Human influence
Crumbling sea wall at Howick Haven, near Alnwick, Northumberland. BGS © UKRI.
Humans may come and go but the underlying, fundamental natural deposits — the geology — will always remain an important factor to consider. A sea wall might be currently protecting weak sediments, but if that sea wall is breached or no longer maintained, we need to know where and what is vulnerable and how we can adapt the area to be more resilient.
Impacts of climate change
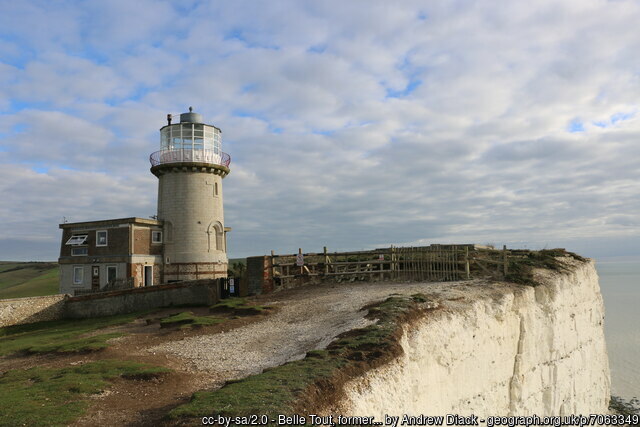
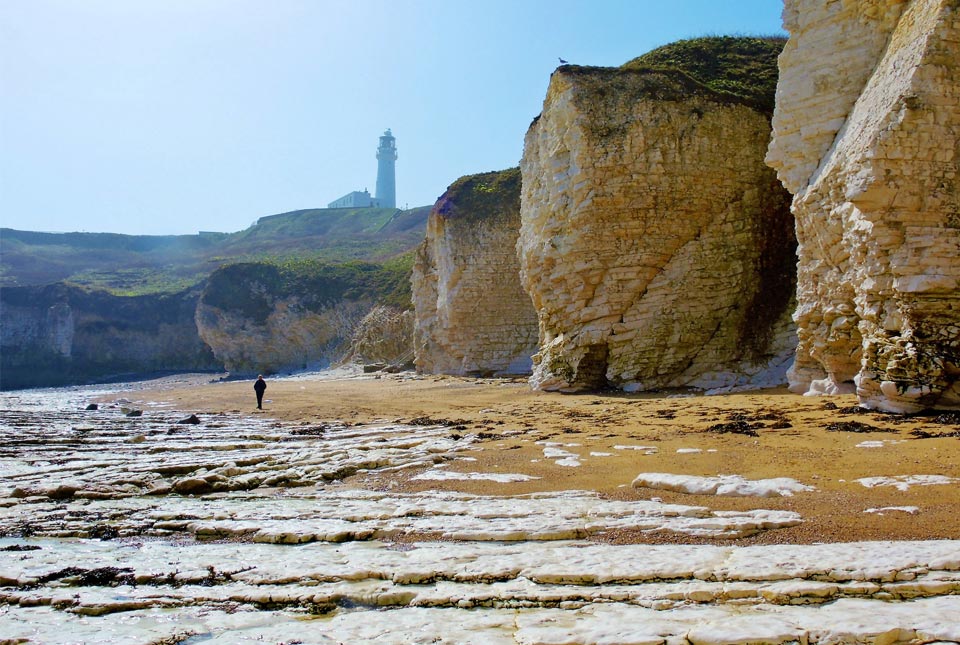
Belle Tout Lighthouse on the edge of the white chalk cliffs of East Sussex.
The effects of climate change have been seen around our coastline: Happisburgh in Norfolk has lost many houses (around 35 homes) over the years and Norfolk has a long history of coastal erosion dating back centuries, for example with the so-called ‘lost villages of Norfolk’ (Eccles; Keswick; Waxham Parva; Newton; Foulness; Ness; Shipden, and Clare). Birling Gap in Sussex has lost its terraces and the Belle Tout Lighthouse, perched above the English Channel, was moved 17 m inland in 1999 to protect it from the failing cliff.
Important structures and assets are strongly protected and have multimillion pound budgets to accommodate this. For example, the Bacton sandscaping scheme in 2019 cost around £22 million, raising the beach level by about 7 m in places, and protects the gas terminal and adjacent village. It is estimated it will only be effective for the next 20 years.
The National Trust has funded several rebuilds of the harbour wall at Mullion Cove, Cornwall, costing over £2 million, as winter storms become more frequent and stronger. The trust has recognised that there may come a point where rebuild is no longer financially possible.
How will the GeoCoast data product help?
GeoCoast is an integrated GIS package of datasets designed to inform and support coastal management and adaptation. Targeted at coastal practitioners, including regulatory bodies, local authorities, asset owners and also home owners who want to be better informed, GeoCoast can be used to underpin coastal decision making and planning relative to coastal inundation, erosion and climate change impacts. The datasets are compatible with shoreline management plan areas.
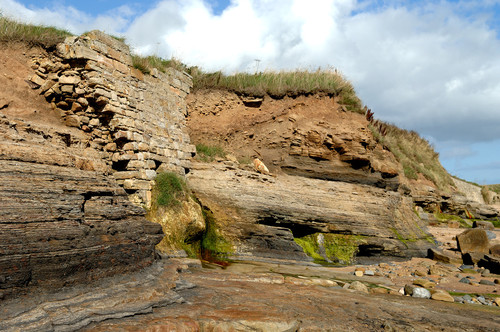
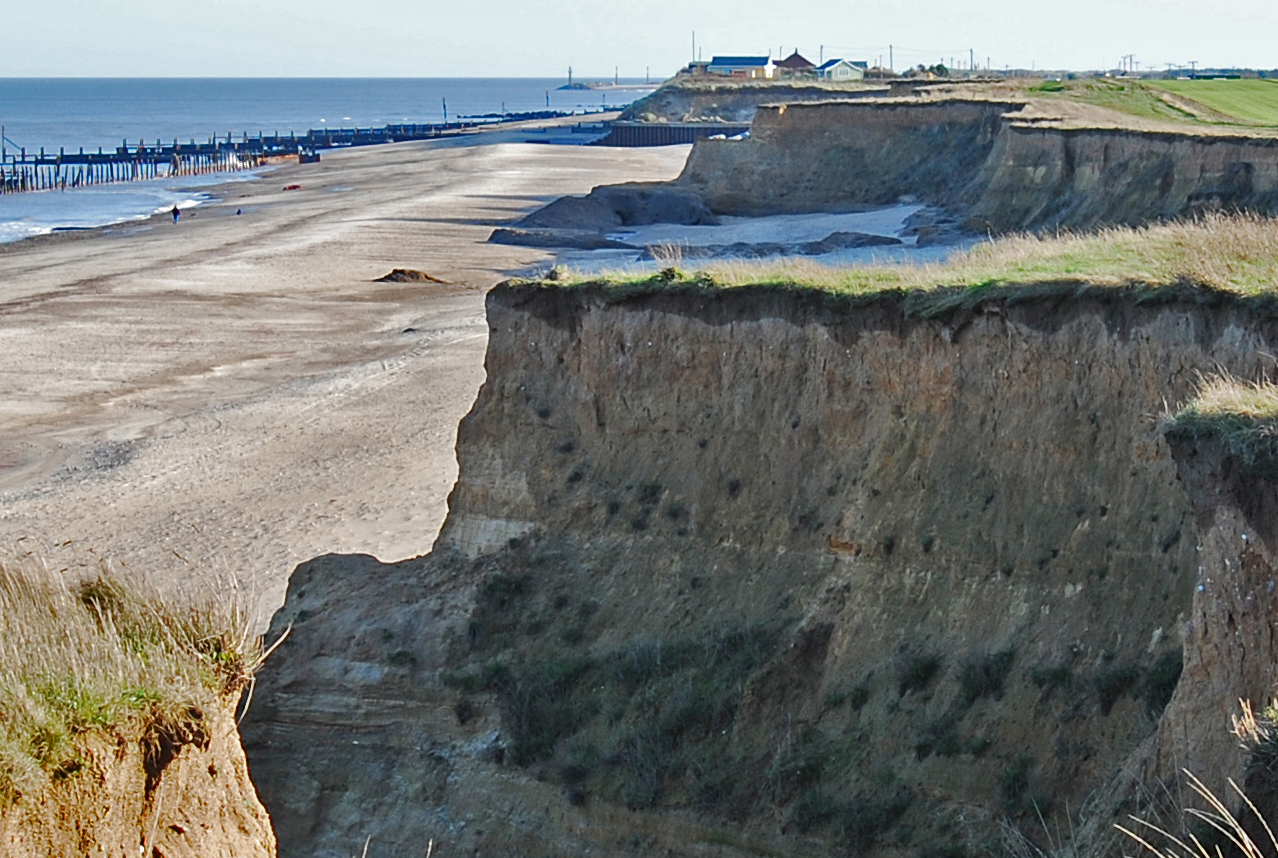
Coastal erosion
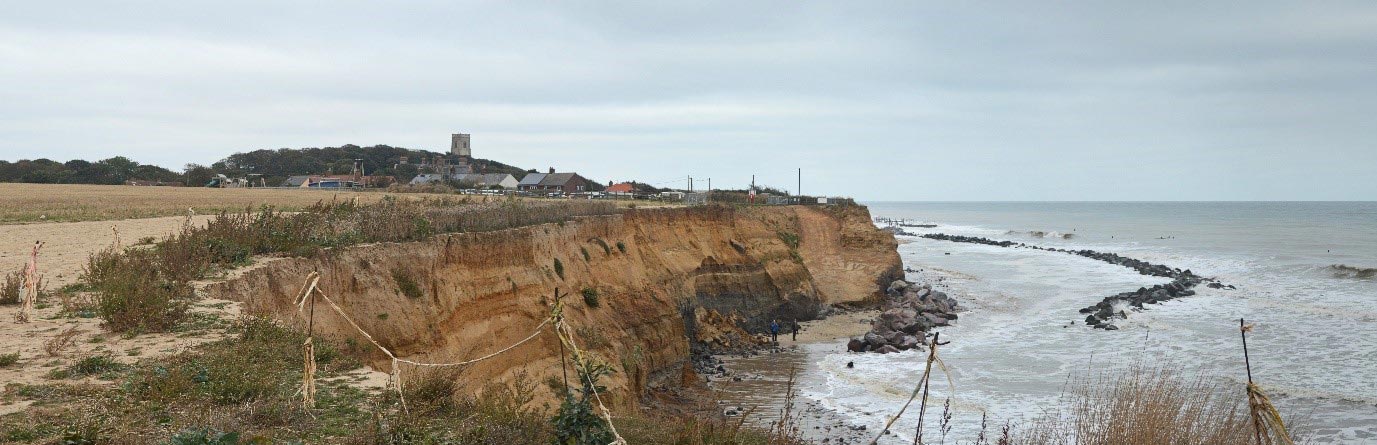
Happisburgh in Norfolk has some of the fastest-eroding coastline in the UK. BGS © UKRI.
Coastal erosion is a real issue and is only set to increase under future climate change scenarios. There are some 133 km2, or 15.5 per , of coastline that are classed as having a high susceptibility to erosion, much of which are located around the east, south-east and north-east coasts. A further 195 km2, or 22 per cent, are classed within the moderate-high category. Some are defended; others are not.
Even if defences are maintained, this is a staggering amount of coastline under threat and there are some 30 000 properties within 25 m of potentially highly susceptible coast. Counties such as Lincolnshire, Hampshire, Norfolk and Lancashire have a high percentage of low-lying, weak, coastal landforms that are at potential risk from increased storminess and wave attack.
GeoCoast includes information on the morphology, behaviour and vulnerability of the coastline, underpinned by its geology and its coastal context (shape; slope; range, etc.) We have carried out a detailed analysis of the coastline sediments and cliff sections, and identified the changes of coastal stratigraphy that are stacked in cliff sections.
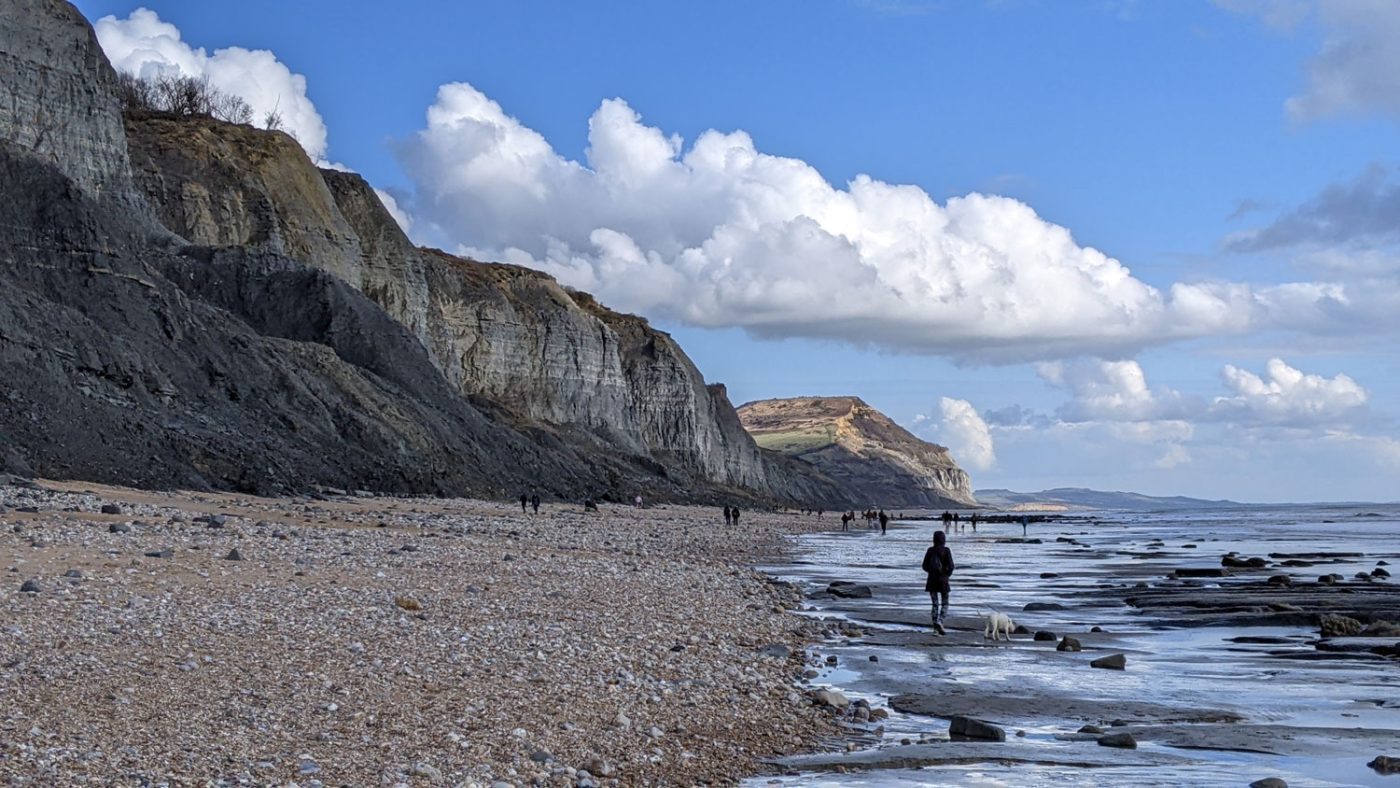
Cliffs of the Jurassic Coast at Charmouth, Dorset. The different properties of the separate rock formations lead to different heights and slope angles in the cliffs. © Jacqueline Hannaford.
Geology maps only identify the uppermost geology, whereas GeoCoast considers the whole sequence from beach level or sea level, to the top of the cliff or coastal deposit. For example, parts of the Jurassic Coast in Dorset have sequences, from beach level to cliff top, of:
- Charmouth Mudstone Formation
- Eype Clay Member
- Downcliff and Thorncombe Sand Members
- Gault Formation
- Upper Greensand Formation
Each of these lithologies has different properties and different levels of resistance to coastal erosion, which, in turn, affect the resilience of the coastline and how it responds.
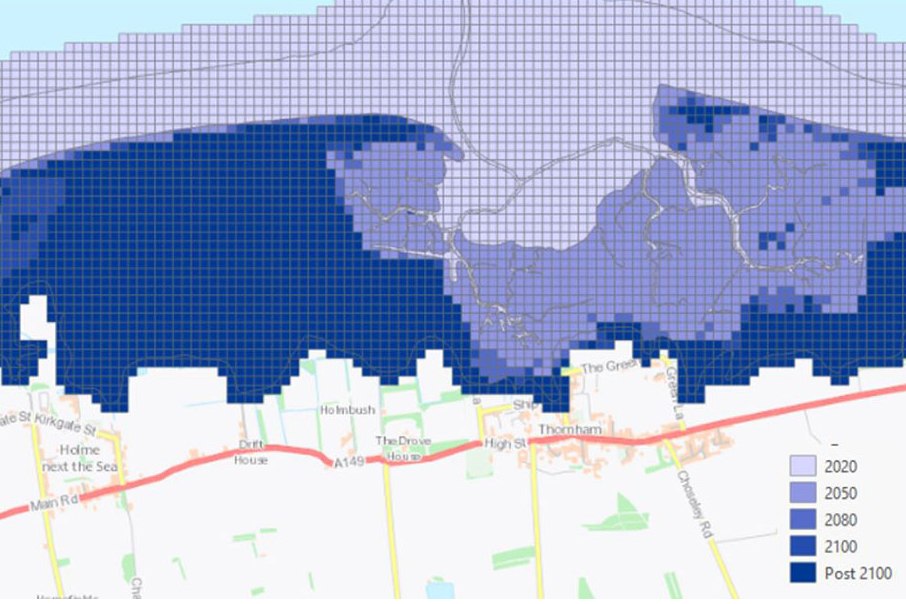
Coastal subsidence
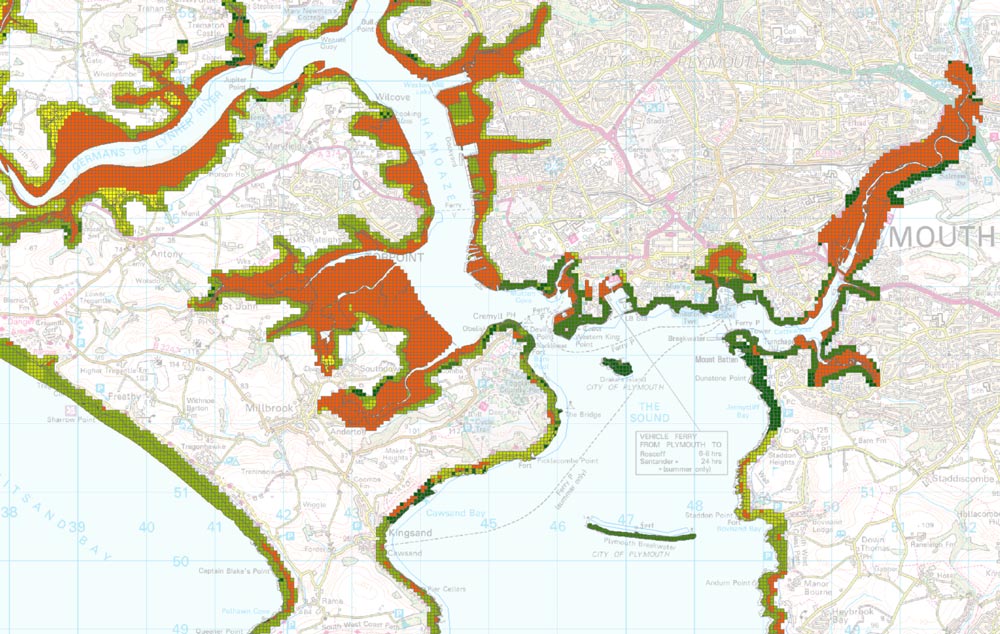
Sample of GeoCoast at Plymouth, Devon. BGS © UKRI — contains OS Data © Crown Copyright 2022.
The potential for coastal zones to undergo subsidence due to natural processes of compaction, dissolution, and shrinkage of geological deposits, has been linked with variations in sea level.
The coastal subsidence analysis combines satellite-measured movement with lithological data to generate levels of potential and measured movement (mm/yr).
Coastal floods
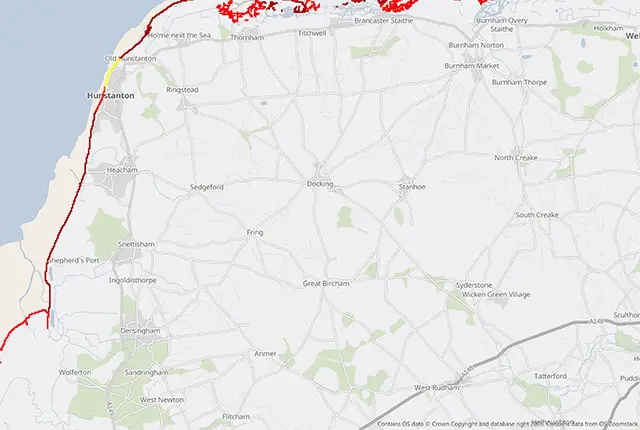
We have carried out extensive characterisation and modelling of the coast of Great Britain, considering many aspects of the coastal zone and its underpinning geology and sediments. Future sea-level rise has been modelled using UKCP18 SLR scenarios (RCP4.5) to provide an estimate of coastal inundation (nationally) of approximately 7258 km2 by the 2050s, 7768 km2in the 2080s and 8145 km2 by 2100.
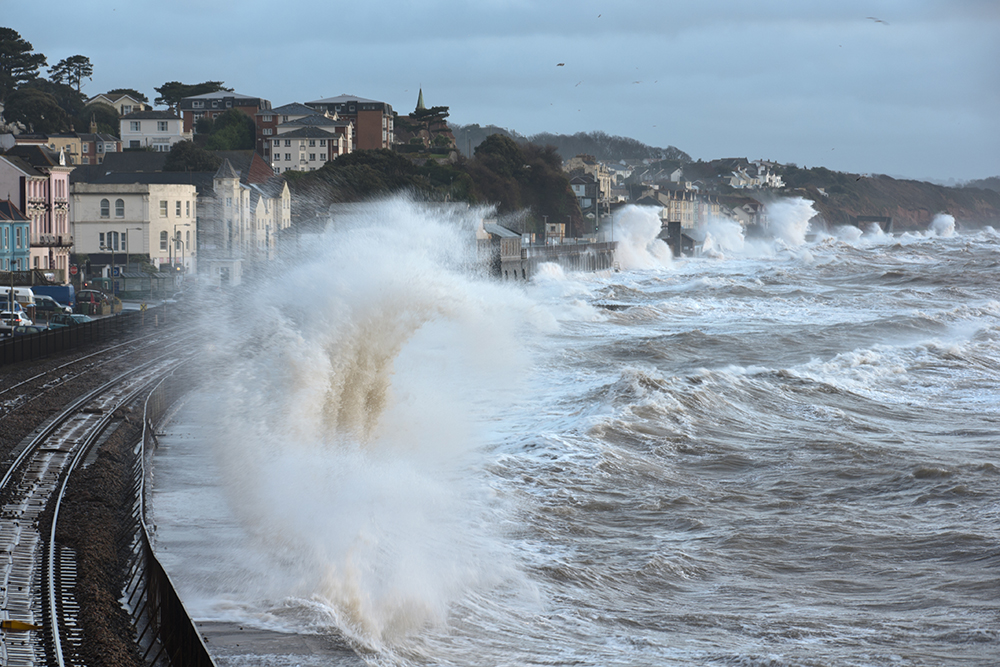
Large waves batter Dawlish, Devon, during a high tide. Photo © Moorefam.
Looking at the worst-case scenario and not taking into account defences, our data also suggests that some one million properties are at potential risk from inundation by 2050, increasing to 1.25 million by the 2080s and 1.35 million by 2100 if no protective measures are implemented.
More examples of the datasets can be viewed in our case studies, available as ESRI Storymaps.
To find out more about our GeoCoast data product, including to arrange sample datasets or licensing, please get in touch with us at digitaldata@bgs.ac.uk.
Read previous entries in this blog series:
- Six changing coastlines and how climate change could affect them
- Sea level rise and coastal erosion: what’s the real impact?
Join us for our GeoCoast launch event
Join our data products team for a live webinar on the 28 April 2022, and discover more about our new data product to underpin coastal decision making, resilience and adaptation. > Register online
About the author

Kathryn Lee
Geologist and BGS Informatics product portfolio manager
Relative topics
You may also be interested in
New BGS datasets for coastal management, planning and adaptation in the face of climate change
BGS GeoCoast is a package of geospatial datasets designed to provide information on the geological conditions and constraints around the coastline of Britain.
GeoCoast Premium
GeoCoast is an integrated GIS package of datasets designed to inform and support coastal management and adaptation.
GeoCoast Open
GeoCoast Open provides a range of historic images and diagrams extracted from our archives, memoirs and other publications, which can provide a reference for coastal change.
Coasts and estuaries geohazards
Providing independent and expert geoscientific tools and advice to assess different adaptation options to coastal flooding and erosion.
Related news
New NERC-funded project empowers young people to engage with environmental science
23/07/2026
BGS is part of a new, collaborative project, funded through NERC’s ‘Opening up the environment’ programme, helping the environmental research community become more accessible.
Delving deep into mountains for future water security
16/07/2026
A BGS-led project is using new water-tracing investigation methods, geophysics and modelling to understand how water moves from mountains to the lowlands, helping to improve water security for billions of people.
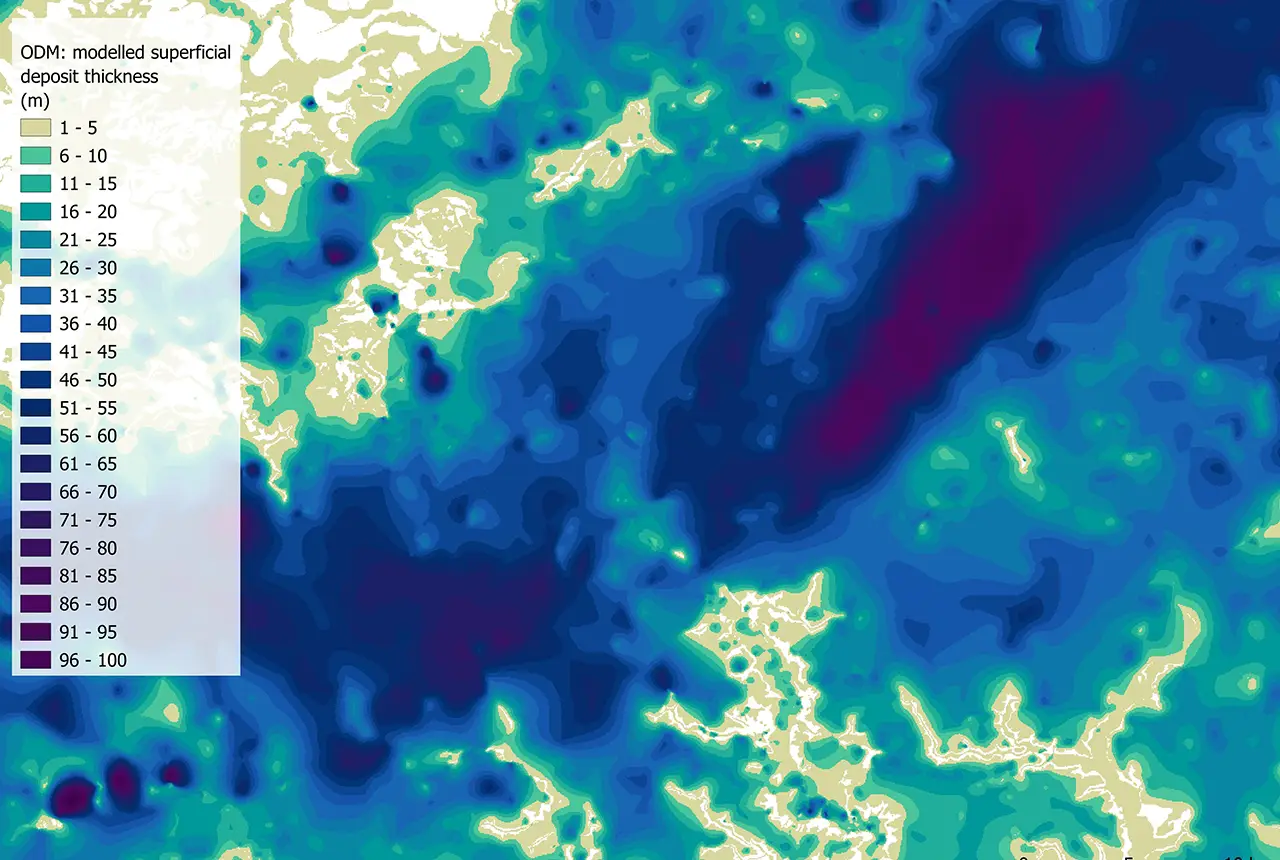
Updated national 3D model will determine the depth to the solid bedrock beneath our feet
13/07/2026
The BGS Superficial Deposit Thickness Model now includes an elevation model of geological rockhead for the first time, providing important data for civil engineers, geoscientists and environmental scientists.

UK’s world-class research organisations launch new collective
10/07/2026
The launch of the National Research Organisations Group brings together more than 100 science leaders to provide an authorativive voice on science, research policy and long-term investment.
Cheshire Geoenergy Observatory releases key geological datasets for UK thermal energy storage scheme design
09/07/2026
A new report and data packs from BGS will provide a unique resource for scientists working on the geology and hydrogeology of the Sherwood Sandstone Formation, an important aquifer and reservoir rock.
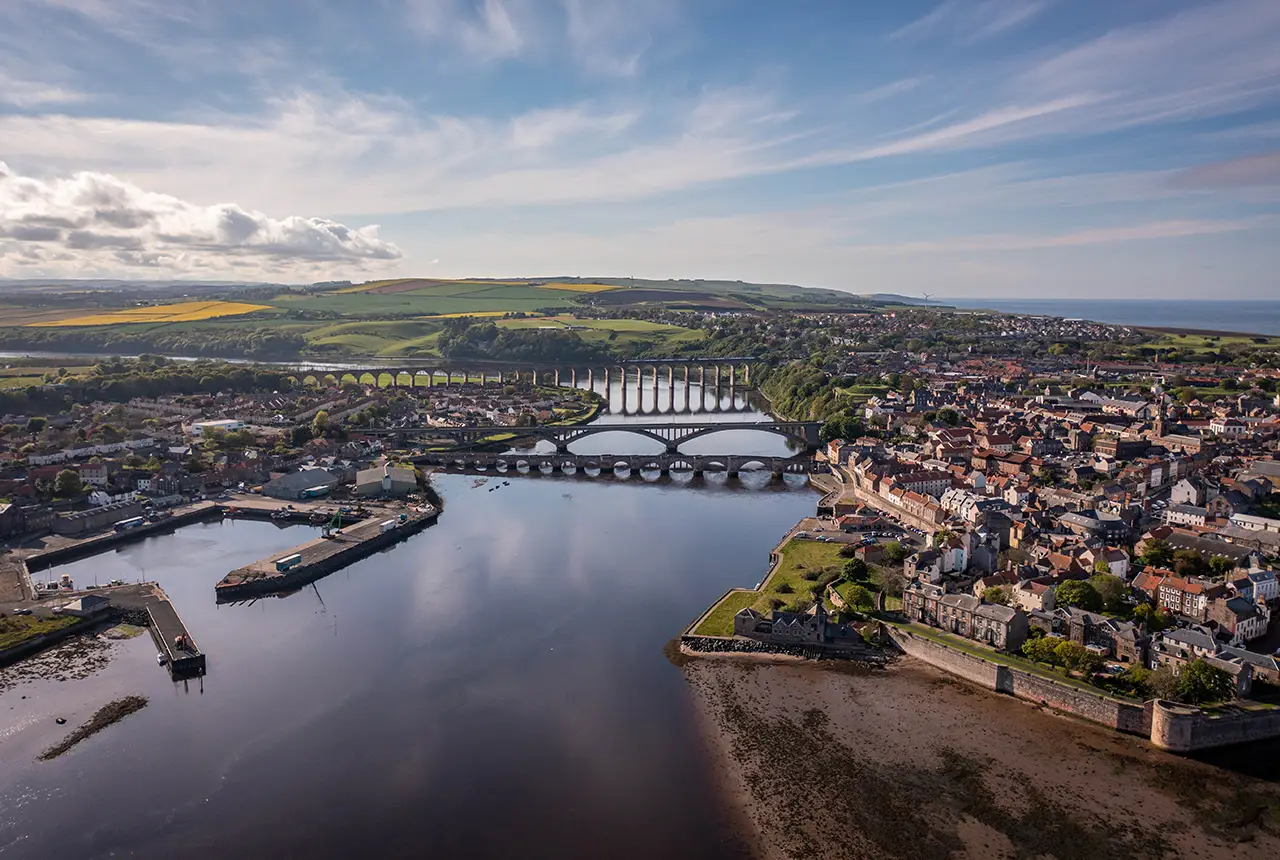
New geological mapping underway to help manage flooding along the River Tweed
08/07/2026
Scientists are surveying the Tweed catchment for the first time in over 100 years to enhance understanding of localised groundwater and improve flood forecasting.

Geological research in North Sea helping to safeguard subsea cables
06/07/2026
Subsea power and telecommunications cables are critical to the UK’s energy infrastructure and global connectivity, yet they remain vulnerable to damage from ship anchors, fishing activity and natural hazards.

UK Critical Minerals Intelligence Centre makes recommendations for the next UK criticality assessment
01/07/2026
CMIC has outlined the enhancements made to the next assessment update to ensure it is better tailored to the structure of the UK economy.
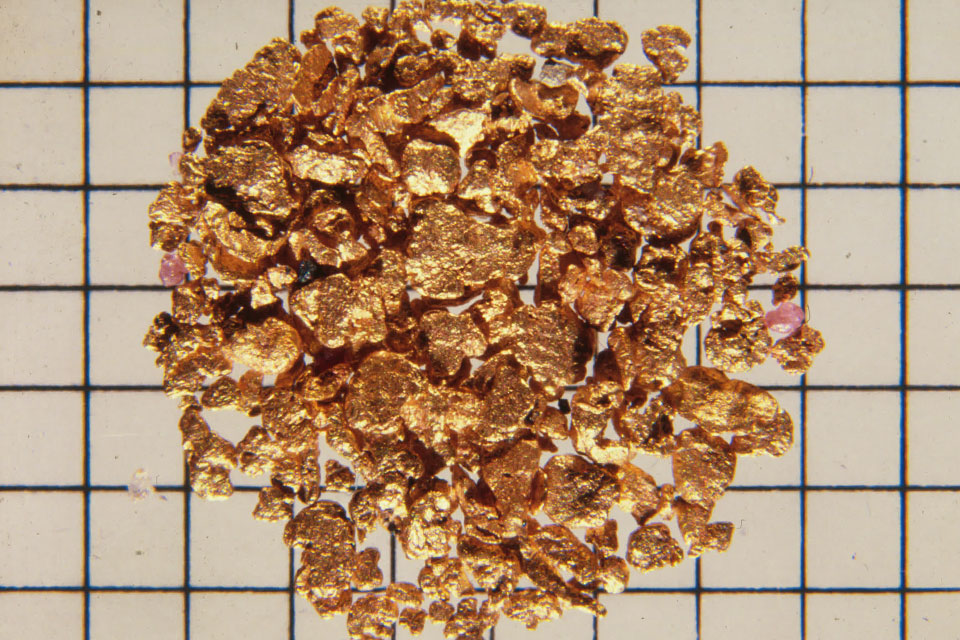
From archive to discovery: historical mineral reports support gold exploration in Scotland
25/06/2026
Digitised geological records show potential to unlock untapped mineral resources in Ardlochan, Argyllshire.

UK and Philippines scientists investigate natural hydrogen generation processes at atomic scale
22/06/2026
BGS researchers were granted access to use the Diamond Light Source facility in order to study hydrogen in light brighter than the sun.
Shortage of end-of-life materials presents challenge to UK critical minerals security
17/06/2026
A new report by the UK Critical Minerals Intelligence Centre reveals insufficient end-of-life material stocks present a supply risk over the coming decade, but offer significant long-term potential to meet critical mineral demand through recycling.
UK geothermal catalogue receives update
16/06/2026
BGS releases the second digital version of the UK geothermal catalogue of subsurface temperature and rock thermal conductivity measurements and heat flow calculations.