Latest research emphasises climate-related subsidence risk to millions of British homes
New data from BGS highlights the projected future impact of warmer, drier summers and underlines the need for mitigation measures in susceptible regions.
11/06/2026 By BGS Press

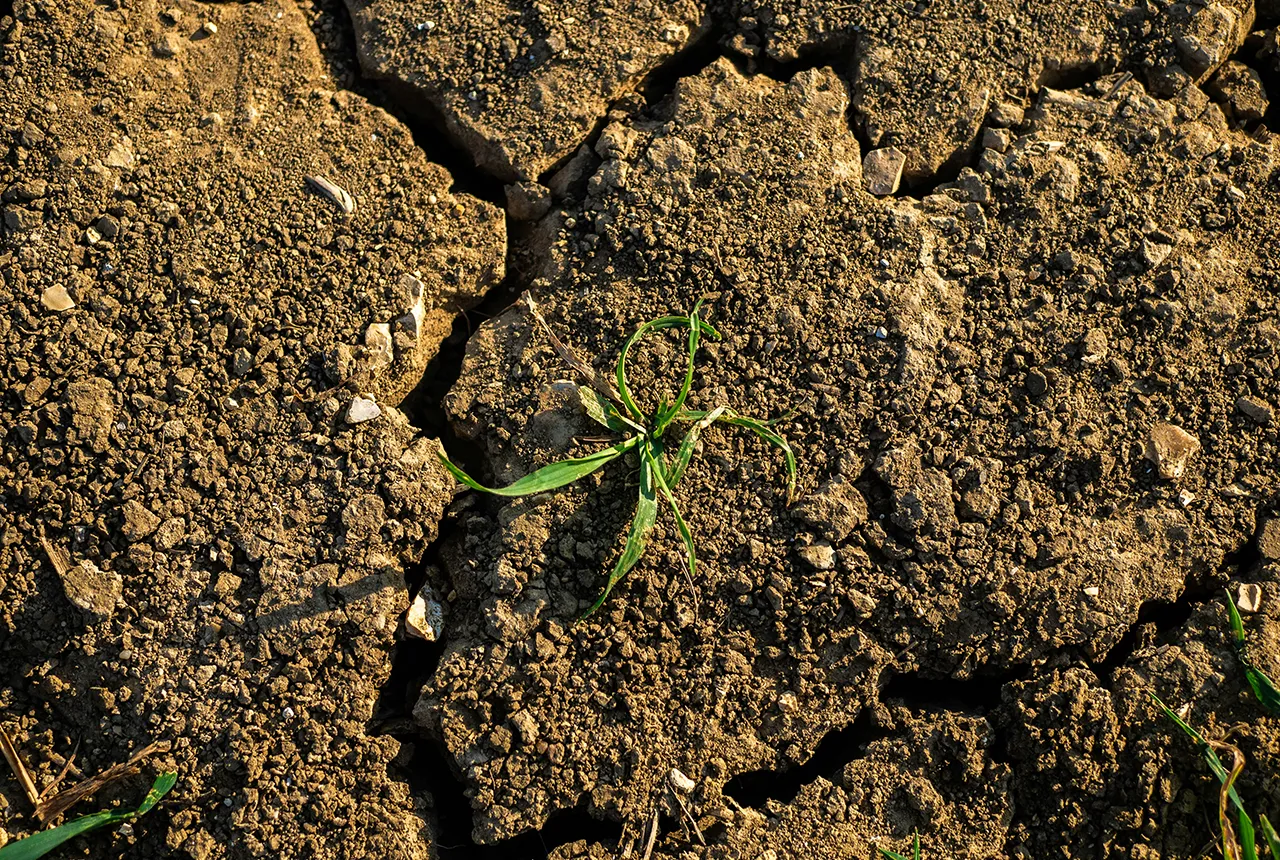
Shrink–swell ground movement, typically reported as subsidence, is one of the most damaging geohazards in the UK today. Many soils contain clay minerals that absorb water and swell when they get wet, then lose water and shrink as they dry out. This natural hazard presents a significant and growing economic cost.
In 2025, the UK experienced the warmest spring on record and the driest in more than 50 years. As a result, subsidence-related insurance claims in the UK totalled £153 million in the first six months of 2025 (ABI, 2025). With climate change projections indicating that hotter, drier conditions are likely to become increasingly frequent over the coming century, the number of properties susceptible to subsidence-related shrink–swell is on the rise.
New maps produced by BGS form part of the BGS GeoClimate Shrink–Swell dataset. The dataset combines 1:50 000-scale geological maps of Great Britain with the highest-resolution climate change data from the UK Centre for Ecology & Hydrology, which is derived from and builds upon the Met Office’s UKCP18 climate projections. The new release improves upon previous iterations by providing outputs for low, medium and high emissions scenarios, with additional projected time intervals between the present day and 2070.
The dataset has been designed to help local authorities, developers and planners mitigate the risk posed by shrink–swell subsidence specific to their region. It will enable them to reduce exposure to potentially high remediation costs, support conveyancing reporters in identifying potential subsidence hazards affecting properties and allow financial organisations such as mortgage lenders and insurers to assess their portfolios for climate change-related risks.
The new dataset evaluates underlying geological conditions against three representative concentration pathway (RCP) climate change scenarios, each of which are based on varying levels of future greenhouse gas concentrations. Under the medium emissions scenario, the projected percentage of British properties highly likely or extremely likely to be susceptible to clay shrink–swell by 2070 is around 5 per cent, which equates to over 1.8 million properties. The number rises to 11 per cent, or just over 4.2 million properties, under the higher emissions scenario.
The dataset forecasts that, by 2070:
- over 4.2 million properties could be affected under the high emissions scenario RCP 8.5, which is the most pessimistic scenario
- around 500 000 properties could be affected under the low emissions scenario RCP 2.6, which is the emissions scenario aligned to the Paris Agreement
- over 1.8 million properties could be affected under the medium emissions scenario RCP 4.5; current global emissions trajectories are closest to this intermediate scenario
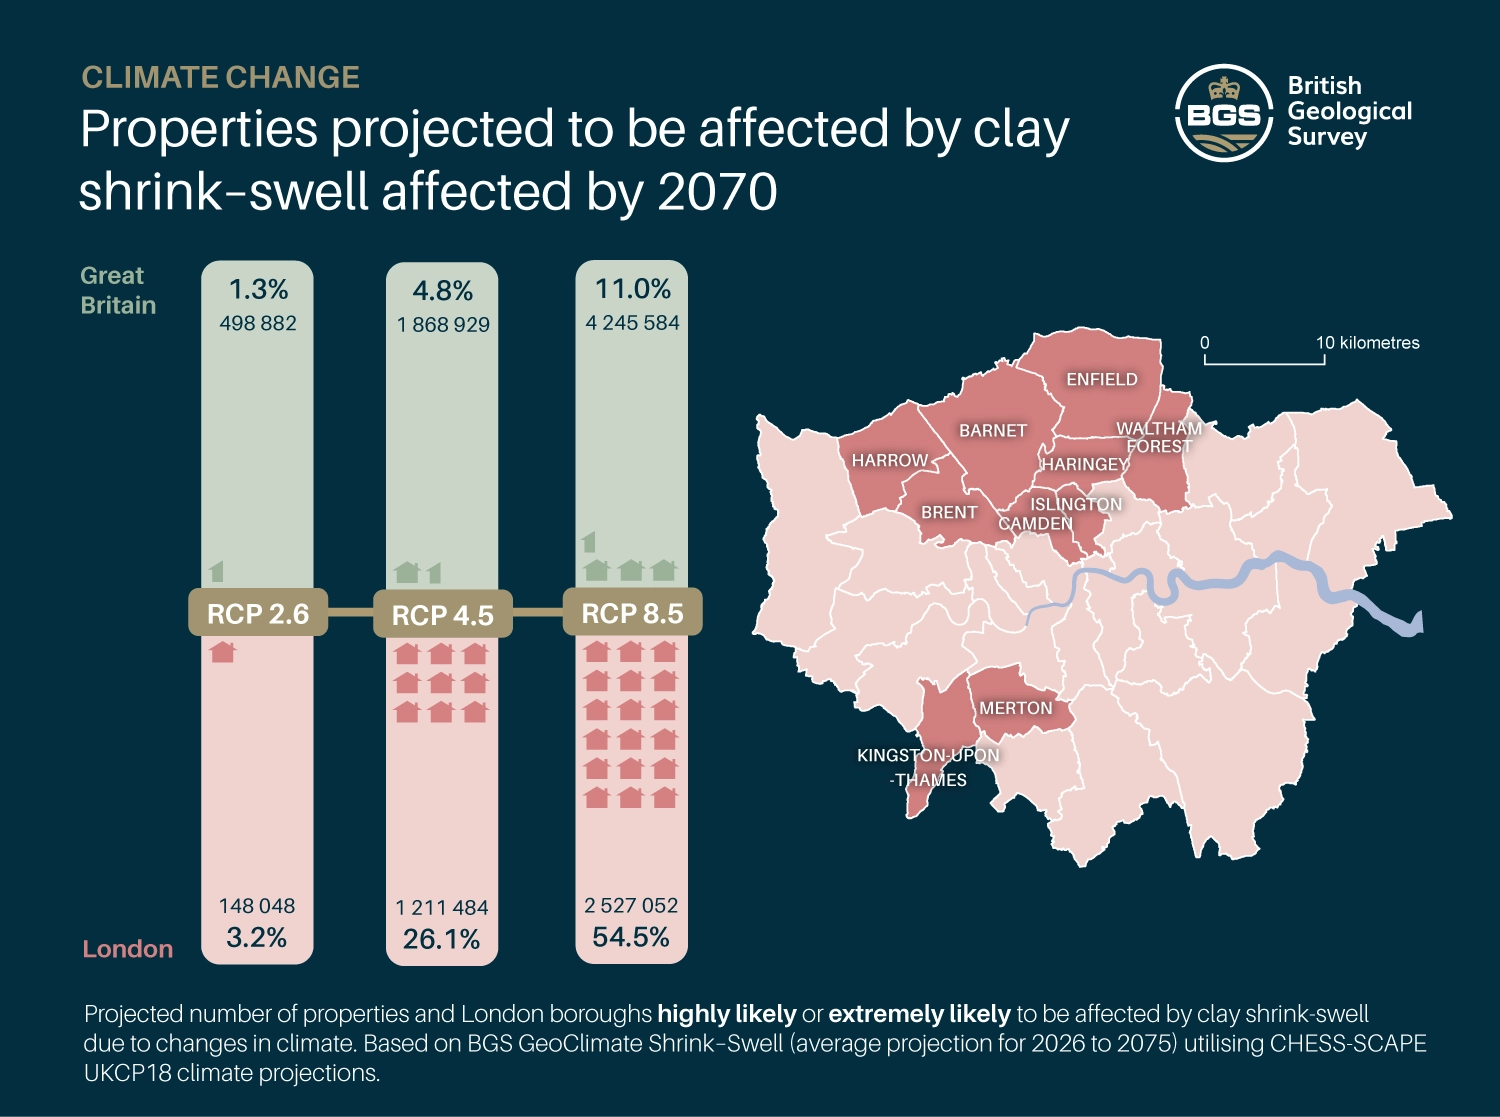
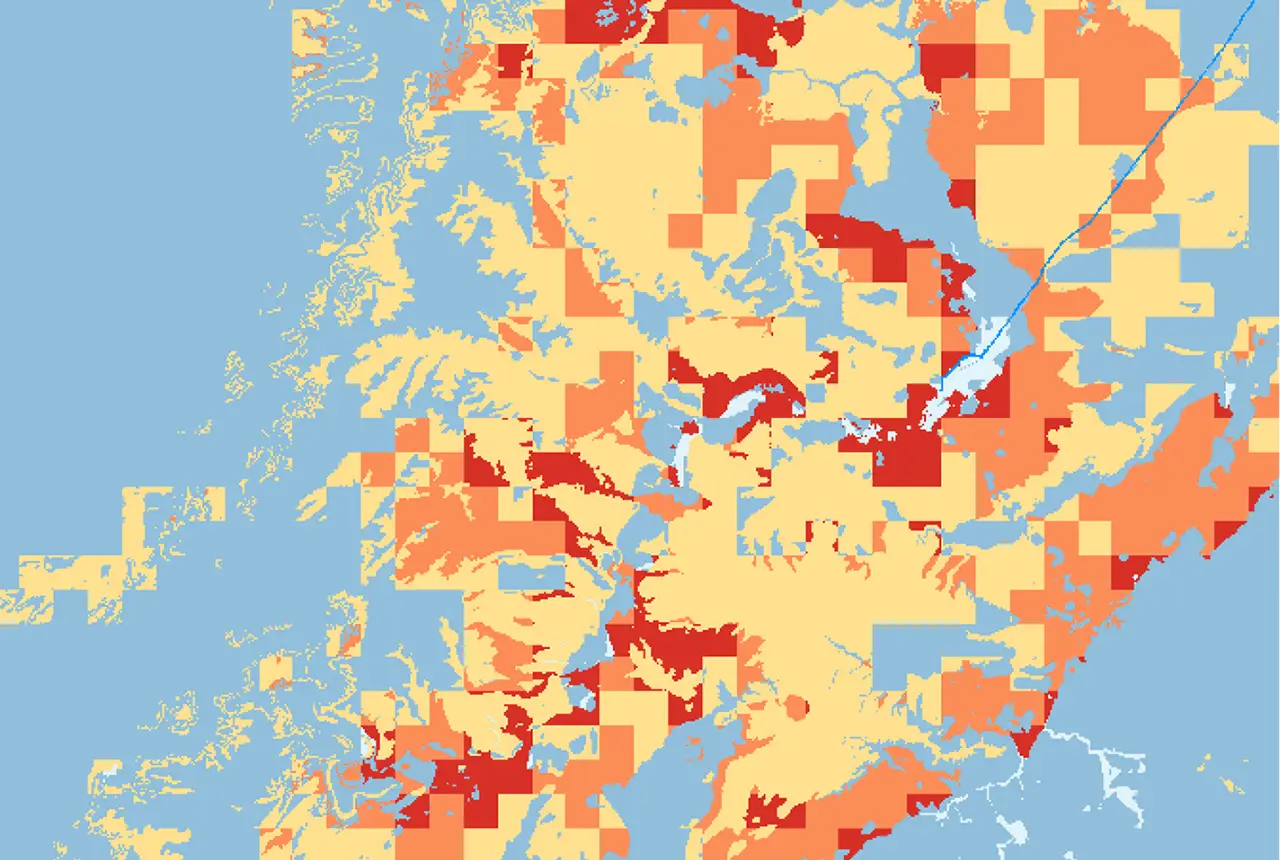
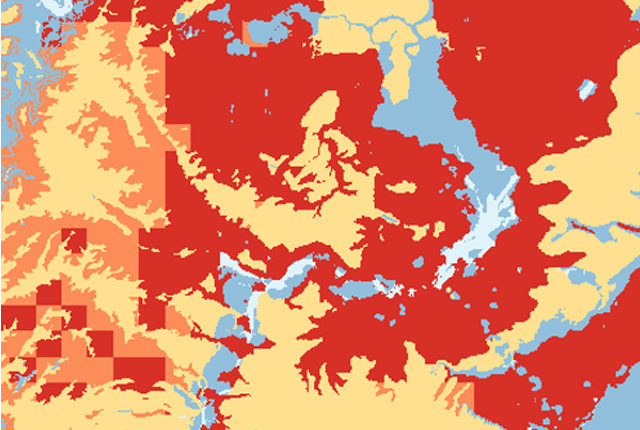
Projected number of properties highly likely or extremely likely to be affected by clay shrink–swell due to climate change compared with London boroughs at greatest risk of being affected by 2070. BGS © UKRI 2026.
The data also shows that the most susceptible regions are found in highly populated parts of London, particularly in northern and central boroughs including Camden, Islington and Barnet, as well as in Kent in the south-east of England. Under the medium emissions scenario, the number of properties likely to be affected by shrink–swell in London will exceed 26 per cent by 2070 and could be as high as 54 per cent under the high emissions emission scenario, with over 2.5 million properties in the capital highly likely or extremely likely to be affected.

By combining geotechnical information about volume change potential with data about projected rainfall and temperature scenarios for the coming century, we have been able to identify the areas of Great Britain most likely to become susceptible to shrink–swell subsidence in the future.
Dry weather and high temperatures are a major factor in the emergence of shrink–swell subsidence. Looking ahead, these increases in hotter, drier summers and warmer, wetter winters are projected to continue.Anna Harrison, applied Quaternary scientist, BGS.
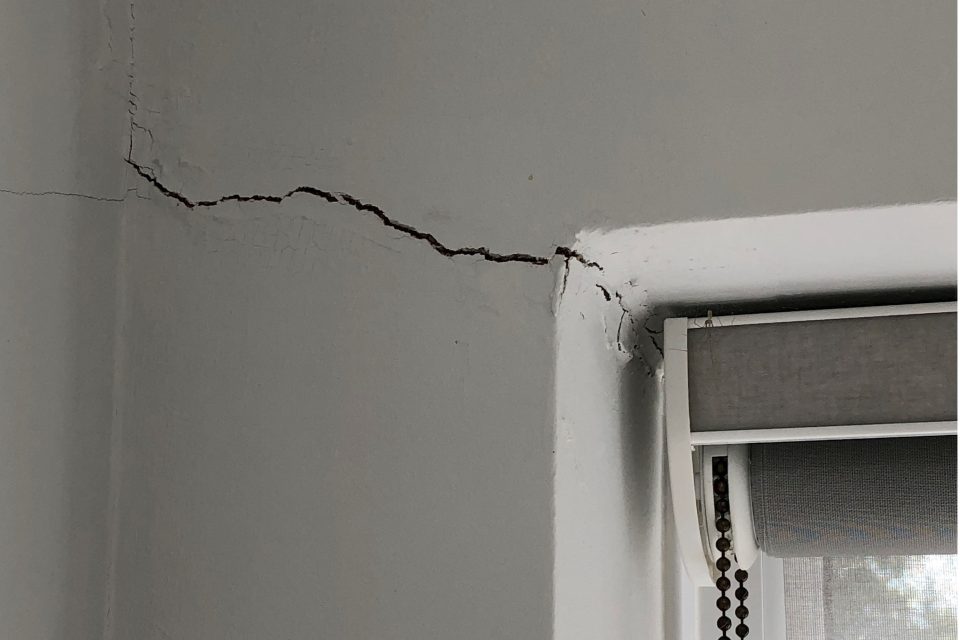
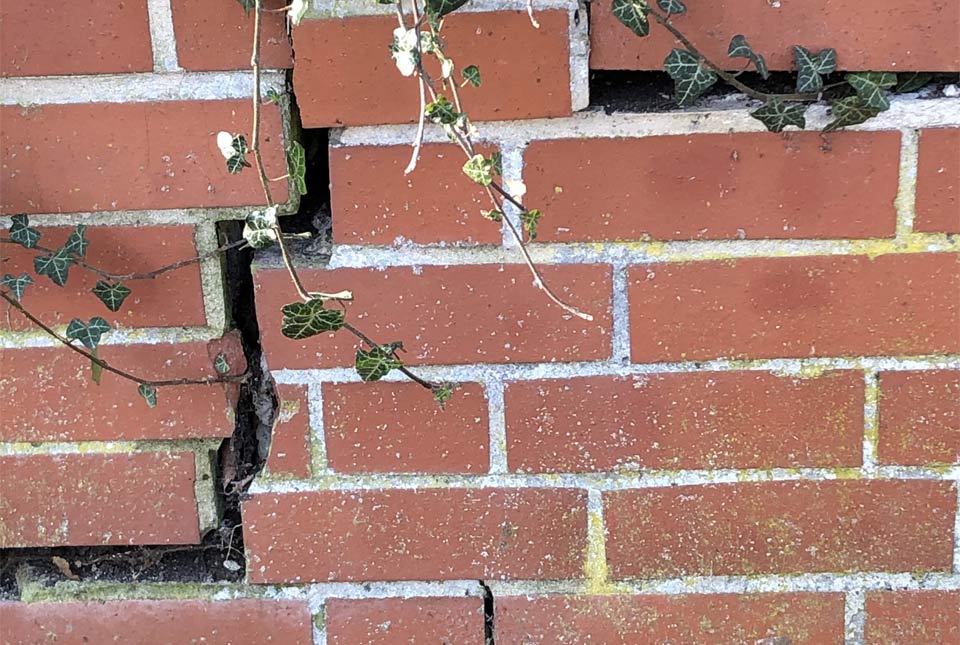
Shrink–swell subsidence can lead to financial loss for anyone involved in the development, ownership, insurance or management of property, major infrastructure works and utilities, including developers, mortgage lenders, insurers, homeowners, transport authorities and local and national governments. These costs can lead to increased insurance premiums, depressed house prices and, in some cases, engineering works to stabilise land or property, replacement of utility pipeworks and unstable transport infrastructure.
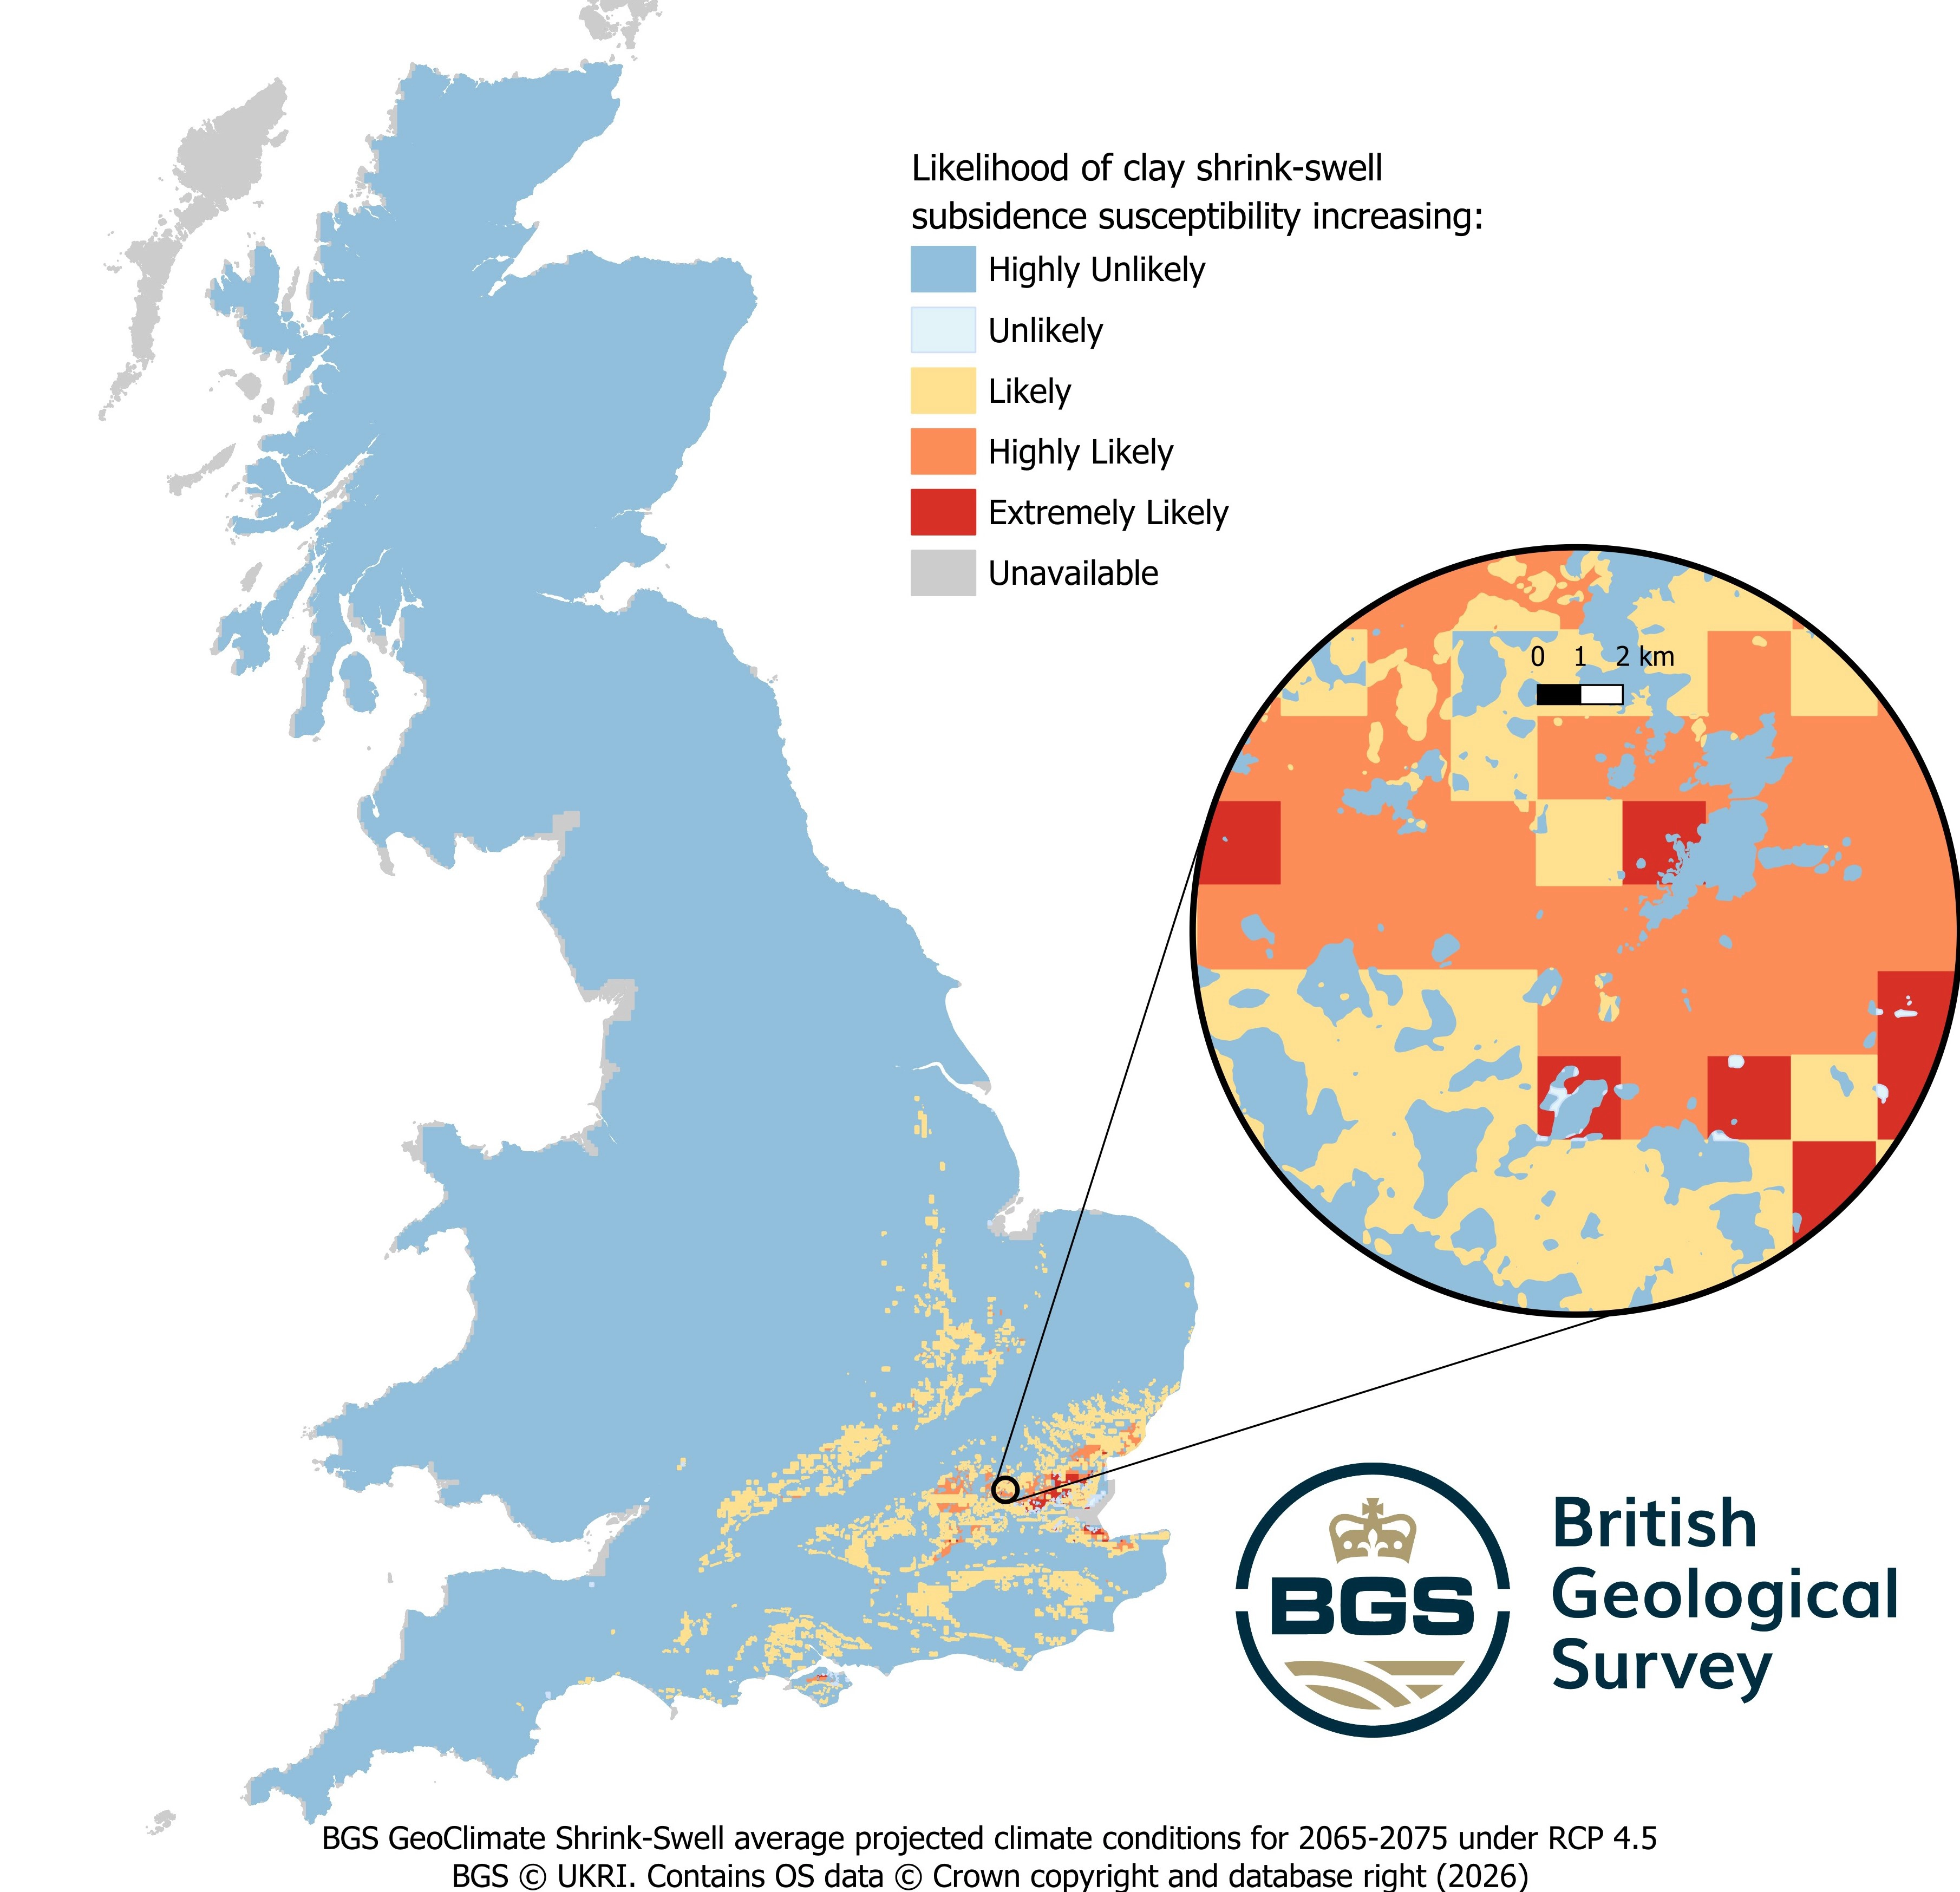
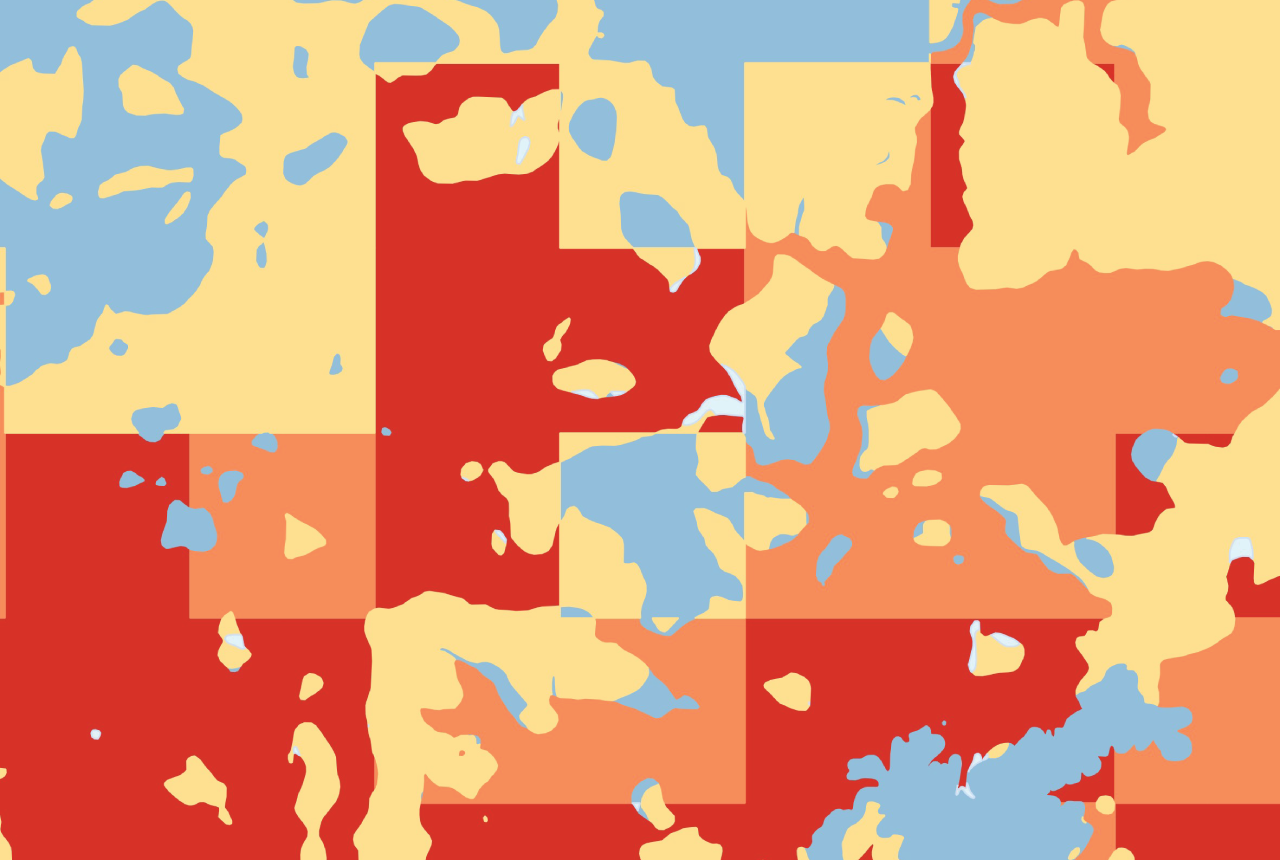
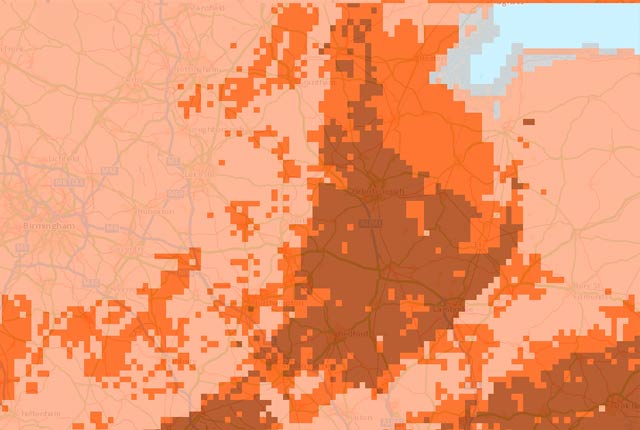
Likelihood of increased clay shrink-swell subsidence susceptibility by 2070 in Great Britain under RCP4.5. BGS © UKRI.
Whilst we should be careful to note that these are projections, there are a number of ways planners, property owners and developers can help limit the potential effects of future subsidence-related issues, including taking specialist advice before starting major building work, avoiding planting trees with larger root systems close to properties, and ensuring the foundation designs of new constructions or extensions take into account the impact of climate change on shrinkable clays.
Anna Harrison, applied Quaternary scientist, BGS.
Relative topics
Premium information is available through GeoClimate Shrink–Swell, which includes projections for average, wetter and drier climate conditions based on low, medium and higher emissions scenarios across variable time periods.
Related news
Latest research emphasises climate-related subsidence risk to millions of British homes
11/06/2026
New data from BGS highlights the projected future impact of warmer, drier summers and underlines the need for mitigation measures in susceptible regions.
GeoClimate Shrink–Swell
GeoClimate clay shrink-swell provides information on the projected future change in susceptibility of clay shrink–swell across Great Britain due to climate change.

BGS GeoClimate – dataset launch webinar
Event on 02/06/2026
The virtual launch of our new BGS GeoClimate dataset – helping mitigate the economic risk from shrink-swell subsidence. Event recording now available

World Cities Day: the geological story of our cities
31/10/2025
Understanding the rocks that underlie our towns and cities, the risks they can present and how they influence urban planning and redevelopment.
What is the impact of drought on temperate soils?
22/05/2025
A new BGS review pulls together key information on the impact of drought on temperate soils and the further research needed to fully understand it.
Six BGS datasets for assessing shrink–swell subsidence hazards
17/02/2023
Shrink–swell subsidence is one of the most significant geological hazards affecting the UK. BGS has six datasets to help assess the problem.

Property subsidence assessment: helping to mitigate shrink–swell hazard risk
25/01/2023
The BGS Property Subsidence Assessment dataset provides insurers and homeowners with tools to better understand shrink–swell and the risk it poses to homes and businesses.
Six ways to prepare your home for climate change related subsidence
19/05/2021
Subsidence caused by shrinking and swelling of the ground can lead to financial loss. How can you mitigate against it?
GeoClimate UKCP09 Premium
This product has now been superseded by the GeoClimate Shrink-swell dataset.
GeoClimate UKCP18 Premium
This product has now been superseded by the GeoClimate Shrink-swell dataset.
GeoClimate UKCP18 Open
This product has now been superseded by the GeoClimate Shrink-swell dataset.
BGS GeoSure
The BGS GeoSure datasets identify areas of potential hazard and, therefore, potential natural ground movement, in Great Britain.