Updated radon map for Great Britain published
The UK Health Security Agency and BGS have published an updated radon potential map for Great Britain.
02/12/2022 By BGS Press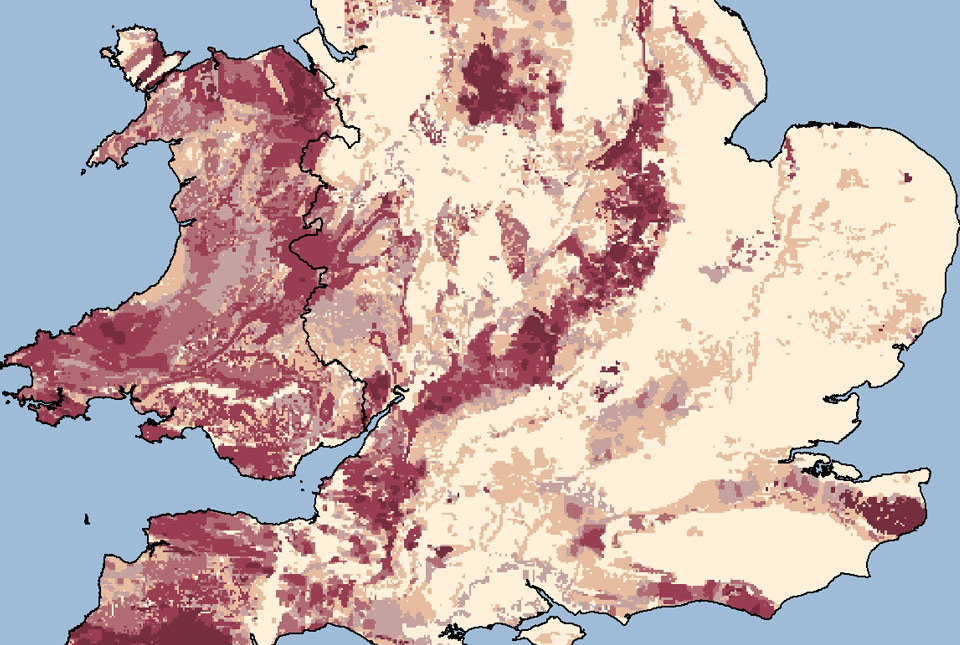

The update to the radon potential map of Great Britain, produced by the UK Health Security Agency (UKHSA) and BGS, is the first in over 10 years and provides an authoritative analysis of the likelihood of a building being in a ‘Radon Affected Area’ (an area with higher radon potential).
Radon (chemical symbol: Rn) is a colourless and odourless gas that 1100 lung cancer deaths per year are attributed to in the UK. The risk is highest among smokers and ex-smokers.
For most people, the risk of developing lung cancer from exposure to radon remains low and levels of radon have not increased across the UK. However, UKHSA advises you to test your home if you live or work in a Radon Affected Area. There are several methods of reducing high radon levels in buildings.
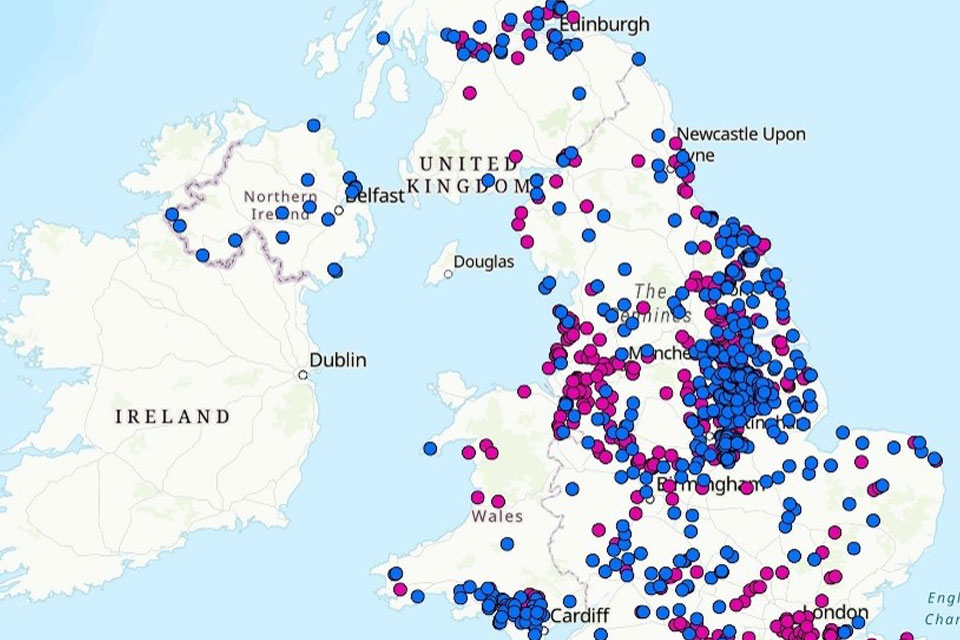
The latest update to the radon map, available to view on the UKradon website, is the product of years of new analysis and research, combining the latest geological mapping with one of the largest databases of in-home measurements ever compiled.
Whilst the vast majority of buildings remain outside Radon Affected Areas, this new map has refined our knowledge of areas where high radon levels are more likely to occur. The overall number of buildings with high radon levels remains the same.
The radon map allows local councils, national and regional governments, social and private landlords, private homeowners and employers to assess the radon risk in their properties. It is also used in building regulations to inform where radon preventative measures should be incorporated in new buildings.

While the vast majority of buildings remain outside Radon Affected Areas, if the property you own is in an affected area, it is important that you arrange for a test. If you live in private or social rented accommodation, speak to your landlord, who should organise a test for you to carry out.
Employers can use this map to help undertake a suitable and sufficient risk assessment and take appropriate action where necessary.
The updated maps provide information that allows property owners, landlords and employers to make informed decisions on the benefits of undertaking radon measurements and potential remediation work.
Tracy Gooding, principal radiation protection scientist at UKHSA.
Radon occurs in all rocks and soils. Using a revised statistical approach to our mapping of geology across Great Britain has enabled us to model where this geohazard is more likely to be present in buildings.
This map is a significant update to the previously published version and will help to raise awareness about this geohazard.
Russell Lawley, BGS Principal Geologist.
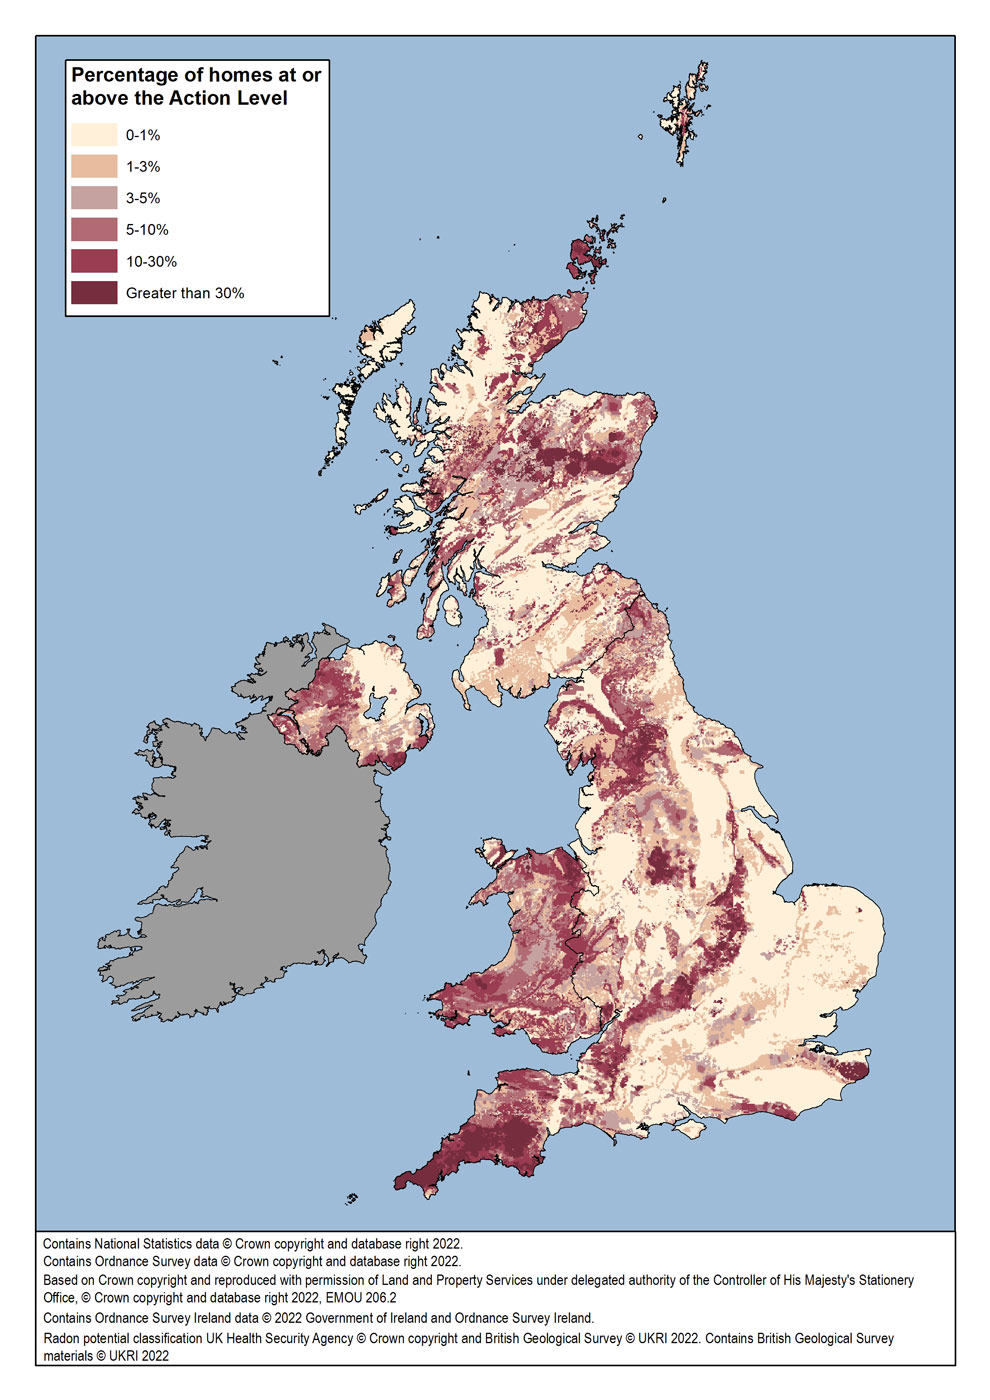
Map showing the full radon potential dataset for the UK.
UKHSA has published guidance for Radon Affected Areas. Further information on techniques available to lower elevated levels of radon are also available.
Radon data available through BGS
- A GIS compatible version of the indicative atlas is available to download free of charge on the BGS website.
- The definitive atlas is available at 25m resolution and can be licensed for use within a GIS. Further information on costs and limitations of use are also available on the Radon Potential dataset webpage.
- Individual property probabilities can be found either from a radon risk report or by obtaining a GeoReport. For large property portfolios a property risk assessment can be undertaken. Further information is available on the UKradon.org website.
- Radon is a colourless, odourless radioactive gas. It is formed by the radioactive decay of the small amounts of uranium that occur in all rocks and soils.
- Radon is measured in Becquerels per cubic metre of air (Bq m-3)
- The average radon level in homes across the UK is 20 Bq m-3; UKHSA recommends that householders should take action to reduce radon levels if their home has a reading of 200 Bq m-3 or more (the radon action level)
- When people take steps to solve the problem, UKHSA recommends they try to reduce radon levels to below 100 Bq m-3
- We combine the results of radon measurements in homes with knowledge of the underlying geology and use statistical analysis to estimate the percentage of homes likely to be at or above the radon action level on that geological unit. In a few areas, where we have insufficient results to accomplish this analysis, an assessment of the underlying geology is made by BGS and the radon risk derived from geology only
- The maps have been updated for the first time since 2007 in England and Wales, and in Scotland for the first time since 2011
- The map for Northern Ireland was last updated in 2015 and has therefore not been updated again on this occasion.
- GIS compatible version of the indicative atlas
- Definitive atlas can be licensed for use within a GIS
Relative topics
Related news
Delving deep into mountains for future water security
16/07/2026
A BGS-led project is using new water-tracing investigation methods, geophysics and modelling to understand how water moves from mountains to the lowlands, helping to improve water security for billions of people.
Updated national 3D model will determine the depth to the solid bedrock beneath our feet
13/07/2026
The BGS Superficial Deposit Thickness Model now includes an elevation model of geological rockhead for the first time, providing important data for civil engineers, geoscientists and environmental scientists.

UK’s world-class research organisations launch new collective
10/07/2026
The launch of the National Research Organisations Group brings together more than 100 science leaders to provide an authorativive voice on science, research policy and long-term investment.
Cheshire Geoenergy Observatory releases key geological datasets for UK thermal energy storage scheme design
09/07/2026
A new report and data packs from BGS will provide a unique resource for scientists working on the geology and hydrogeology of the Sherwood Sandstone Formation, an important aquifer and reservoir rock.
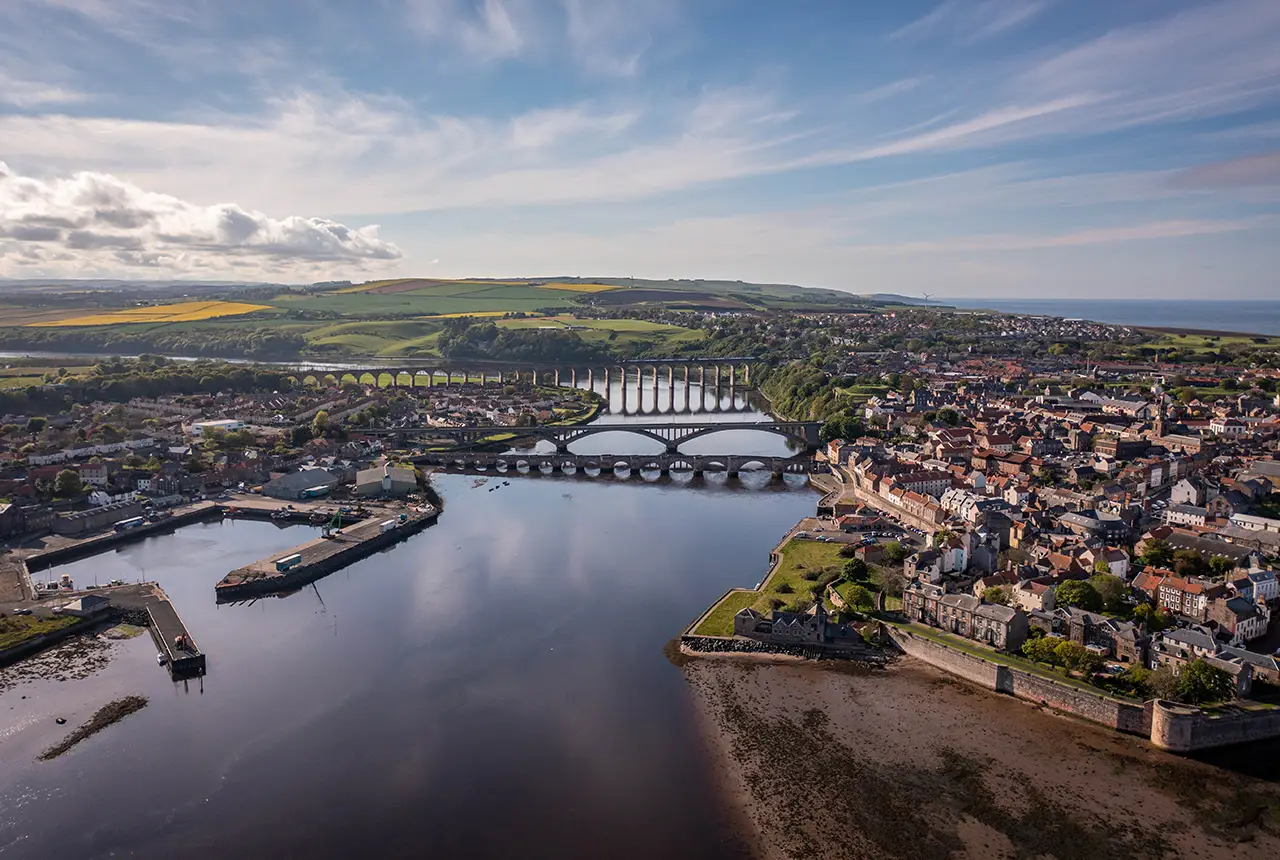
New geological mapping underway to help manage flooding along the River Tweed
08/07/2026
Scientists are surveying the Tweed catchment for the first time in over 100 years to enhance understanding of localised groundwater and improve flood forecasting.

Geological research in North Sea helping to safeguard subsea cables
06/07/2026
Subsea power and telecommunications cables are critical to the UK’s energy infrastructure and global connectivity, yet they remain vulnerable to damage from ship anchors, fishing activity and natural hazards.
UK Critical Minerals Intelligence Centre makes recommendations for the next UK criticality assessment
01/07/2026
CMIC has outlined the enhancements made to the next assessment update to ensure it is better tailored to the structure of the UK economy.
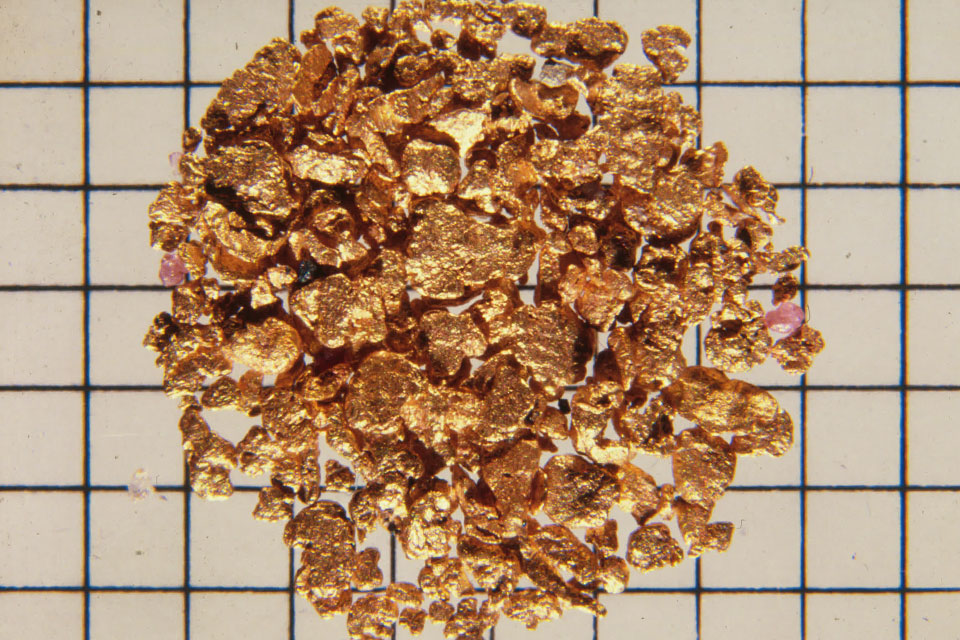
From archive to discovery: historical mineral reports support gold exploration in Scotland
25/06/2026
Digitised geological records show potential to unlock untapped mineral resources in Ardlochan, Argyllshire.
UK and Philippines scientists investigate natural hydrogen generation processes at atomic scale
22/06/2026
BGS researchers were granted access to use the Diamond Light Source facility in order to study hydrogen in light brighter than the sun.
Shortage of end-of-life materials presents challenge to UK critical minerals security
17/06/2026
A new report by the UK Critical Minerals Intelligence Centre reveals insufficient end-of-life material stocks present a supply risk over the coming decade, but offer significant long-term potential to meet critical mineral demand through recycling.
UK geothermal catalogue receives update
16/06/2026
BGS releases the second digital version of the UK geothermal catalogue of subsurface temperature and rock thermal conductivity measurements and heat flow calculations.
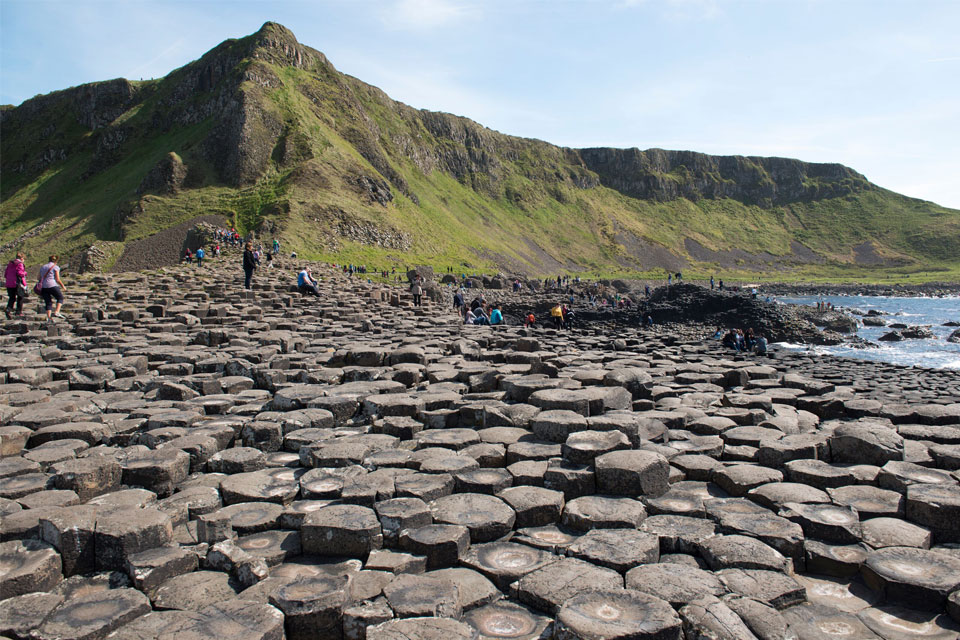
Scientists make new discovery in the history of the Giant’s Causeway
15/06/2026
New research is changing our scientific understanding of the formation of one of the UK’s most iconic landmarks and has revealed that Northern Ireland’s volcanic past occurred over a much shorter period than previously thought.