Updated biosphere map for the UK released
The updated biosphere map for the UK will allow users to identify sulphur isotope variations.
07/07/2023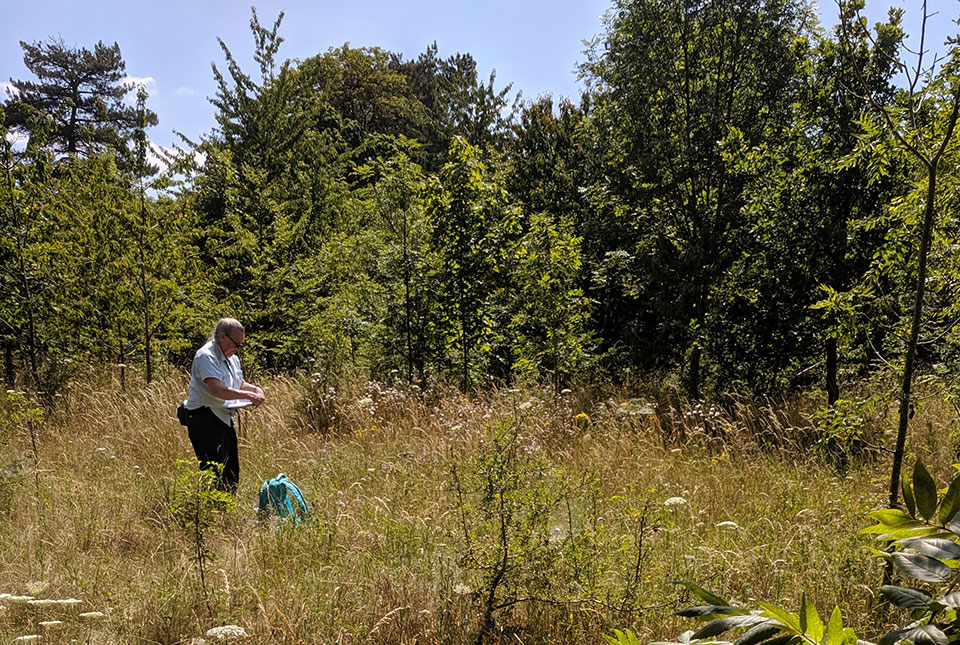

BGS released its first interactive isotope biosphere map in 2018, which enabled users to enter isotope data and find spatial matches and exclusions that helped source their samples. This is primarily used to help archaeologists study and identify human and animal migration, but it also has applications in the modern world of animal migration and food characterisation.
New sulphur isotope variation component
As part of an upgrade to the online map, we have now included a sulphur isotope variation for Great Britain. The beautiful map has been produced through sulphur isotope analyses of over 500 plants from across Britain. This has only been made possible by the reduction of modern sulphur pollution, which, until recently, swamped the natural sulphur signal.
The plants’ sulphur isotope composition varies between values of around +20 parts per thousand in areas affected by modern marine influences, down to negative values as low as around -30 parts per thousand where the plants are growing in areas of anoxic reducing conditions.
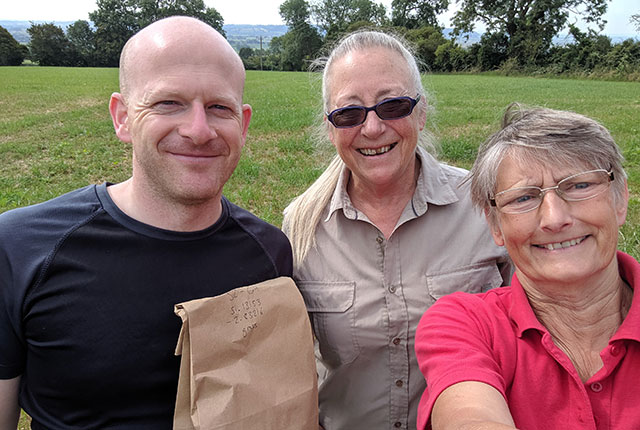
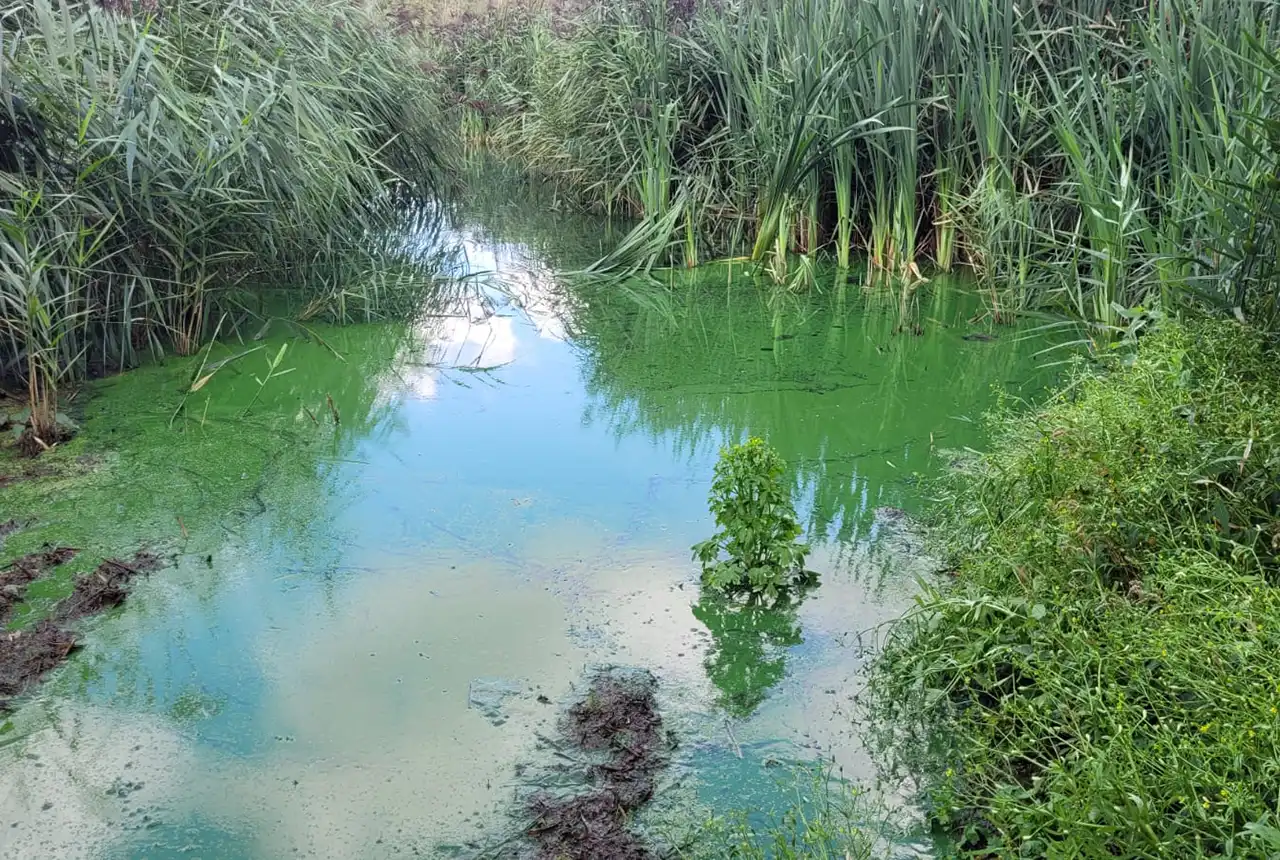
Richard Madgwick, Carolyn Chenery and Jane Evans collecting plants for the British Academy Wet Feet project, led by Angela Lamb. This project focused on the sulphur isotope composition of plants in wetland areas. BGS © UKRI.
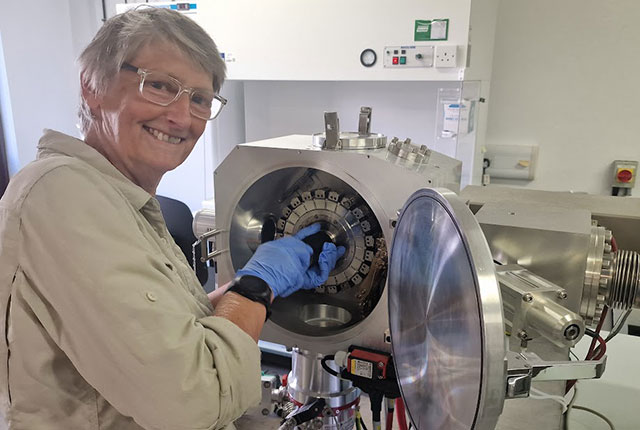
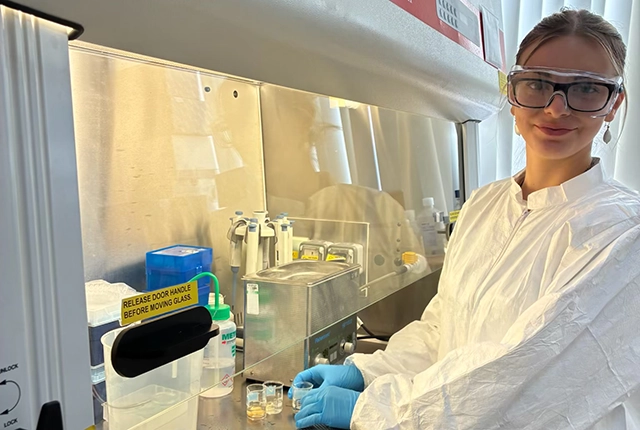
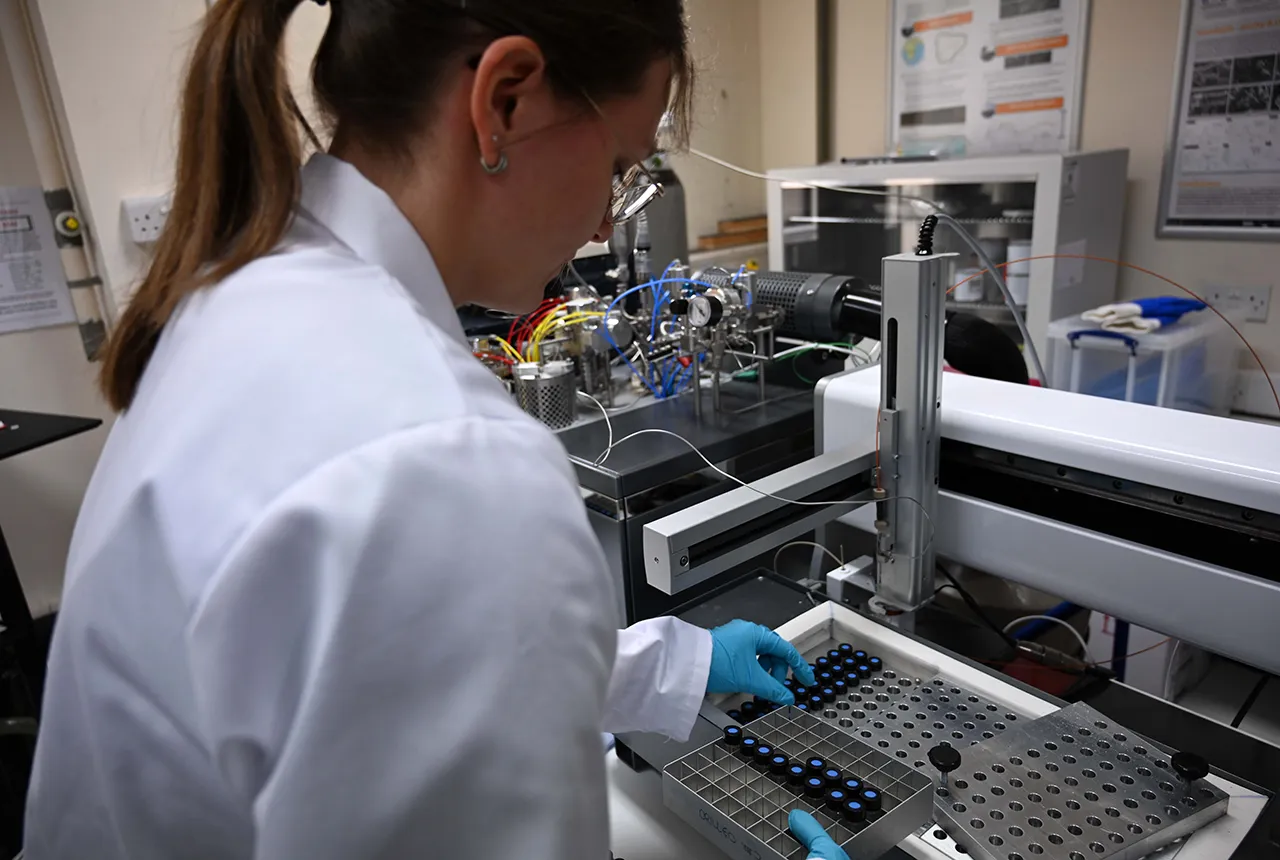
Jane Evans with a mass spectrometer. BGS © UKRI.
Sulphur values
The data has been formed into domains using a method called inverse distance weighting, with a superimposed marine domain for the coastal region. The resulting map highlights the following features that have not been seen before.
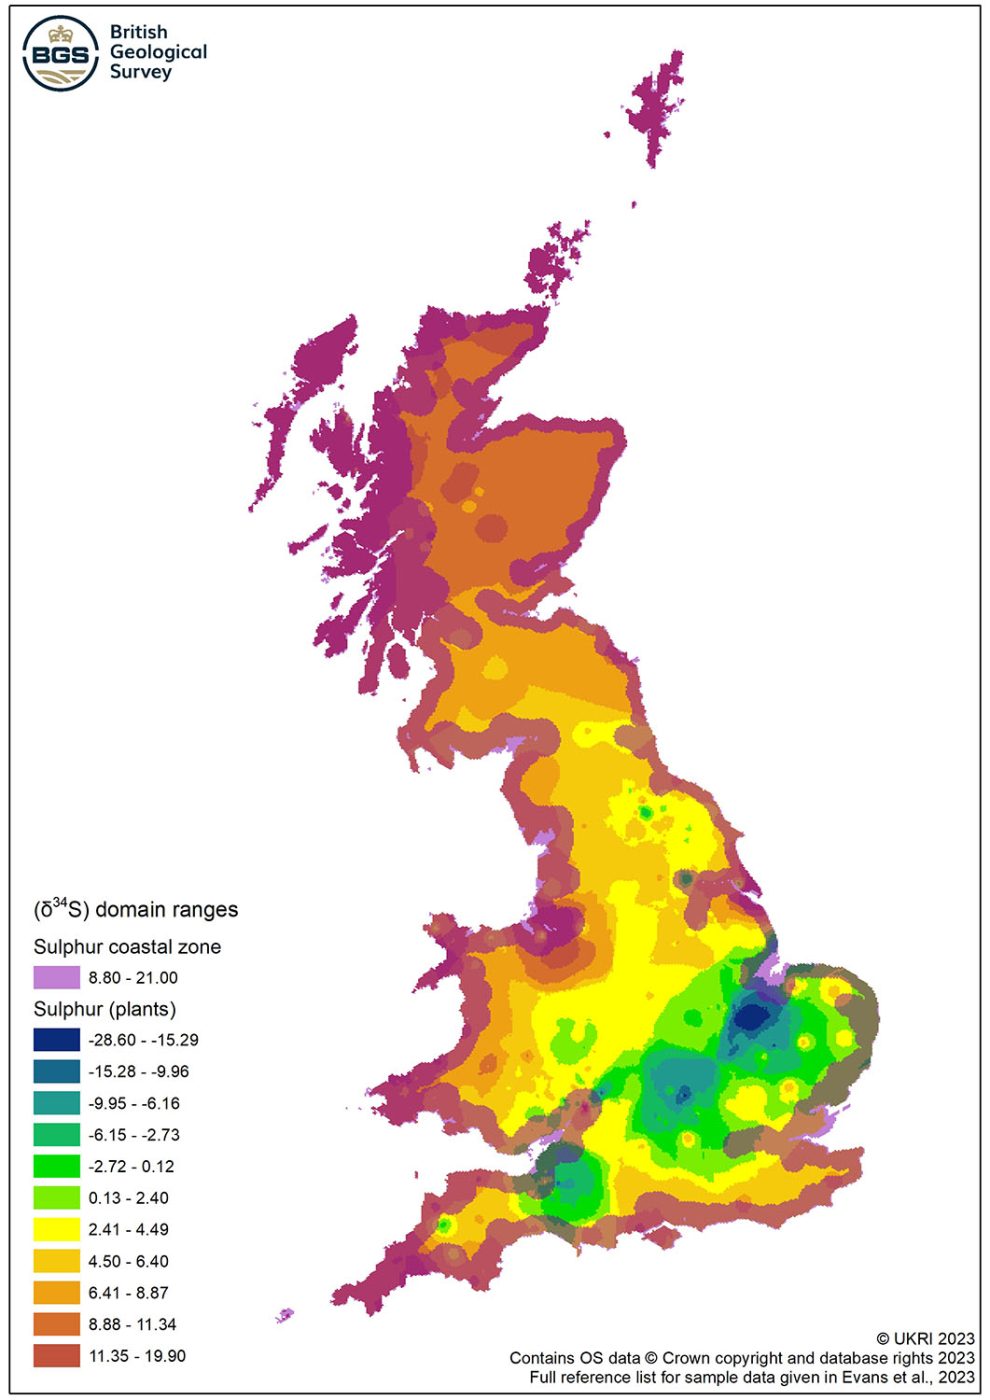
Sulphur isotope map of Great Britain, based on plant samples. BGS © UKRI.
Firstly, there is a zonation of plant sulphur values from north to south, with the high marine influence that extends into central Scotland caused by prevailing wind conditions, transporting rain and sea spray inland.
In southern England, there is an area of negative values running from Peterborough to the Somerset Levels. These are areas underlain by Jurassic mudrocks. Recent research has shown that this lithology supports low and often very negative sulphur isotope values. These are due to both the reducing conditions during deposition and the rocks’ impervious nature, which leads to contemporary wetland development.
The coastal sulphur zone is based on traverses inland to assess the extent of sea spray influence. This work shows that there is a greater coastal zone on the west compared to the east coast.
Further map upgrades
In addition to the sulphur map, the website upgrade includes an updated strontium (Sr) isotope map, which is now based on geological domains. Updates to this map identify new areas where elevated 87Sr/86Sr values are recorded. These include the granites of south-west England, especially around their thermal aureole, and Sherwood Forest, where the ancient woodland has leached out carbonate to leave 87Sr/86Sr-rich substrates.
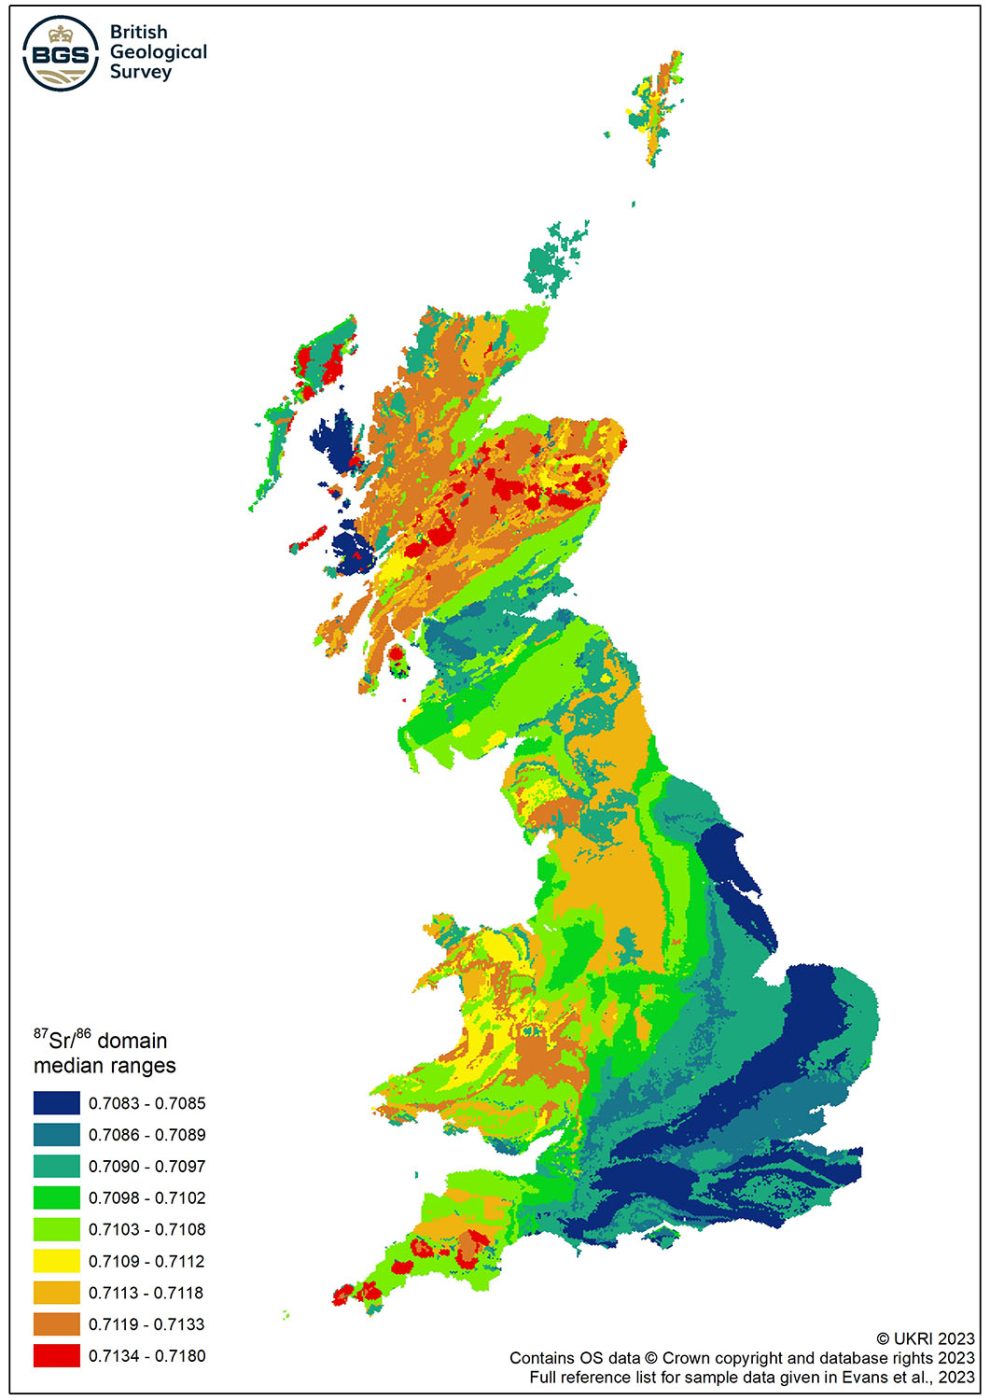
Strontium isotope map of Great Britain, based on geological domains. BGS © UKRI.
As 87Sr/86Sr provenance studies are increasingly used on animals as well as humans, the land usage of these species need to be accounted for. Whereas human teeth mineralise over one to three years and are thus an average of all the strontium dietary inputs over this time, herbivore teeth can be sampled to represent only a few months of ingestion, which might well represent a single field.
Two levels of strontium data are now available in the search system. The first uses the central 50 per cent of plant data to equate to human consumption, whereas the second uses the central 90 per cent of the plant data to account for the greater variability in herbivore teeth.
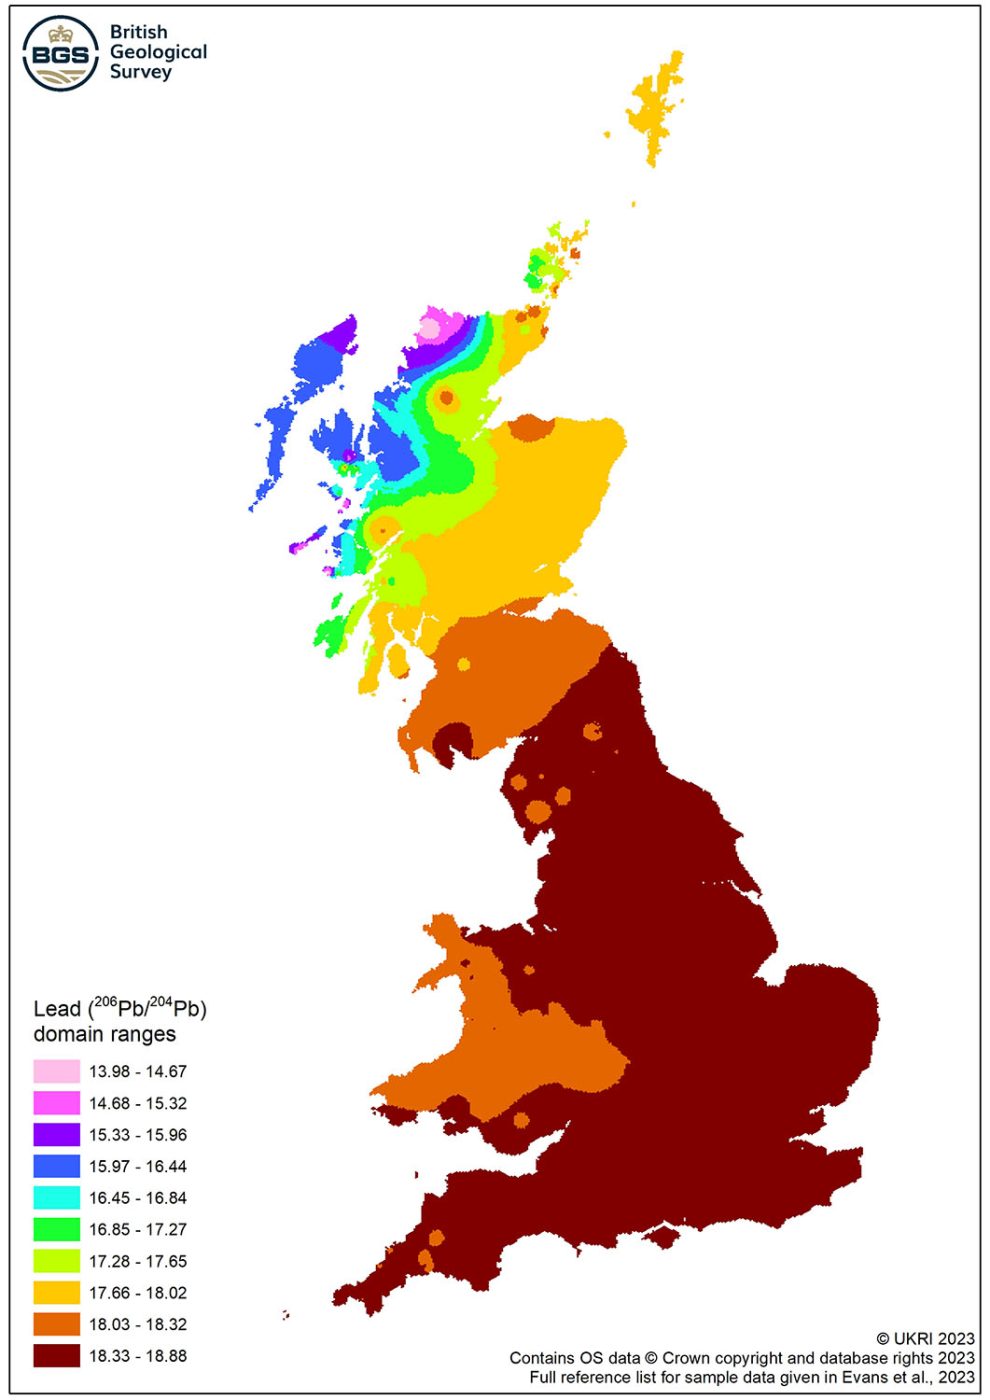
The distributions of 206Pb/204Pb ratios across Britain, defined by domains created using inverse distance weighting and natural breaks. BGS © UKRI.
A lead (Pb) isotope layer has also been added. This is based on mineral compositions and its aim is to produce a basic discrimination for England, Wales and Scotland based on the age of mineralisation in these areas.
Usage
Use of the map is free and all data is accessible and downloadable. We would be very interested to hear from potential users about any applications, development ideas or comments they have and hope to collaborate with users to continue to develop this resource through time.
Developers
The database and map have been created by:
- Jane Evans and Carolyn Chenery from the National Environmental Isotope Facility
- Katy Mee and Andy Marchant from BGS Informatics
About the author
Relative topics
Related news
Isotopes and science: my student placement at BGS
08/04/2026
Industrial placements at BGS for undergraduate students give real-life experience of working in laboratories and learning different analytical techniques.
MARC Conference 2025: highlighting the importance of conferences to PhD students
16/02/2026
BGS and University of Nottingham PhD student Paulina Baranowska shares her experience presenting her research on nuclear forensics at her first international conference.
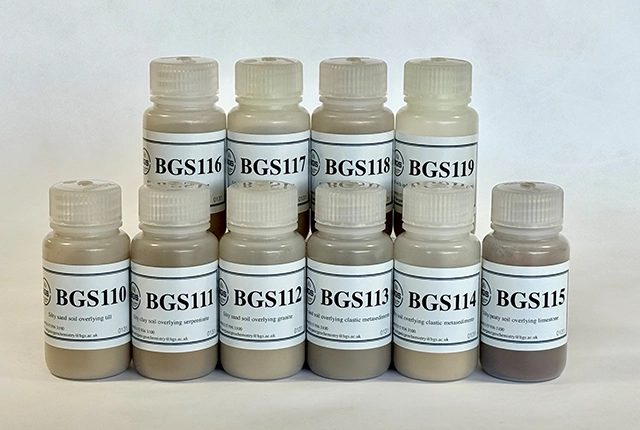
Suite of ten new soil reference materials released
02/01/2026
BGS has a longstanding track record of producing high-quality reference materials and has released ten new soil reference materials.

Dr Angela Lamb appointed as honorary professor by the University of Nottingham
02/10/2025
Dr Lamb will take up the position of honorary professor of environmental geochemistry, with a focus on collaborative research.
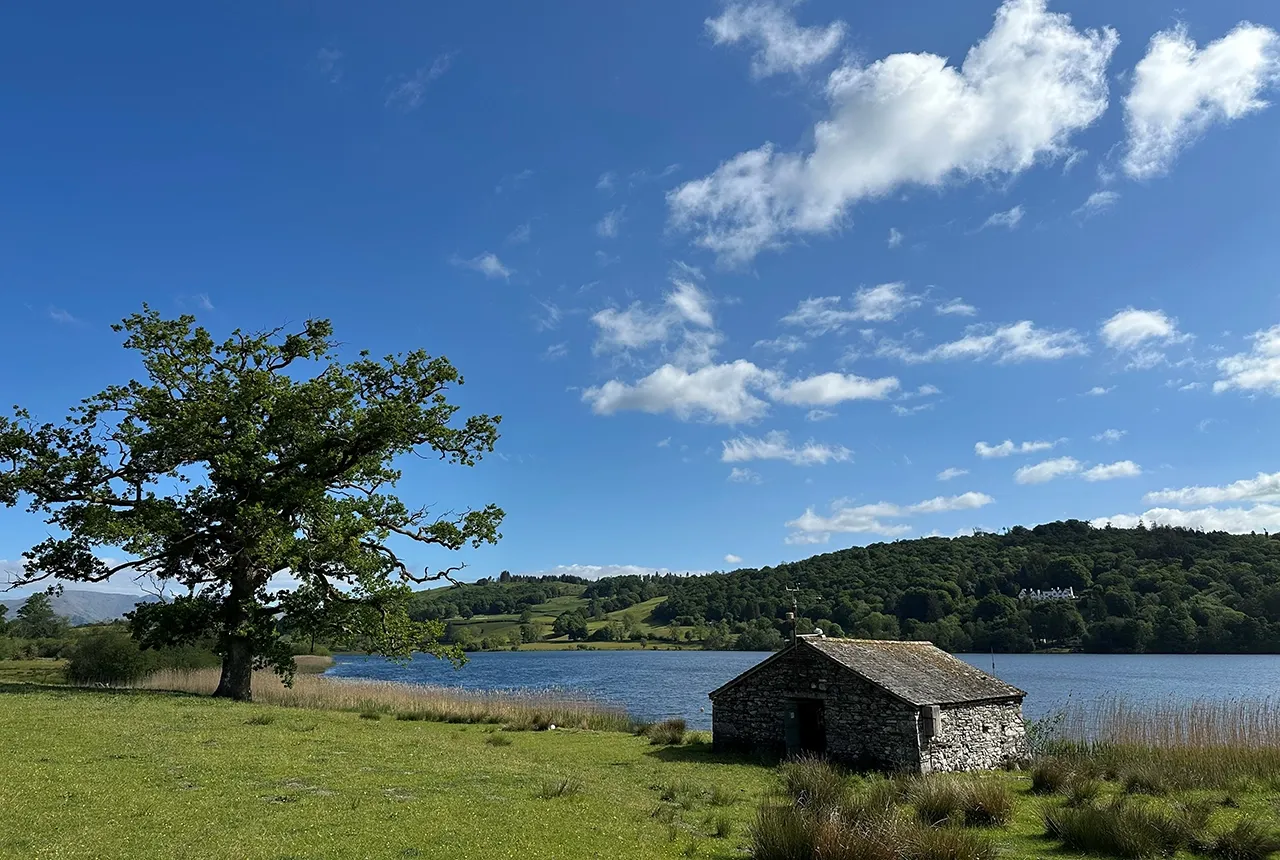
Esthwaite Water: applying novel approaches to understand lake-water nutrient pollution
19/09/2025
Andi Smith (BGS) and Savannah Worne (Loughborough University) embarked on fieldwork in the Lake District, applying a novel stable isotope method for tracing phosphorus sources.
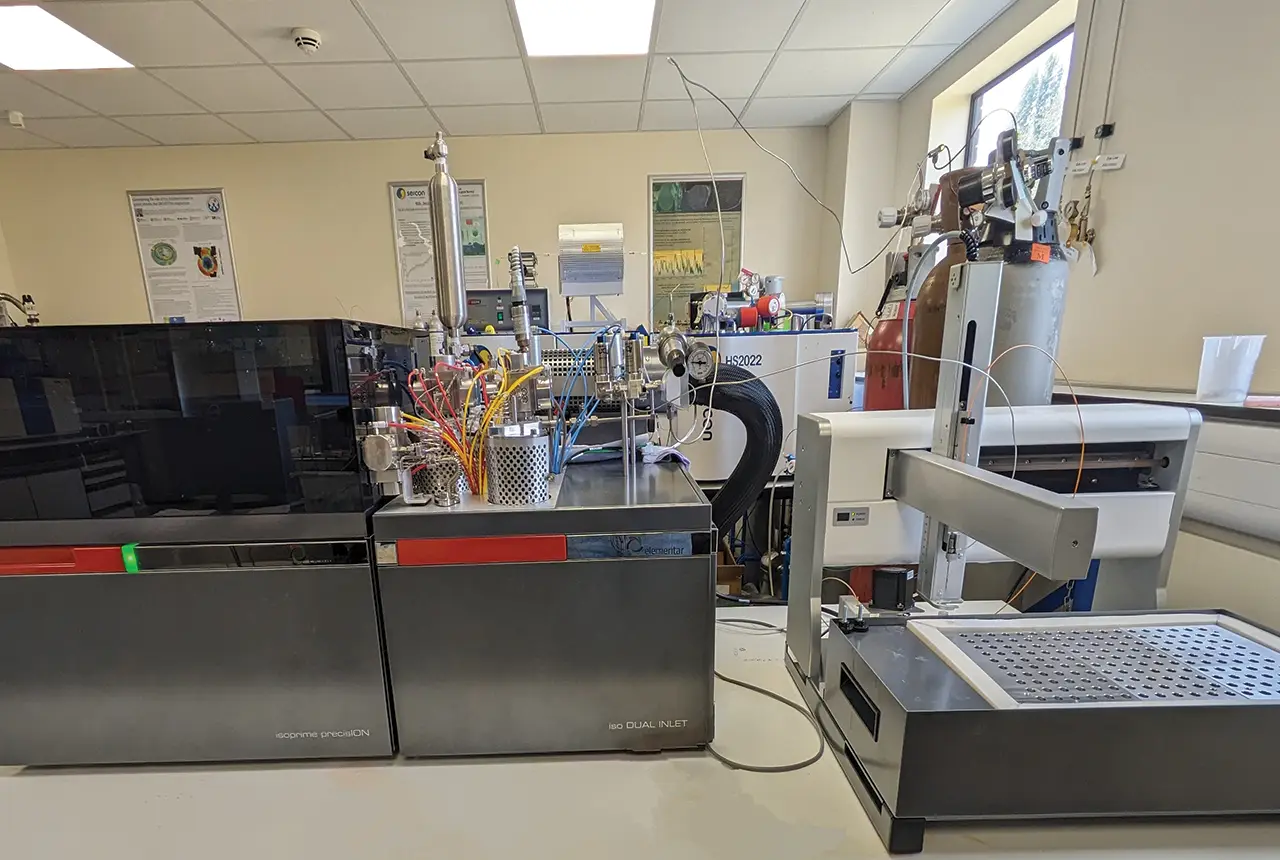
Gemini: a new stable isotope tool
21/08/2025
BGS’s Stable Isotope Facility has new mass spectrometer equipment for analysing carbon and oxygen isotopes from carbonates and water.

Scientists uncover secrets of Stonehenge’s mysterious cattle
20/08/2025
Cutting-edge analysis of a Neolithic cow tooth dating back to the construction of the famous landmark provides evidence of Welsh origins.
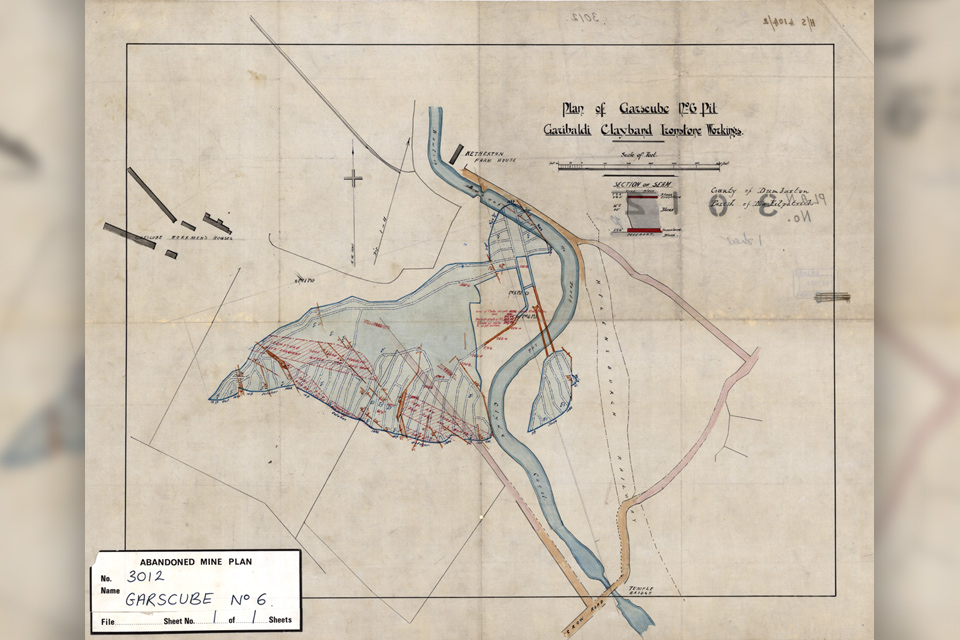
Release of over 500 Scottish abandoned-mine plans
24/06/2025
The historical plans cover non-coal mines that were abandoned pre-1980 and are available through BGS’s plans viewer.
Carbon and oxygen isotope analysis of carbonates and the development of new reference materials
18/12/2024
Dr Charlotte Hipkiss and Kotryna Savickaite explore the importance of standard analysis when testing carbon and oxygen samples.
BGS makes significant advance in mineral data accessibility
10/12/2024
A new public application programming interface for the BGS World Mineral Statistics Database will revolutionise how users interact with critical data.
Studying oxygen isotopes in sediments from Rutland Water Nature Reserve
20/11/2024
Chris Bengt visited Rutland Water as part of a project to determine human impact and environmental change in lake sediments.

How can Scotland re-establish its building stone industry?
14/11/2024
British Geological Survey research, commissioned by Historic Environment Scotland, reveals an opportunity to re-establish the Scottish building stone market in order to maintain the country’s historic buildings.