The BGS monitors glaciers and the landscape that surrounds them in a number of ways, such as boreholes, ground penetrating radar and hydrometric monitoring, at the Virkisjökull Glacier Observatory in south-east Iceland.
- Groundwater studies of glacial sandurs
- Hydrometric monitoring of the Virkisá river
- Landscape change and terrestrial LiDAR
- Subsurface investigations on Virkisjökull
Groundwater studies of glacial sandurs
Glacial sandurs are a largely unexplored groundwater environment that could hold strategic stores of water as glaciers retreat. A sandur is a flat plain spreading out in front of a glacier, made up of unconsolidated and generally coarse-grained and probably highly permeable sediment that’s been washed down by meltwater.
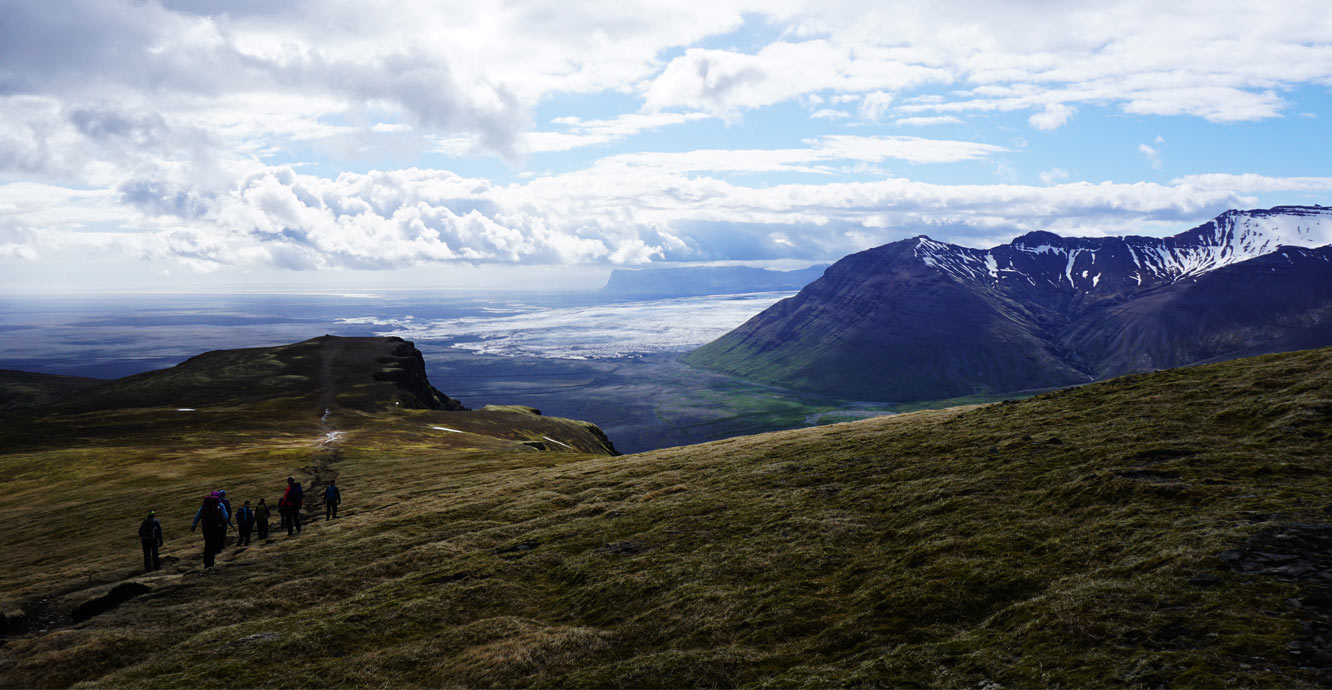

View from Skaftafellsheiði down onto the flat plain of Skeiðarársandur, the world’s largest sandur. Jez Everest BGS © UKRI. All rights reserved.
The observatory at Virkisjökull, with extensive datasets on climate, ice, river and groundwater dynamics, provides an excellent opportunity to investigate sandur hydrogeology and the changes that could occur in glaciated areas around the world as glaciers retreat.
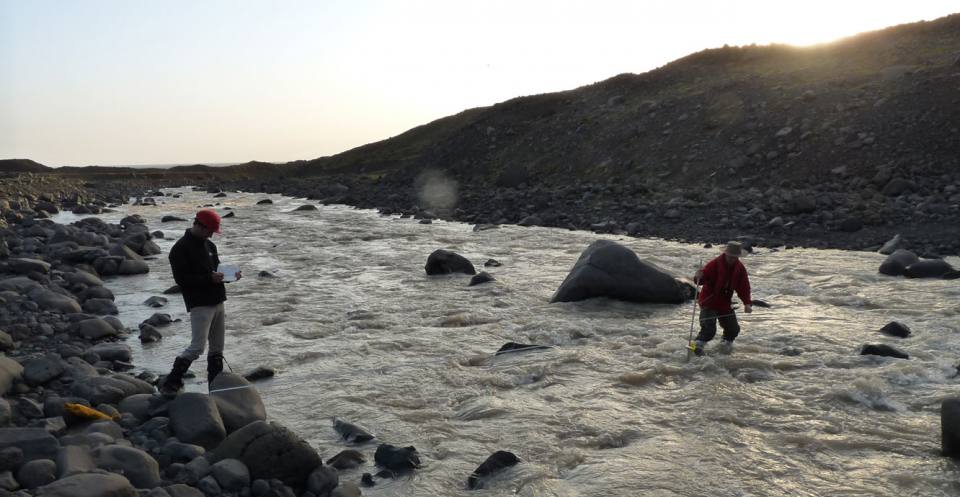
In 2012, we drilled eight shallow boreholes — between 8 and 15 m deep — into the Virkisjökull sandur and carried out a series of tests to investigate aquifer properties, groundwater chemistry and residence time. We surveyed the sandur to identify where groundwater discharges naturally at the ground surface as springs and as baseflow to the river. The boreholes were also installed with loggers for continuous monitoring of groundwater levels and temperature throughout the year.
During this time we continuously monitored river levels and rainfall and carried out seasonal campaigns to measure changing water chemistry and perform tracer tests.
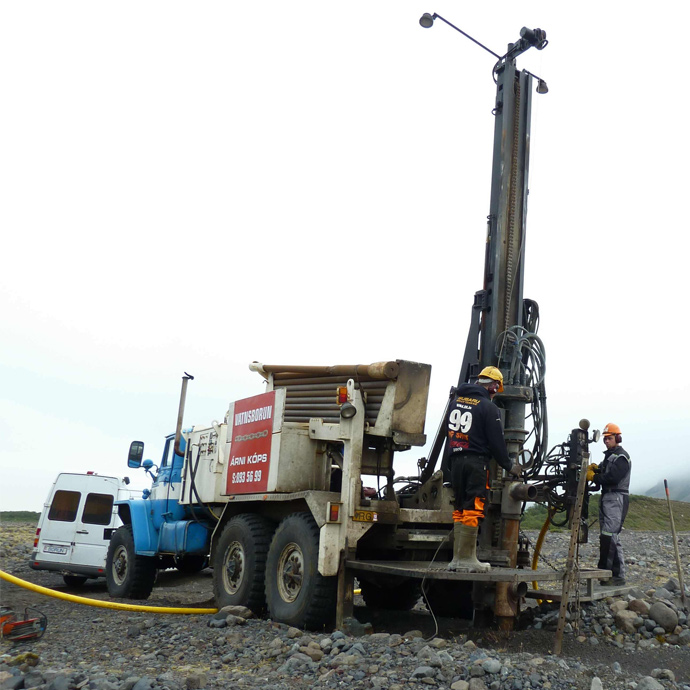
Drilling rig from Reykjavík, hired to drill the shallow boreholes, on site on the sandur in front of Virkisjökull. Brighid Ó Dochartaigh BGS © UKRI. All rights reserved.
We have discovered that the groundwater in the sandur forms a large, high-quality resource (Ó Dochartaigh et al., 2019) and is already contributing to river flow in winter (MacDonald et al., 2016).
The hydrological system — including groundwater levels, recharge, residence times and chemistry — is currently strongly influenced by glacial melt rates, which we have shown have been speeding up in recent years, controlled largely by climate (Bradwell et al., 2013; Flett et al., 2017).
The meltwater river provides recharge to the aquifer close to the river and for several hundred metres (Ó Dochartaigh et al., 2019). However, the sandur aquifer is also directly recharged by rainfall and snowmelt, which means the groundwater will continue to be replenished after the glacier has diminished.
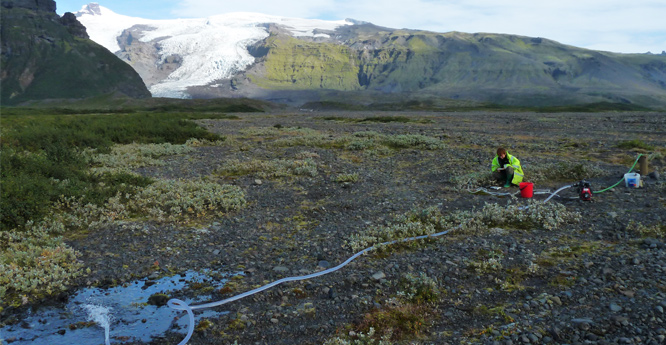 Brighid Ó Dochartaigh conducting a pumping test on shallow borehole M3 on the sandur in front of Virkisjökull. Paul Wilson, GSNI © Defra. All rights reserved.
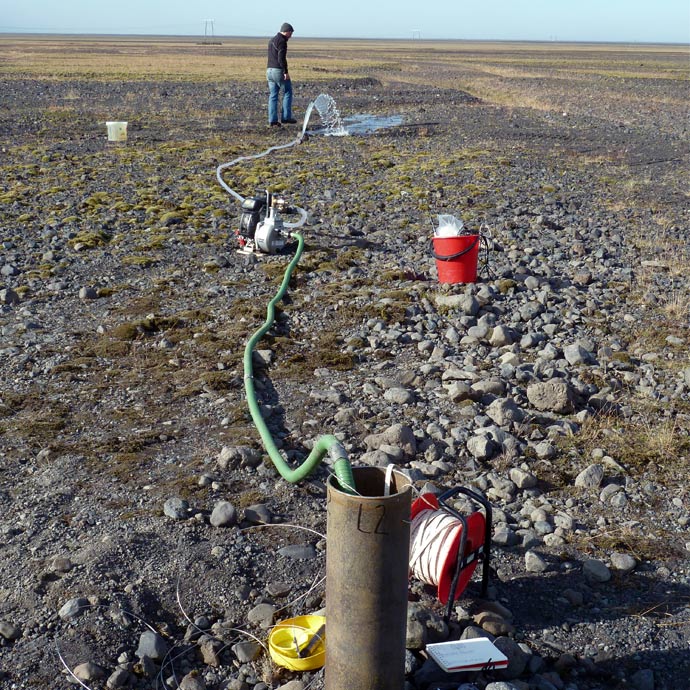 Pumping test being carried out on shallow borehole L2 on the lower sandur, some 5 km from the glacier margin. Brighid Ó Dochartaigh, BGS © UKRI. All rights reserved.
The monitoring boreholes are still active in 2020 and we will continue to collect data from them in the future to continue investigating:
- how the interaction between sandur groundwater and glacial meltwater changes as the glacier retreats
- how the change in meltwater recharge affects the availability of groundwater storage in the sandur aquifer
Hydrogeological data from the site from 2011–2018 are available from the National Geoscience Data Centre:
If you want to discover more then please contact Alan MacDonald.
Hydrometric monitoring of the Virkisá river
The Virkisá river is the only major surface drainage from Virkisjökull–Falljökull and its valley. It is important to know the volume of water leaving the catchment to understand both total meltwater output and how this varies over time. A team from the BGS and the University of Dundee studied the Virkisá between 2012 and 2018 as part of the research and monitoring at the glacier observatory.
The Virkisá is an ideal site to measure the total surface discharge resulting from both precipitation inputs to the catchment (in terms of rain and snowfall) and the discharge resulting from melting of the glacier ice.
Our findings have real-world importance for areas where large numbers of people rely on water from glaciated areas. Countries such as India and Nepal are at least partially dependent on water from glacial catchments for domestic, agricultural and industrial uses. The evolution of these water supplies and their future security are of critical importance to millions as the Earth’s climate continues to change and our glaciers diminish.
Long term monitoring of glacial rivers is extremely difficult, due to a combination of factors.
- Highly variable discharge means that river levels vary constantly from extremely low flows in the cold, dry periods of the winter, to extreme flows during storms, the spring thaw and in hot weather.
- This has the knock-on effect of creating very changeable channel conditions, with high bedload (sediment) transport and movement of the channel course, sometimes on a daily basis.
- Very low temperatures during the winter lead to freezing of the river, reducing overall flow, but with ice on the surface giving ‘false’ readings of water height.
As a result, there are few studies globally that reliably record water balance from glaciated catchments. This challenge has been tackled head on by Dr Andrew Black, a leading hydrologist and hydrometrist from the University of Dundee.
Andrew designed a sensor network at the Virkisá, incorporating two stream gauge sensors (water level) and a water surface velocity radar sensor. These were supplemented by two cameras giving a visual indication of river conditions.
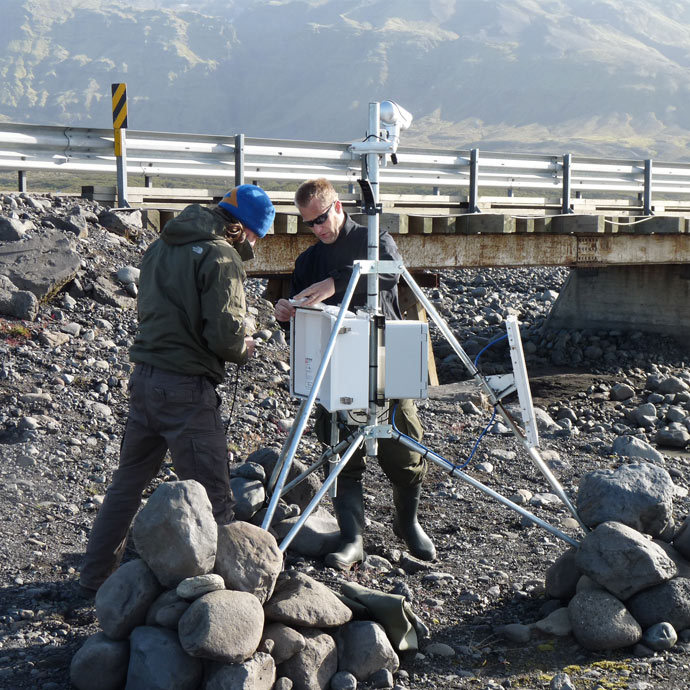
Automated stream gauge 1 (ASG1) acted as the hub, gathering readings from all sensors on the river. Also fitted with a camera, ASG1 transmitted this data to the BGS every day for continuous monitoring of the river state and behaviour. Here, Tom Shanahan and Heiko Buxel are installing a new antenna for the phone communications. Jez Everest, BGS © UKRI. All rights reserved.
We have been able to determine the seasonal and annual discharge from the catchment, which we can relate to precipitation and temperature data from our weather stations, and to our measurements of ice melting from the glacier. By incorporating the data from our groundwater borehole network, we have been able to make very good estimates of total water output from the catchment and see how these vary as a result of seasonal or longer climate variation.
If you want to discover more then please contact Jez Everest at the BGS or Andrew Black at the University of Dundee.
Landscape change and terrestrial LiDAR
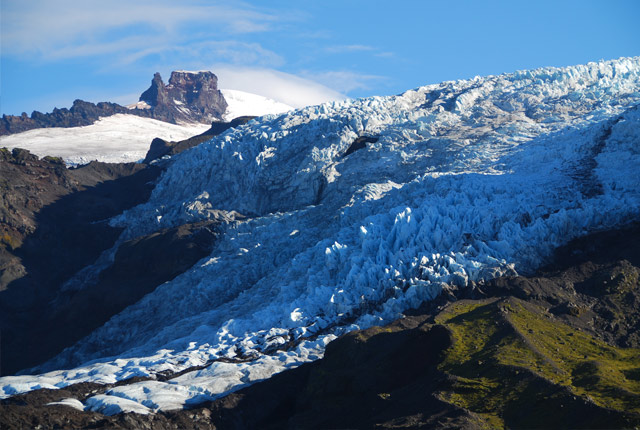
Spanning more than a decade, photographic and volumetric evidence clearly demonstrate that Öræfajökull’s outlet glaciers are now smaller than at any time in the last 100 years and are shrinking at an increasing rate — faster than at any time in the last 100 years.
Terrestrial light detection and ranging (LiDAR) is a land-based laser scanner technology that, when combined with a highly accurate differential GPS, enables us to produce 3D computer models of the landscape around the glacier.
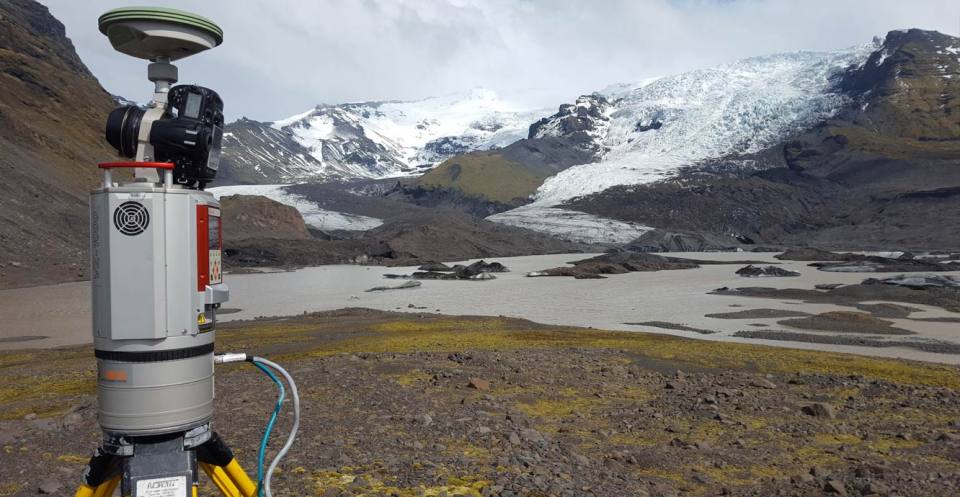 The BGS-owned Riegl VZ1000 conducting a survey of the deglaciated foreland at Virkisjökull. Jez Everest, BGS © UKRI. All rights reserved.
The scanner can capture 120 000 points per second, all precisely positioned in x, y and z relative to the scanner position. In only a few minutes, the LiDAR will capture 100–200 million scan points on the landscape. Completing several scans from different positions allows us to gather scan points from all over the landscape — termed a ‘point cloud’. As the scanner has a digital camera attached, each of these points can be given a ‘real’ colour.
From the point cloud, a very accurate digital elevation model (DEM) can be created, which shows a realistic landscape surface. By repeating scans and then subtracting one from another we can see what has changed and by how much between scans. These are called change models and they are extremely valuable in being able to show rates and amounts of landscape change.
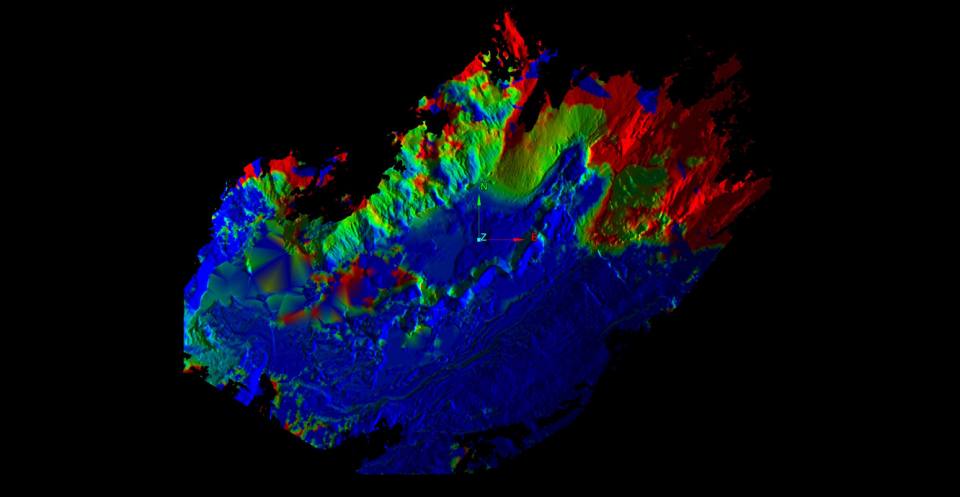 This image show a change model of land surface change, measured by the LiDAR scans, between 2013 and 2014. The glacier margin forms the top right, elevated portion of the model. The esker system can be seen emerging from the centre of the margin at the top right of the image and extending to the middle and bottom left. Areas of no change in height are shown in blue and areas of greatest change in height are in red. This shows us in high resolution how fast different parts of the glacier and foreland are changing in response to climate. Lee Jones, BGS © UKRI. All rights reserved.
Using a series of scans made annually, we can accurately calculate both ice volume change and glacier retreat, as well as rates of landscape evolution over time. We can also get far more information about how the glacier and surrounding landscape are changing than is possible from traditional levelling or photographic techniques.
In the last 15 years we have recorded over 1 km of horizontal retreat and well over 65 m of vertical thinning taking place at this glacier. We estimate this represents around 12 per cent of its total ice volume has been lost in just these few years.
By comparing these ice volume and landscape changes with our climate data and our other datasets, we are starting to discover the linkages and driving forces behind landscape and glacier evolution.
If you want to discover more then please contact Jez Everest or Lee Jones.
Subsurface investigations on Virkisjökull
The landscape at Virkisjökull has changed rapidly, both on and in front of the glacier. We used ground penetrating radar (GPR) to investigate how these surface changes relate to conditions below the ground. The GPR studies were carried out alongside ice-surface structure mapping, LiDAR scanning, ice velocity measurements and groundwater investigations. The main goal of the GPR surveys was to help us understand:
- how the structures inside the glacier (fractures and faults) relate to changes that we’ve been able to observe on the ice surface
- how much buried ice there is underneath the outwash in front of the glacier and how this influences the hydrology of the proglacial area
Ground penetrating radar (GPR) works by emitting short pulses of electromagnetic energy that travel into the ground. These are partially reflected when they hit a change in the subsurface (for example, a water-filled fracture within glacier ice). The reflected energy is then picked up by a receiver, where its amplitude and two-way travel time (TWTT) is measured. When we convert the TWTT to depths we can start to build up images of features below the ground surface.
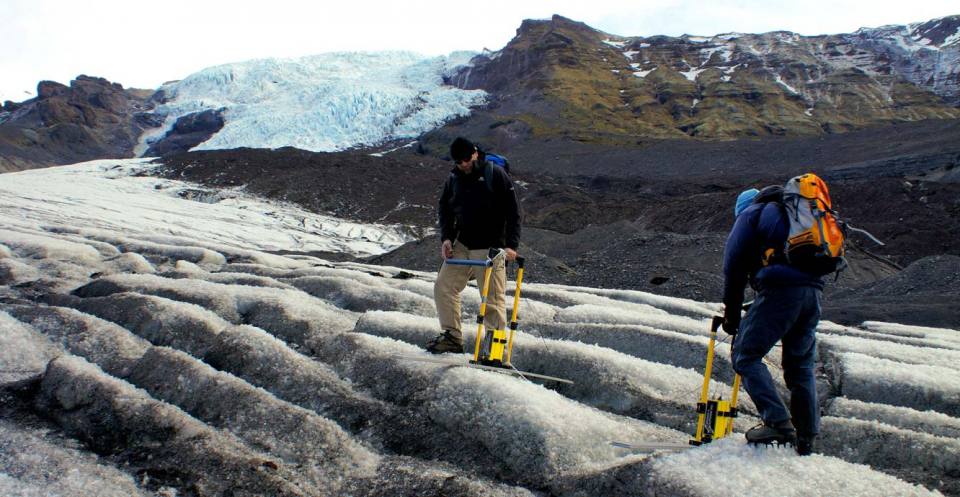 Andrew Finlayson and Jez Everest conducting a GPR survey up Falljökull using the PulseEKKO Pro. Lee Jones, BGS © UKRI. All rights reserved.
We combined our GPR results with surface structure maps and LiDAR scans to build 3D models of the glacier margin.
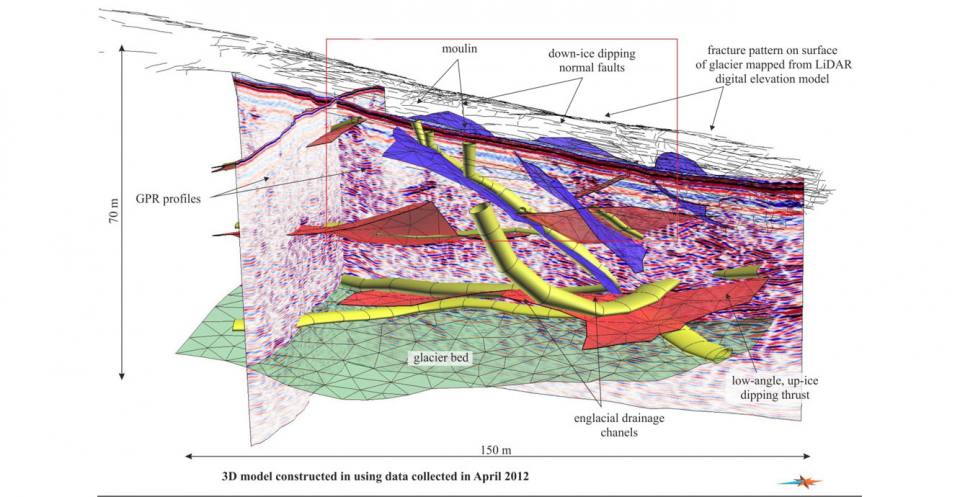 LiDAR-scanned upper surface of Falljökull, the glacier bed and slices through the glacier (pink) derived from the GPR surveys. Using the GPR data, faults (purple) and thrusts (red) could be determined, plus the probable location of englacial drainage conduits (yellow). Andrew Finlayson, BGS ©UKRI. All rights reserved.
On the glacier we could see fractures and faults inside the ice, which were closely related to changes that we could measure on the surface. A large amount of glacier surface lowering at the margin could be related to down-faulting that occurred in the winter. We also found structures further up the glacier that appeared to relate to changes in glacier flow as it has adjusted to a warmer climate.
In front of the glacier, we identified buried ice up to 30 m thick, which lies beneath the outwash sediments. This karst-like ice has strongly influenced the hydrogeology of the catchment. It is heavily fractured with numerous (and sometimes large) conduits. During the fieldwork it was constantly changing — new potholes opened up at the surface up almost every day!
Raw GPR data from the site from 2009–2014 is available from the National Geoscience Data Centre.
If you want to discover more then please contact Andrew Finlayson.
Further reading
For more information please view our research publications.
You may also be interested in
Glacier monitoring
The BGS uses cutting-edge technology in Iceland to monitor how glaciers and their surrounding landscape change over time, and how they respond to climate.