The BGS Geology datasets are digital geological maps of Great Britain based on the different series of published BGS geological maps.
The larger-scale maps provide detail for site-specific use; the medium- to small-scale maps provide national coverage. Ongoing revisions from our survey activities are updated on a regular basis.
We currently offer digital data at four key scales.
Datasets in this series
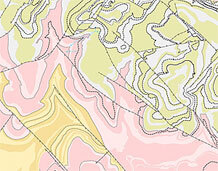
BGS Geology 10K
Detailed digital geological map data based on BGS’s National Grid and County series 1:10 000, 1:10 560 and 1:25 000 scale maps.
BGS Geology 50K
Generalised digital geological map data based on BGS’s New Series 1:50 000 and 1:63 360 scale (one-inch to one-mile) maps with updated nomenclature.
BGS Geology 250K
Generalised digital geological map data based on BGS’s series of 1:250 000-scale maps, reclassified with lithostratigraphic nomenclature.
BGS Geology 625K
Generalised digital geological map data based on BGS’s published poster maps of the UK (north and south).
BGS Geology themes
BGS Geology data is provided as a series of layered themes. Depending on the scale of data chosen, up to five main themes are available.
Artificial ground is the term we use for those areas where the ground surface has been significantly modified by human activity. Artificial ground is a vital component of our understanding of UK geology, which also includes bedrock and superficial deposits, because the near-surface ground conditions are so important to human activities and economic development.
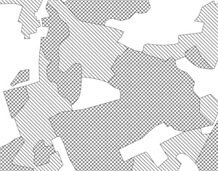
For BGS Geology and related purposes, artificial ground information is placed in a separate theme. It may be regarded, in other uses in the BGS and elsewhere, as part of the superficial geology that includes both artificial and natural deposits. Further information on artificial ground can be found in the BGS Rock Classification Scheme Volume 4.
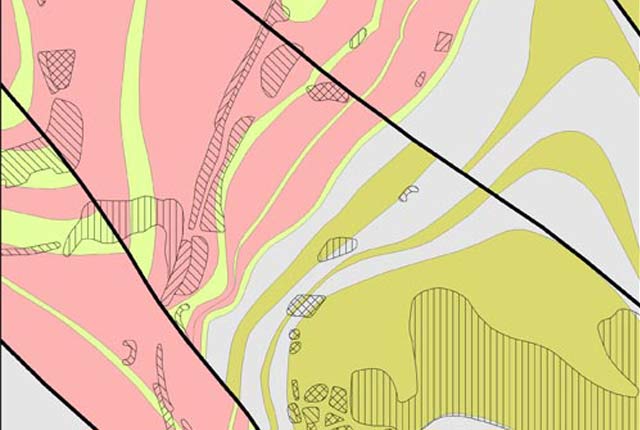
The artificial ground theme includes:
- made ground: artificial deposits, such as embankments and spoil heaps, on the natural ground surface
- worked ground: areas where the ground has been cut away, such as quarries and road cuttings
- infilled ground: areas where the ground has been cut away then wholly or partially backfilled
- landscaped ground: areas where the surface has been reshaped
- disturbed ground: areas of ill-defined shallow or near-surface mineral workings where it is impracticable to map made and worked ground separately
We have not previously mapped artificial ground; it became a common requirement of the applied geological mapping projects in the 1980s and is now routinely recorded, but information is only available for parts of the country. It is classified primarily on its mode of origin, which is usually apparent from the landform or the changes made to the topography.
Infilled ground can also be classified by its composition into types of fill, such as inert waste, ash or slag. This is not usually practicable in routine mapping as many landfills are mixed deposits with inadequate records of their actual content.
Caution must be exercised using the artificial theme, as it may become dated very rapidly. We cannot monitor every pit and landfill site in the country, recording changes from day to day. It is inevitable that many maps of artificial ground will be out of date. Also, many urban areas are built on artificial ground but it is impracticable to unravel the details in routine mapping.
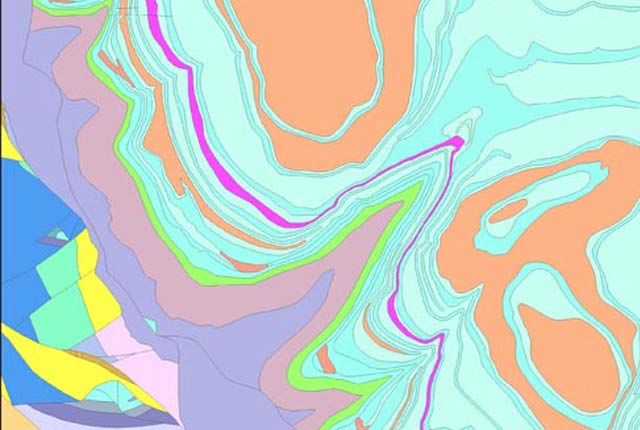
Mass movement deposits on our geological maps are primarily superficial deposits that have moved downslope under gravity to form landslips. These affect bedrock, other superficial deposits and artificial ground. Various landslip types are recognised but they are rarely classified on our maps, apart from specialised maps for applied geology.
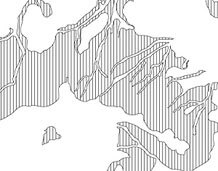
For BGS Geology and related purposes, mass movement information is placed in a separate theme. Here it also includes foundered strata, where the ground has collapsed due to subsidence. In the BGS Rock Classification Scheme Volume 4, though, foundered ground is excluded from the mass movement deposits.
Caution must be exercised using the mass movement theme because of the potential hazard caused by ground instability. We have not always mapped mass movement deposits and they may occur in places where none are mapped. Even on maps where landslips are recorded it is impossible to be sure that all occurrences were found. It is therefore useful to know the location of potential landslip areas, such as those determined in some applied geological mapping projects.
In addition to the mapped landslides, we have used GIS techniques integrating geological and topographical information, to create a natural hazards (BGS GeoSure) dataset, which gives an indication of likely slippage by finding, for example, the incidence of clays on steep slopes. This national dataset covers all of Great Britain. Further information is available on the BGS GeoSure pages.
Superficial deposits (which we used to call ‘drift’) are the youngest geological deposits formed during the most recent period of geological time, the Quaternary, which extends back about 2.6 million years from the present. They rest on older deposits or rocks referred to as bedrock.
For BGS Geology, superficial deposits that are of natural origin and ‘in place’, are held in the superficial deposits theme. Other superficial strata may be held in the mass movement theme where they have been moved, or in the artificial ground theme where they are of human origin. Further information on superficial deposits is found in the BGS Rock Classification Scheme Volume 4.
Superficial deposits were originally recorded only onshore and around the coast where they were laid down by various natural processes such as action by ice, water and wind. More recently, offshore deposits have been mapped and may be held in a separate seabed sediments theme.
Most of these superficial deposits are unconsolidated sediments, such as gravel, sand, silt and clay, and onshore they form relatively thin, often discontinuous patches or larger spreads. Almost all of these deposits were formerly classified on the basis of mode of origin with names such as ‘glacial deposits’, ‘river terrace deposits’ or ‘blown sand’, or on their composition such as ‘peat’. Recently, some of them have been given formal lithostratigraphic names such as ‘Lowestoft Formation’. More information on some units is available in the BGS Lexicon of named rock units.
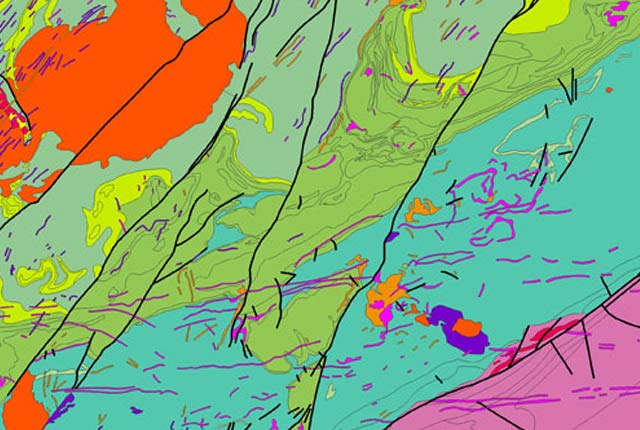
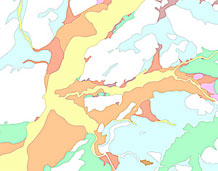
Bedrock geology (which we used to call ‘solid’ geology) is a term used for the main mass of rocks forming the Earth that are present everywhere, whether exposed at the surface in outcrops or concealed beneath superficial deposits or water. The bedrock has formed over vast lengths of geological tim,e ranging from ancient and highly altered rocks of the Proterozoic, some 2500 million years ago or older, up to the relatively young Pliocene, 2.6 million years ago.
For BGS Geology and related purposes all these rocks are placed in a separate bedrock theme of information. Wherever possible, they are referred to by their current name; for stratified units this will usually be of lithostratigraphic type. More information on units is available in the BGS Lexicon of named rock units.
Geological maps usually show all the bedrock strata onshore, apart perhaps from beneath extensive spreads of superficial deposits such as coastal plain alluvium. For BGS Geology 50K, the bedrock has been extrapolated where possible beneath these and out to about the low-water mark around the coast. On some recently published geological maps, bedrock is also mapped offshore on the continental shelf.
The bedrock geology includes many lithologies, often classified into three types based on origin: igneous, metamorphic and sedimentary. These are described in the BGS Rock Classification Scheme Volumes 1–3.
Igneous rocks are derived from molten magma in the Earth’s crust. They may, for example, be extruded at the surface by volcanic activity to form lavas and tuffs (ash) or intruded into other rocks to form large masses of granite and gabbro at depth or minor, cross-cutting basalt dykes near the surface.
Metamorphic rocks such as schist and gneiss are those that have been changed from one rock type to another in the solid state by the recrystallisation of minerals, often at high temperatures and pressures when buried deep in the Earth’s crust.
Sedimentary rocks are formed when grains and fragments of existing rocks are eroded away by ice, water and wind action, transported elsewhere and redeposited as a sediment. These sediments are often laid down in layers or strata of loose particles of gravel, sand, silt and clay. Over time they may be buried by later sediments and consolidated or cemented to form stratified or bedded rocks such as conglomerate, sandstone, siltstone and claystone. Other sedimentary rocks such as ironstone and limestone are created by chemical or biogenic (life) action.
The geological sequence of rocks preserved varies from place to place but packages of strata with similar characteristics may be recognisable over considerable distances. Such study has developed into the science of stratigraphy, of which lithostratigraphy is but one type.
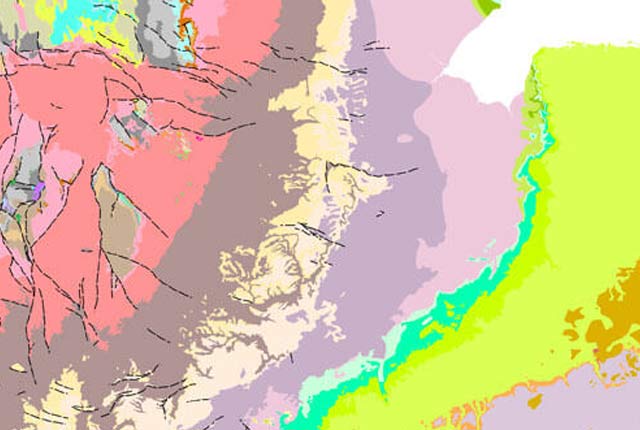
Linear features at the ground surface or bedrock surface (beneath superficial deposits) are digitised and geologically attributed. Their availability in the digital data therefore depends on the detail shown on the printed map. They are organised into six main categories:
- ROCK: e.g. coal seam, gypsum or ironstone bed; marine band
- FAULT: e.g. normal, thrust, reverse
- FOLD AXIS: e.g. anticline, syncline
- MINERAL_VEIN
- ALTERATION_AREA: e.g. limit of dolomitisation
- LANDFORM: e.g. buried channel margin, glacial drainage channel margin
These relate primarily to the bedrock theme, being either an intrinsic part of it (ROCK or MINERAL_VEIN) or affecting it (FAULT, FOLD AXIS or ALTERATION_AREA). LANDFORM may relate to either the bedrock or superficial theme. Most of these linear features are identified as either observed or inferred.
Many of the linear features are attributed generically, for example a ROCK line may be identified as a coal seam or gypsum bed, a marine band or a fossil horizon, for example a mussel bed. However, these rock units can also be identified with LEX_RCS codes in the same way as polygons and carry the same associated information fields. Thus particular coal seams or marine bands may be identified with specific LEX codes such as:
- YCL (Yard Coal, Leicestershire)
- AGMB (Aegiranum Marine Band)
Similarly, other linear features such as faults and mineral veins may also be attributed with more specific information, for example the name of the fault or the composition of the mineral.
Printed paper maps may also show other ‘concealed’ linear features such as faults or coal seams on the ‘sub-Triassic’ surface, i.e. the assumed outcrop of these features (probably identified in coal mines or boreholes) projected on the unconformity below Triassic strata. These underground features are not included in the BGS Geology linear theme in order to minimise the potential confusion they could cause to users if interpreted wrongly as being in overlying bedrock strata at the surface or just beneath superficial deposits.
Frequently asked questions
We have several ways for you to look at the geology beneath you. Our map viewers page is a good place to start, or you could go straight to our BGS Geology Viewer. If it’s a paper map you want to see, we recommend a visit to the BGS maps portal.
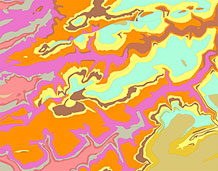
The different colours, patterns and linestyles are to show differences in rock age, rock type or some form of process or characteristic that makes the ground ‘different’ geologically from its surroundings. Many geological units have had traditional colour schemes since the earliest map made by William Smith 200 years ago. The colours and patterns allowed early mappers to show 3D geological complexity on a 2D piece of paper. The advent of digital data means that we can interrogate 2D and 3D data with a mouse click, but we retain the familiar colours and map styles so that users can see how the digital world relates to traditional geological maps.
The ‘modern’ 6-inch and 1:10 000 standard maps (post-1940) were traditionally hand-drawn in monochrome. This was to enable the cheaper monochrome reproduction methods available at the time, i.e. photographs, dye-line (also called ‘whiteprint’) and early photocopying systems, none of which could handle block colours very well — or cheaply, in the case of photography. After making a monochrome map, geologists often made a coloured version just for viewing in our libraries. These colour versions were never supplied to users and sometimes were never made at all. Our digital map systems (from about 1998 onwards) routinely created standard maps that were full colour so we could export and print in colour.
When BGS scanned the map archive in the early 2000s, all maps were scanned, but not all ‘standards’ had a colour copy and not all coloured maps scanned well. Some of the scans were clearer in monochrome and this is the reason why many of our maps are supplied in monochrome (with symbols instead of colours).
Paper maps are available from our online shop. You can also view our catalogue of 6000 digital scans of paper maps in our maps portal.
Data is typically available under licence (i.e. for a fee). However, an increasing amount is available for view or download. Our datasets page can provide details of the different datasets available. Each page will provide information about data coverage, prices, formats and who to contact. Many products also offer sample data downloads and user guides to help you decide if the data is suitable for you.
Yes! Our map viewers page is a good place to start: there are links there that will take you to various apps and online services, or you could go straight to our BGS Geology Viewer. If you want to see more than just geology data, our GeoIndex is an online data and GIS service that covers a very wide range of geoscience research.
If it’s a paper map you want to see, we recommend a visit to the BGS maps portal.
Our mapping is updated by a combination of strategic survey and ad hoc review, normally as part of our wide research activities. These generate a range of new data and corrections across Great Britain and the BGS Geology team have a year-round programme of editing and updating. It can take a while to fully resolve a new area of mapping or reconstructed data, so our map revisions are published periodically — typically every four to six years.
Discrepancies in mapping or descriptions of geological materials across map boundaries are predominantly due to the age of the underlying survey that created the data. Modern surveys can resolve new information from a range of sources not previously available to earlier surveys. In addition, new interpretations for geology can evolve over time, allowing more recent survey campaigns to add extra details or map refinement.
Reducing the occurrence of map-edge issues is an ongoing task, with new data and techniques being applied all the time. However, a geological map is an evolving product so there may always be some discrepancies between parts of the map derived from different survey campaigns or methods.
Traditionally, ‘fault ticks’ (hanging wall identifiers) and dip/strike data have been shown on paper mapping using cartographic symbology.
Our process to capture the paper maps into a digital database were partly successful in transcribing some of the information needed to accurately portray the faults. However, our data quality checking procedures identified that subsequent conversion of these features into alternative spatial data formats could result in the data becoming corrupted. We are trialling a more robust method of handling fault hanging-wall information for future releases but in the meantime this data is withheld.
Similarly, our process to capture cartographic structural data such as dip/strike from paper maps and convert them into an intelligent digital format is ongoing. We are currently working on a new database of structural information (derived directly from our survey-scale activities) and hope to release this data soon.
Our map portal contains scans of all the last-printed 1:50 000 geological sheets, so you can utilise this archive to confirm fault throws and structural data as published on previous paper maps. However, please note that some of these maps will show geology that has now been significantly modified in the BGS Geology 50k dataset (i.e. the digital mapping is more up to date).
It is not unusual for discrepancies to occur between the two different scales of mapping. Traditionally, the main reason for this is the generalisation and simplification of the map face content from the 1:10 000 ‘survey-scale’ original mapping. The generalisation makes the map objects clearer to read at the smaller scale (1:50 000), whilst the simplification of the terminology used to describe the lithologies and ages will ensure that the modified map objects still convey the meaning and context of the original survey observations.
BGS has not always published its 1:10 000 survey-scale original mapping, focusing on the 1:50 000 maps instead. Digitisation of the original 1:10 000 paper mapping is still ongoing and so the 1:10 000-scale digital archive is less complete in coverage compared with the 1:50 000 digital archive. Additionally, any updates to the mapping at either scale can occur at any time, and non-sequentially (i.e. a regional study of geology at 1:50 000 scale may have made changes to mapping that is not yet adopted in the 1:10 000-scale data).
It is important to note that there may also be discrepancies between the paper and digital versions of the maps and the two different scales. This is because both scales of mapping are subject to ongoing correction and generalisation over time. The digital mapping will show the latest interpretation of the geology.
BGS no longer updates the traditional 1:50 000-scale hard-copy (paper) maps of geology. The digital mapping available online represents our latest ‘version’ of geology for Great Britain. This means that the paper maps are now superseded and the online digital map resources are the most appropriate for ground investigation etc. The last geological sheets to be provided in print format were Derby (sheet 125) and the Isle of Wight special sheet (in 2014 and 2015 respectively). All of our map updates since 2011 have been for digital platforms only.
We do still provide hard-copy output for 1:10 000-scale data (where digital may not yet be available) and we provide a print on demand service for users wanting hard-copy from 1:50 000 digital mapping. Most of the legacy paper maps are available as freely viewable scans and many of these maps can still be bought in folded or flat paper formats for users seeking the original mapping in a traditional format. Please note: all maps in this paper archive are now superseded, even the most recent ones.
We recommend that all professional users now refer solely to the data available on our GeoIndex platform as this provides the most comprehensive and up-to-date digital map data. Users are advised to only refer to traditional paper mapping (or the scanned paper map archive in the BGS map portal) for legacy purposes, or to utilise the map marginalia, or to assess how the interpretation of the geology may have changed through time.
In terms of rock descriptions, all of our digital maps use two common referencing systems, or dictionaries: the BGS Lexicon of Named Rock Units for stratigraphy and the BGS Rock Classification Scheme for lithology. These dictionaries describe age and lithology for most units. This system is updated with new data in a digital format only. We no longer support legacy map codes such as f2, f5 etc., but the BGS Lexicon will identify previous names for a unit if its name has changed since 1990 or where legacy nomenclature is still being used as common parlance, e.g. ‘Keuper Marl’.
The BGS Geology Viewer is a handy tool for viewing the main geology dataset at 1:50 000 scale. It is designed for general use by the public.
We recommend that all professional users now refer solely to the data available on our GeoIndex platform as this provides the most comprehensive and up-to-date digital map data, as well as a useful resource of supporting additional materials. Users are advised to only refer to paper mapping (or the scanned paper map archive in the BGS map portal) for legacy purposes, or to utilise the traditional map marginalia. The 1:50 000-scale paper maps are no longer updated by BGS. Many of the 1:10 000-scale (and earlier ‘six-inch’) paper maps are still available, but these too are gradually being replaced by all-digital content.
Having captured most of the 1:50 000 mapping, BGS is gradually capturing the larger-scale 1:10 000 paper map archive (BGS Geology 10k). The next release of BGS Geology 10k (Version 3) will include a total of 4970 sheets. A further 560 sheets are still in progress.
The 1:25 000 survey-scale mapping is only available in some small areas of Wales and Scotland. We expect all the available sheets at this scale to be completed and published soon as part of the BGS Geology 10k (Version 3) release.
We make every effort to ensure that our digital data reflects our best understanding of the geology of the UK and its continental shelf, but sometimes our interpretations need to be revised as new evidence (such as boreholes) are obtained. We are currently working on a web service to improve notifications of errors that have been found and corrected; we hope to make this available soon. If you think you have spotted a problem with our datasets please let us know.
Terms of use
Please see individual BGS Geology product pages for specific terms of relevant to each scale.
You may also be interested in
BGS Geology 10K
Detailed digital geological map data based on BGS’s National Grid and County series 1:10 000, 1:10 560 and 1:25 000 scale maps.
BGS Geology 50K
Generalised digital geological map data based on BGS’s New Series 1:50 000 and 1:63 360 scale (one-inch to one-mile) maps with updated nomenclature.
BGS Geology 250K
Generalised digital geological map data based on BGS’s series of 1:250 000-scale maps, reclassified with lithostratigraphic nomenclature.