In May 2011, BGS scientists joined an international team studying sediments laid down by the tsunami that devastated this area, which was caused by the Great Tohoku earthquake of 11 March 2011. The research will lead to a better understanding of the magnitude of past tsunamis and the frequency with which they occur. Preliminary results were published by the USGS.
A BGS team returned in June 2011 to carry out further research on the sediments and will map the area of tsunami flooding in the Sendai area (Map 1) using high-resolution satellite imagery. This trip was funded by a NERC urgency grant.
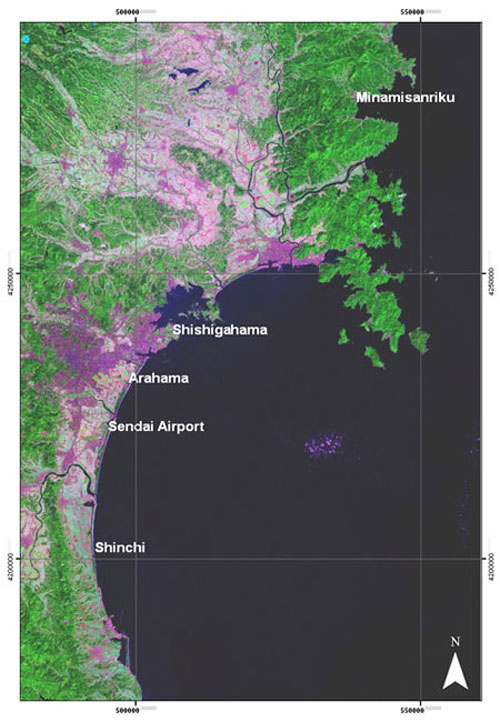

Map 1: Location of survey area on northern Honshu. Landsat false colour satellite image processed by BGS. © BGS/NERC.
Tsunami damage
The magnitude 9 earthquake caused a devastating tsunami along a 500 km length of the eastern shoreline of Honshu Island. At the most recent count, 15 000 people are known to be dead and nearly 8000 more are still missing; 300 000 were made homeless.
The earthquake is one of the largest ever recorded, but caused relatively little damage. It was the tsunami that caused the great loss of life and damage, graphically imaged on the numerous videos released immediately after the event.
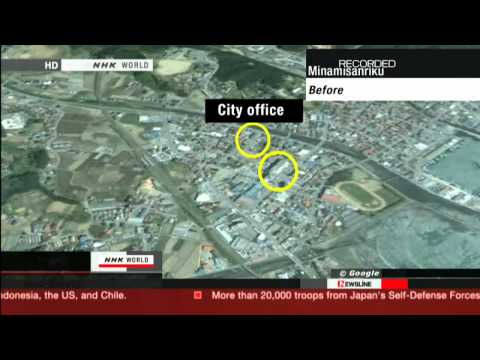

Channel 4 News report showing the town of Minamisanriku before and after the 11 March tsunami event.
Valleys increased waves heights dramatically
In the highland areas of northern Honshu, focusing of the tsunami along narrow coastal valleys led to wave heights of up to 30 m. Towns such as Minamisanriku were almost completely destroyed (Map 1; figures 1 and 2).
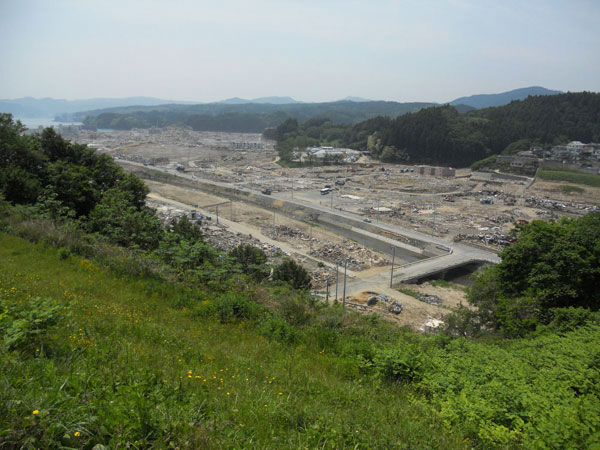
Figure 1: Tsunami devastation of Minamisanriku. © Colm Jordan/BGS.
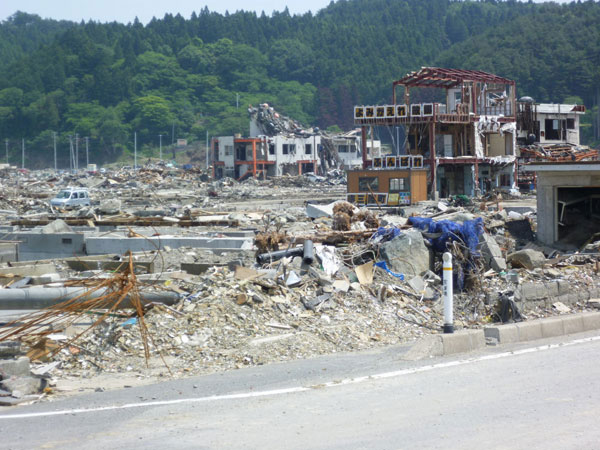
Figure 2: Tsunami devastation of Minamisanriku. © Hannah Evans.
Farther south, on the low-lying plains of Sendai, the tsunami reached heights of 10 m, flooding the agricultural coastal areas where there was large-scale rice cultivation (figures 3 and 4).
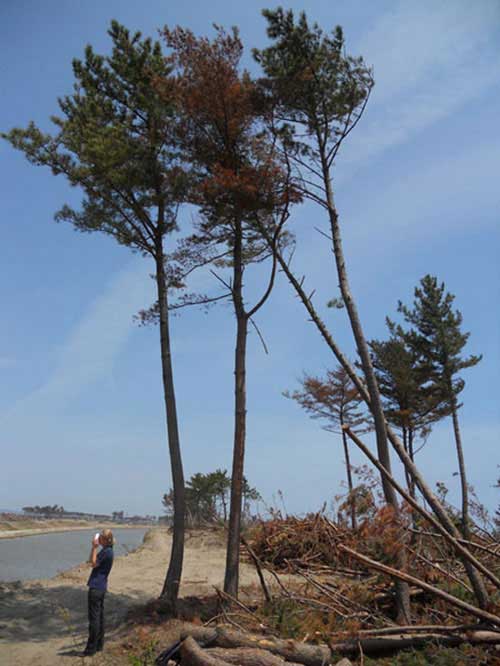
Figure 3: Water flow depths revealed by stripping of tree branches. Figure for scale is approximately 1.8 m high. © Colm Jordan/BGS.
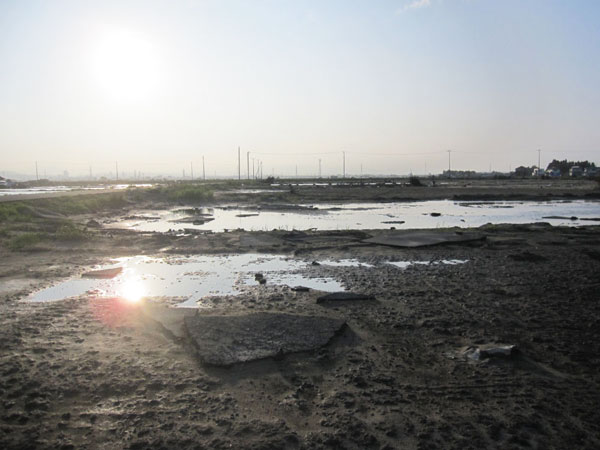
Figure 4: Flooded paddy fields near Arahama. © Dave Tappin.
Aid effort
The immediate response to the tsunami was the humanitarian aid effort, to rescue trapped people and save lives and also to rehouse and feed displaced people whose homes had been destroyed or made uninhabitable (Figure 2).
Studying the impacts of the tsunami
Subsequently, there was a scientific response to investigate the impact of the tsunami and to research the sediments laid down as the tsunami flooded the land.
Mapping of recent tsunami sediments (Figure 5) and characterising their main features, such as grain size, internal structure and inland extent, can be used to identify older deposits in buried sequences, such as the Jōgan tsunami of 869 AD (Figure 6). These sediments are usually very thin, with maximum thicknesses of about 30 cm. The sediment can be traced up to 4.5 km inland from the sea.
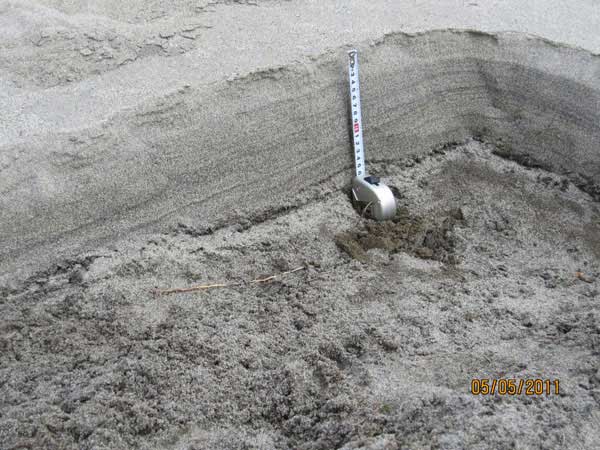
Figure 5: Sand laid down by the 2011 tsunami. © Dave Tappin/BGS.
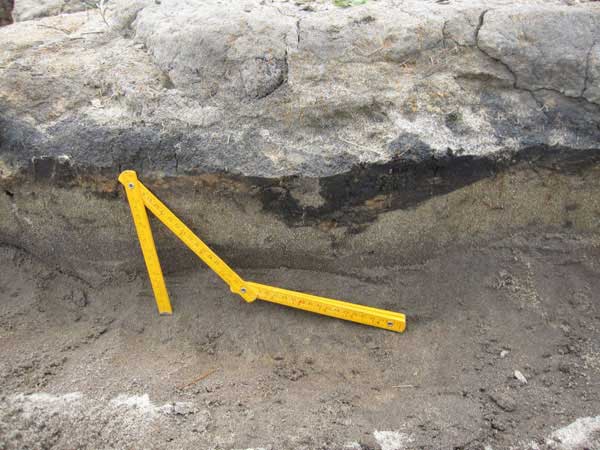
Figure 6: Sand laid down by the 869 AD Jōgan tsunami. Source: © Dave Tappin / BGS
These large earthquakes and tsunamis are very infrequent and the farther back we can go in time, the better idea we have of how often these events may take place. Historical records give an idea of frequency over shorter time scales of decades to centuries; Japan has one of the best records in the world that goes back over 1000 years.
Dating these older sediments gives a better understanding of how frequent tsunamis are. In Japan there are sediments up to 3800 years old. This allows better forward planning on when (and where) tsunamis (and earthquakes) might occur in the future as well as their possible magnitude.
BGS involvement with the International Tsunami Survey Team
In May 2011, BGS’s Dave Tappin collaborated with scientists from Japan, Australia, the United States, Poland and Indonesia as part of the International Tsunami Survey Team (ITST) organised by UNESCO (Figure 7). They worked in the area around Sendai, in Miyage Prefecture, which was one of the most seriously damaged regions (Map 2).
In June 2011, Dave returned to Japan with BGS colleagues Colm Jordan and Hannah Evans, funded by a NERC urgency grant. They again worked in close association with Japanese scientists and worked in the Arahama area and farther southward in Shinchi (Map 3).
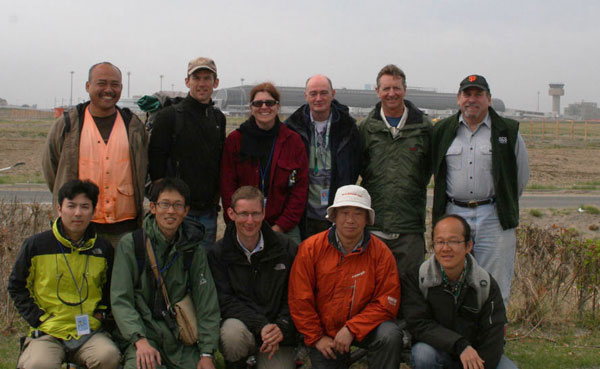
Figure 7: Members of the May 2011 international tsunami survey team near their main survey transect; Sendai Airport is in the background.
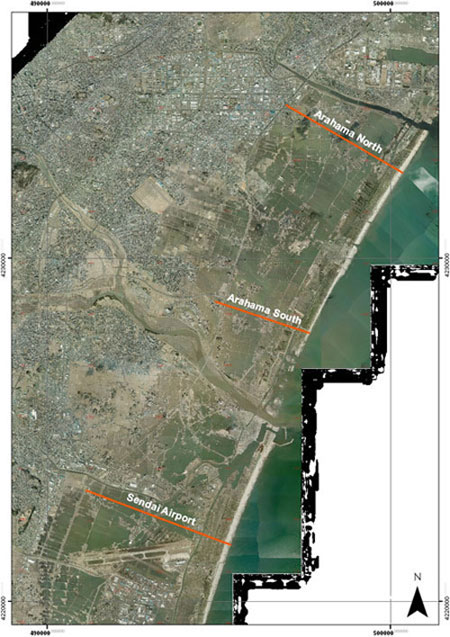
Map 2: Arahama and Sendai Airport field area overlaid on an aerial photomosaic georectified by BGS and provided by the Geospatial Information Authority of Japan within the ‘Agreement on Disaster Emergency’.
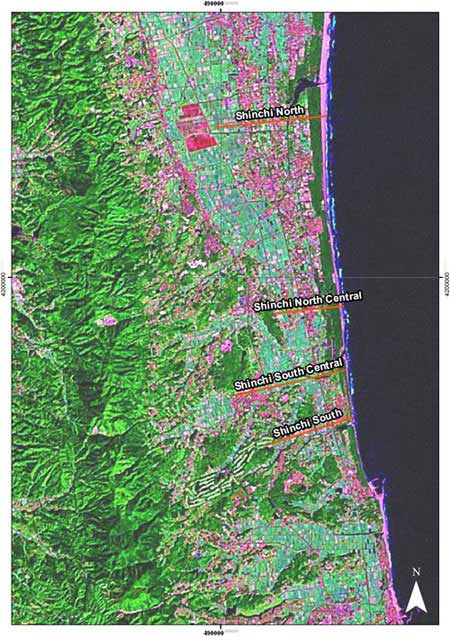
Map 3: Survey lines in the Shinchi area. Landsat false colour satellite image processed by BGS © NERC
Digital mapping
The team used high-resolution satellite imagery from before and after the tsunami, combined with the state-of-the-art digital mapping system (BGS•SIGMAmobile) and traditional field mapping expertise (Figure 8). These methods were used to gain a better understanding of how the tsunami affected the landscape.
Because the work was in response to a major disaster, BGS was granted access to very high resolution satellite imagery from the International Charter for Space and Major Disasters. When the Charter is activated, the satellite-image suppliers provide imagery quickly to help relief efforts.
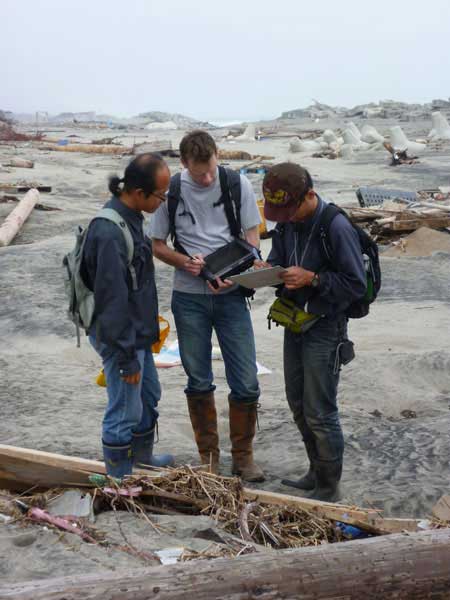
Figure 8: Using the BGS⋅SIGMAmobile mapping computer. Source: © Hannah Evans / BGS
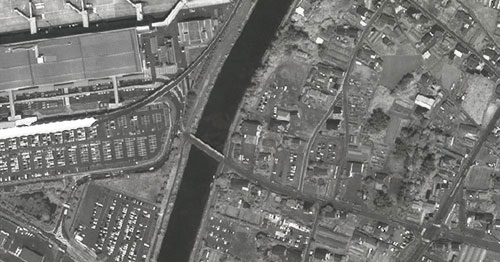
Figure 9: Sendai Airport. The pre-tsunami (black and white) satellite image is from the Ikonos sensor © GeoEye, provided as part of the International Charter on Space and Major Disasters.
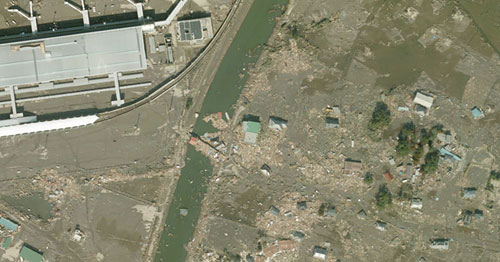
Figure 9: Sendai Airport. The post-tsunami (colour) image is an aerial photomosaic, provided by the Geospatial Information Authority of Japan within the ‘Agreement on Disaster Emergency’.
Earthquake Engineering Field Investigation Team (EEFIT)
Whilst in the field in Japan, the BGS team met with the Earthquake Engineering Field Investigation Team (EEFIT) who were carrying out a survey on the earthquake and tsunami damage in the affected areas (Figure 10). The EEFIT team were shown characteristic sections of sediment laid down by the tsunami in the Arahama Beach area.
Results from the field work are as yet preliminary, but they are promising. They have the potential to improve our ability to discriminate between those high-energy sediments in the geological record that were laid down by tsunami and those laid by storms; a major difficulty at present. They may also help scientists to better understand older earthquake events, both their magnitude and frequency.
BGS team
The BGS Team on the NERC Urgency fieldwork were:
- Prof David Tappin (tsunami specialist)
- Dr Colm Jordan (satellite image and digital mapping expert)
- Ms Hannah Evans (coastal geomorphology expert)
They worked closely with Japanese counterparts, notably Dr Daisuke Sugawara (Tohoku University) and Dr Kazuhisa Goto (Chiba Institute of Technology).
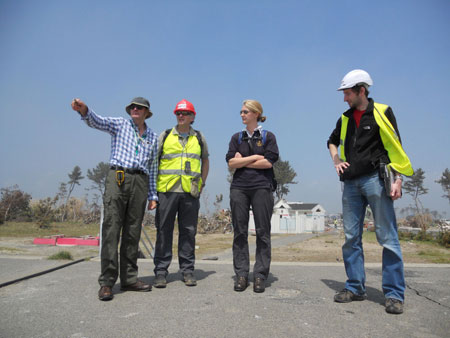
Figure 10: The BGS Team cooperated with EEFIT (Earthquake Engineering Field Investigation Team) to identify the tsunami impacts. © Colm Jordan/BGS.
Personal experience — Colm Jordan
‘It was with mixed feelings that I travelled to Japan. Our team was anxious to help our Japanese friends and scientific colleagues, but we didn’t want to interfere with the rescue and clean-up operations.
Scientifically, this was a unique opportunity to investigate tsunami sediments and to apply new state-of-the-art satellite and digital mapping techniques.
I was in no doubt that we were going to be met with a scene of devastation (the satellite images and photos illustrate some of what we encountered), but the friendly and enthusiastic reception from the Japanese scientists convinced me that we were welcome and that our expertise was valued.
It is difficult to describe the working environment, except to say that sometimes it resembled an apocalyptic landscape with houses, cars, trees and all manner of personal possessions strewn as far as the eye could see.
I was amazed by the clean-up operations already underway; large machinery was being used to pile and sort the debris into vast heaps. Without exception, the Japanese we met were unreservedly friendly and remarkably stoic. Local residents took time from rebuilding their lives to describe to us their memories of the event and the impact that it has had on the families and their livelihood.’
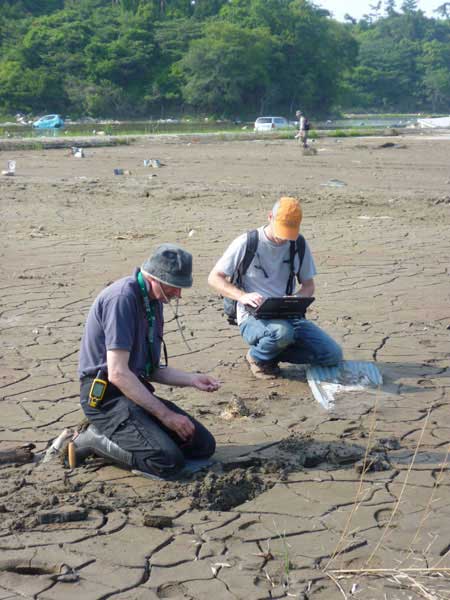
Figure 11: Dave Tappin and Colm Jordan digging holes to analyse tsunami sediments. © Hannah Evans/BGS.
Personal experience — Hannah Evans
‘Although interpreting the satellite imagery prior to fieldwork gave me an idea of what to expect when we arrived in Japan, it couldn’t prepare me for the sheer scale of the devastation when viewed up close.
Not only was a huge swath of the Japanese coast affected but the sheer force of the tsunami waves was demonstrated by the great size of some of the debris left strewn across the area.
We recorded water flow depth indicators which included stripping of branches on trees at approximately 7 m above ground level and debris stranded on three-storey buildings.
When standing next to these features for scale, the great inundation heights achieved by the water became apparent [Figure 4].
Given the degree of the destruction, I was amazed at how much has been achieved by the Japanese authorities in the time elapsed since the tsunami.
Rescue workers had already examined the area, the roads throughout the region were cleared, the power supply was fully functional and the clean-up operation was well underway.
I admire the stoic nature and determined attitude of those affected and the individuals we met were always friendly, welcoming and very informative.
I greatly value the fact that our work, combined with contributions from Japanese and other international scientists, will go on to help inform understanding of tsunamis and ultimately save lives.’
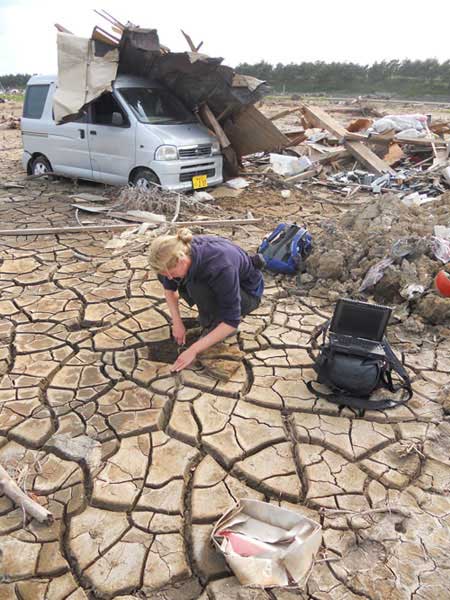
Figure 12: Hannah Evans digging holes to analyse tsunami sediments.
Prof David Tappin
Principal researcher