Developing new seismic hazard maps for the UK
Understanding and quantifying the hazard earthquakes pose to the built environment in the UK.
30/11/2020
Around 200 to 300 earthquakes are detected and located in the UK every year. Most of these are relatively small (with a local magnitude (ML) of less than 3.0) and are not felt by people. Larger earthquakes that are more noticeable happen less frequently – we get around 3 earthquakes between 3.0 and 3.9 ML each year. Earthquakes that may cause minor damage occur less than once a year with events the size of the 2008 Market Rasen earthquake (5.2 ML) happening roughly every 38 years.
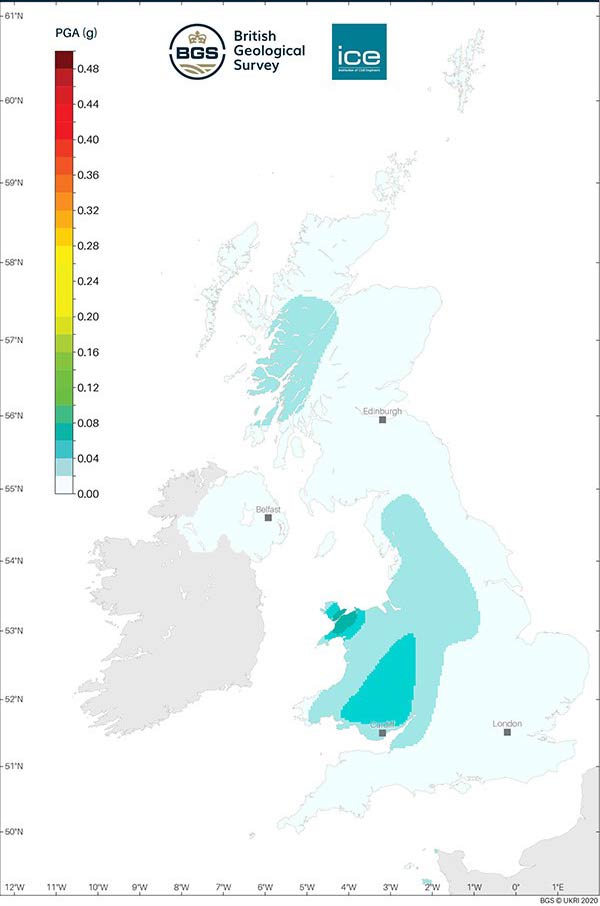

Seismic hazard map: peak ground acceleration (PGA) on rock for a 475 year return period. BGS © UKRI.
Historical observations dating back several centuries confirm that damaging earthquakes in the UK are relatively rare but that they do occur. For this reason, it is important to understand and quantify the hazard they pose to the built environment. The last hazard maps for the UK were published in 2007. Over the last couple of years, a small team at BGS have been working on revising these using larger data sets and some new tools and methods in order to update the advice given to engineers about designing structures for earthquake resistance in the UK.
Seismic hazard is computed using a model that consists of two parts: one that characterises earthquake occurrence (where they occur and their frequency of occurrence, sometimes referred to as the seismic source characterisation model) and another that describes the ground shaking that may result from potential future earthquakes (the ground motion characterisation component). The model is based on historical and instrumental observations of earthquakes and their effects, and information and data relating to the tectonics and geological structure of the region being considered.
The modelling must also try to capture the uncertainty relating to both the natural randomness of the earthquake process (the aleatory variability) and to limited data and knowledge about different aspects of earthquakes and their effects (the epistemic uncertainty). This is a particular challenge in low seismicity regions like the UK where we only have limited data from the larger earthquakes that may be of engineering significance. This includes instrumental recordings of the ground shaking caused by such earthquakes (often referred to as strong motion data). Although the BGS seismic network is now well-equipped to record such data, these earthquakes just don’t happen very often so our dataset is relatively small.

An example of some of the damage caused by the 2007 earthquake in Folkestone. BGS © UKRI.
While earthquake activity in the UK is generally understood to result from the reactivation of pre-existing faults by present-day deformation, the observed distribution of seismicity is not clearly understood yet. The duration of the earthquake catalogue is relatively short (a few hundreds of years) compared to the timescale over which seismotectonic processes are happening so only tells part of the story and may not contain a record of the largest earthquake that could occur. Furthermore, no earthquake in the UK in either the historical (pre-1970) or instrumental (1970-present) periods has ever produced unambiguous evidence of surface rupture. When an earthquake does occur, typical fault rupture dimensions (the area of the fault that breaks) for the largest recorded British earthquakes are around 1-2 km. Compare this with the rupture associated with the largest global earthquakes that can be hundreds of kilometres long. As a result, it is difficult to associate earthquakes with specific faults, particularly at depth, where the distribution and orientation of these structures is unclear. Conversely, many of the earthquakes we observe might actually be associated with unmapped faults whose size and orientation are so far unknown.
The model used to compute the hazard must therefore try to account for the fact that although we know some things, there is a lot that we do not know and that there is a great deal more to be understood through further observation and research.
The new seismic hazard maps are given for three ground motion measures, which are used by engineers: peak ground acceleration (PGA) and spectral acceleration (SA) at 0.2 s and 1.0 s (assuming five per cent damping). PGA tells us about the acceleration of the ground as a result of an earthquake while SA gives an approximation of what might be experienced by a building. You can find a detailed explanation of PGA, SA and damping here.
The maps have been computed for four return periods: 95, 475, 1100 and 2475 years. These return periods correspond to probabilities of approximately 41 per cent, 10 per cent, 5 per cent and 2 per cent, respectively, of exceeding a particular level of ground motion in a 50-year period (the assumed typical service life for a building). For example, for a return period of 475 years, the PGA hazard for the Brecon Beacons in south Wales is between 0.04 g and 0.06 g. In any one year, this means that there is a 0.002 per cent probability (this is just the reciprocal of 475 years) of a PGA higher than 0.04 g to 0.06 g happening. This can also be described as there being a 10 per cent chance of a particular location experiencing a PGA higher than 0.04 g to 0.06 g in any 50-year time period. The important thing to remember is the longer the return period, the lower the probability of the PGA or SA on the maps occurring.
The geological conditions in a particular location will influence ground shaking from an earthquake. Generally speaking, softer materials like alluvial deposits may amplify ground shaking with respect to harder materials like sandstone or granite. In the seismic hazard computations for the new maps, we have assumed that at every point, there are rock conditions. This is a significant but necessary simplification for the modelling but engineers can make adjustments if needed.
The maps confirm that seismic hazard is generally low in the UK but that the hazard is slightly higher in areas like Wales and north central England. This largely reflects the higher rates of historical earthquake activity in these regions. While seismic hazard in the UK is low in global terms and may not require seismic design to be integrated into the design of every structure, maps like these can help engineers to determine what the general level of hazard is and decide whether they need to undertake further work to inform the design of a structure.
You can read the full report, download the maps and the data used to make them on the BGS Earthquakes website.
This work has been undertaken with support from the Institution of Civil Engineers Research and Development Enabling Fund, other seismologists and engineers based in the UK, and oversight from the British Standard Institution (BSI) sub-committee B/525/8 for Eurocode 8 (EC8): Earthquake resistant design of structures.
About the author

Dr Susanne Sargeant
Disaster and development geoscientist
Relative topics
Related news
From archive to discovery: historical mineral reports support gold exploration in Scotland
25/06/2026
Digitised geological records show potential to unlock untapped mineral resources in Ardlochan, Argyllshire.
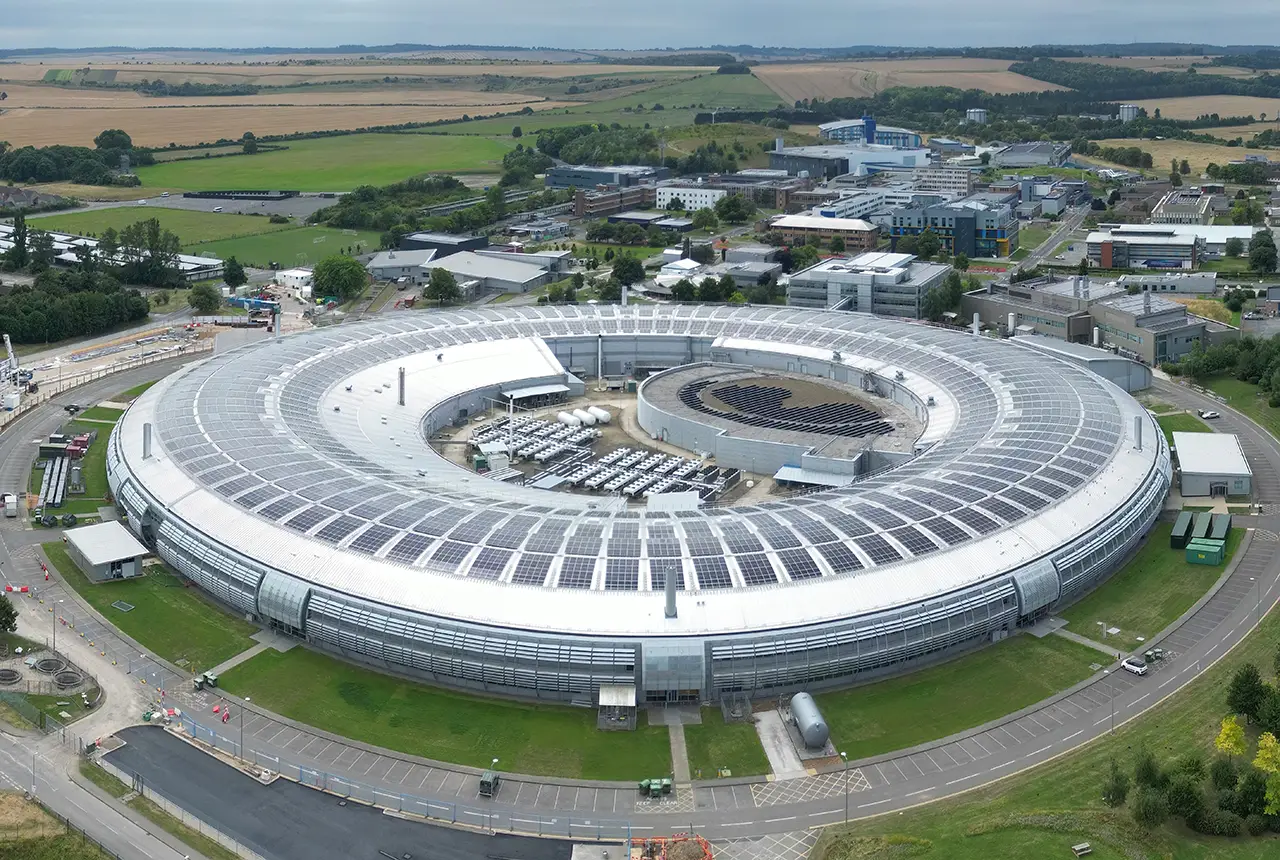
UK and Philippines scientists investigate natural hydrogen generation processes at atomic scale
22/06/2026
BGS researchers were granted access to use the Diamond Light Source facility in order to study hydrogen in light brighter than the sun.

Shortage of end-of-life materials presents challenge to UK critical minerals security
17/06/2026
A new report by the UK Critical Minerals Intelligence Centre reveals insufficient end-of-life material stocks present a supply risk over the coming decade, but offer significant long-term potential to meet critical mineral demand through recycling.
UK geothermal catalogue receives update
16/06/2026
BGS releases the second digital version of the UK geothermal catalogue of subsurface temperature and rock thermal conductivity measurements and heat flow calculations.

Scientists make new discovery in the history of the Giant’s Causeway
15/06/2026
New research is changing our scientific understanding of the formation of one of the UK’s most iconic landmarks and has revealed that Northern Ireland’s volcanic past occurred over a much shorter period than previously thought.

Latest research emphasises climate-related subsidence risk to millions of British homes
11/06/2026
New data from BGS highlights the projected future impact of warmer, drier summers and underlines the need for mitigation measures in susceptible regions.

Ukraine and the UK strengthen their commitment to geological cooperation
10/06/2026
A new Memorandum of Understanding reaffirms the UK’s support of Ukraine’s ambitions to develop its critical mineral resources, paving the way for collaboration through capacity-building programmes.
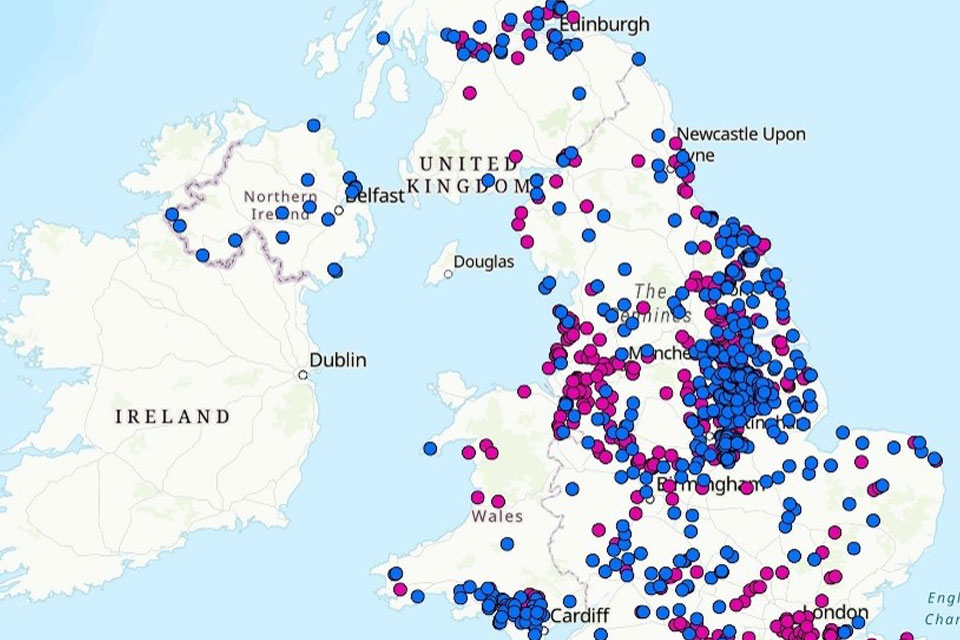
Newly released core could hold clues on potential mineral prospectivity in Perthshire
05/06/2026
A comprehensive collection of geological samples from the vicinity of a former mine in Scotland is now available to scientists for further research.
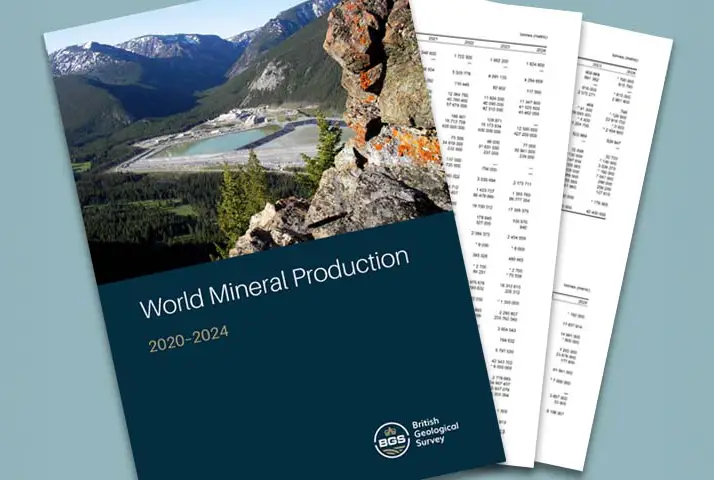
Latest data on world mineral production now available
25/05/2026
BGS has released the updated statistics on the global production of over 70 commodities between 2020 and 2024.

International science consortium to survey the health, economic value and social importance of Lake Victoria
22/05/2026
The project will replicate the 1927 survey to assess changes in the lake’s health, economic value and social importance.

New geological maps of Berwick-upon-Tweed to help future-proof natural water supply
20/05/2026
Scientists have mapped the geology under the town to better understand the groundwater system to inform decisions around abstraction.

BGS contributes to UN sand and sustainability report
19/05/2026
The new report highlights the impact of poor governance and unsustainable sand mining practices, calling on policymakers to take action.