This a new, seamless, onshore–offshore digital geological map for part of one of the most famous coastlines in the world — the Jurassic Coast in Dorset, a UNESCO World Heritage Site.
The map (Figure 1) is a demonstration output for the Marine Environmental Mapping Programme (MAREMAP), which links together marine environmental research, mapping and modelling activities across NERC/UKRI and related organisations.
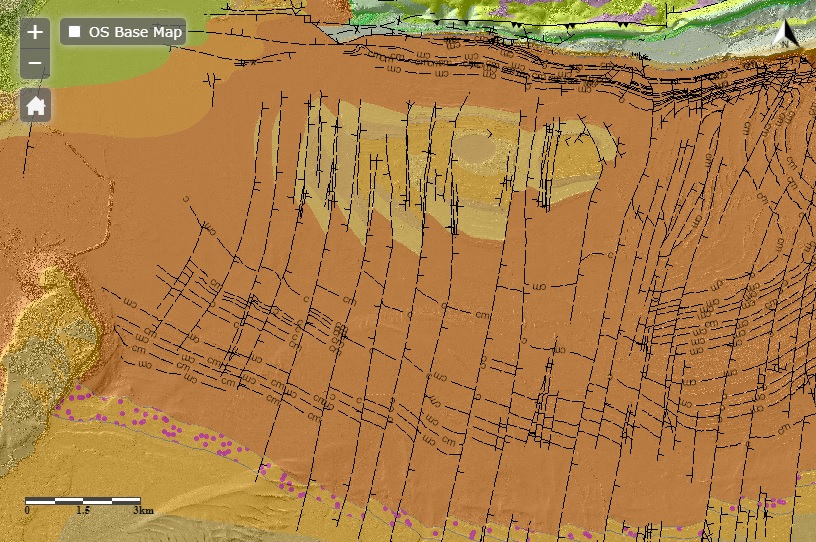

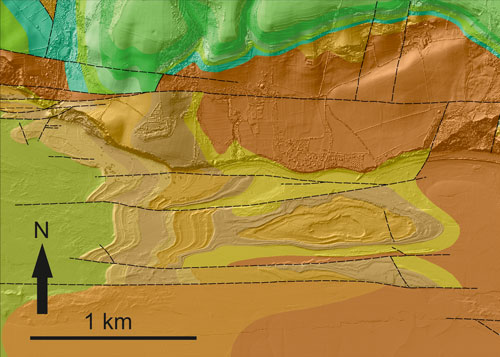
Figure 1: the interactive map viewer showing the bedrock mapping (BGS Fine-Scale Maps) (Westhead et al., 2017) overlain on the hill-shaded elevation surface. See Figure 2 for location in UK. Contains Maritime and Coastguard Agency (MCA) data © Crown Copyright [2021]. BGS © UKRI.
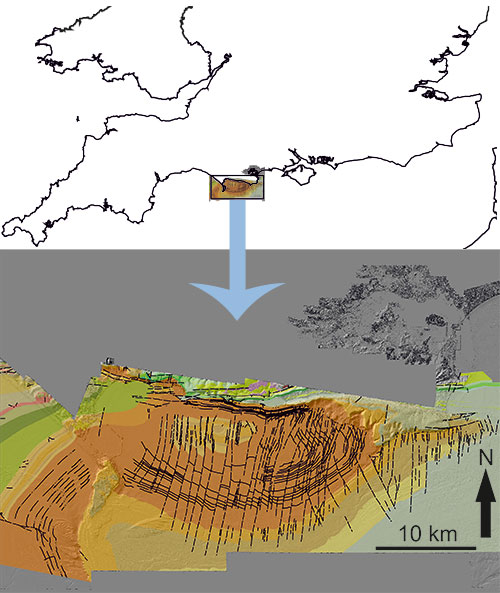
Figure 2: seamless bedrock map for the Dorset Coast and the map’s location in the UK. Contains Maritime and Coastguard Agency (MCA) data © Crown Copyright [2021]. BGS © UKRI.
Open the Offshore GeoIndex map viewer
The Jurassic Coast
The geographical position of the southern UK coastline (as with all coastlines) is ephemeral, particularly in relation to the age of the Jurassic and Cretaceous bedrock forming this part of Dorset, which ranges from 65 to more than 150 million years old. The variations in the strength and structure of the bedrock exert the strongest control on the geomorphology of this intricate coastline.
The famous geological structures exposed in the cliffs on the Jurassic Coast, such as the Lulworth Crumple at Stair Hole (Figure 3), have their origins in the Alpine orogeny (mountain building event), which occurred mainly between 65 and 2.5 million years ago. Our new, seamless map reveals new information about how these structures extend offshore.
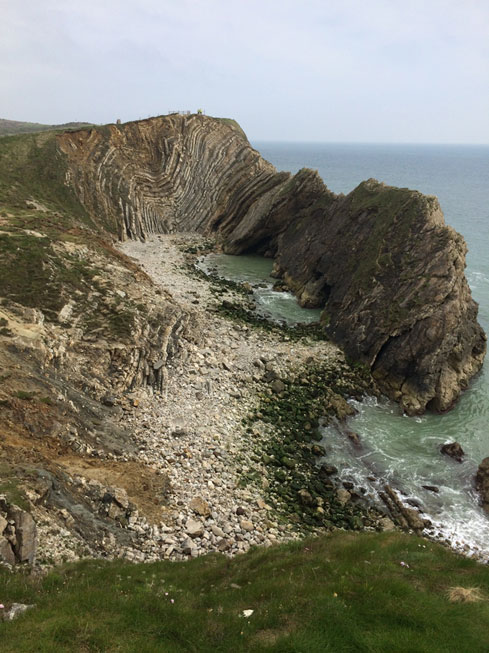
Figure 3: the Lulworth Crumple fold at Stair Hole, near Lulworth Cove, Dorset. BGS © UKRI.
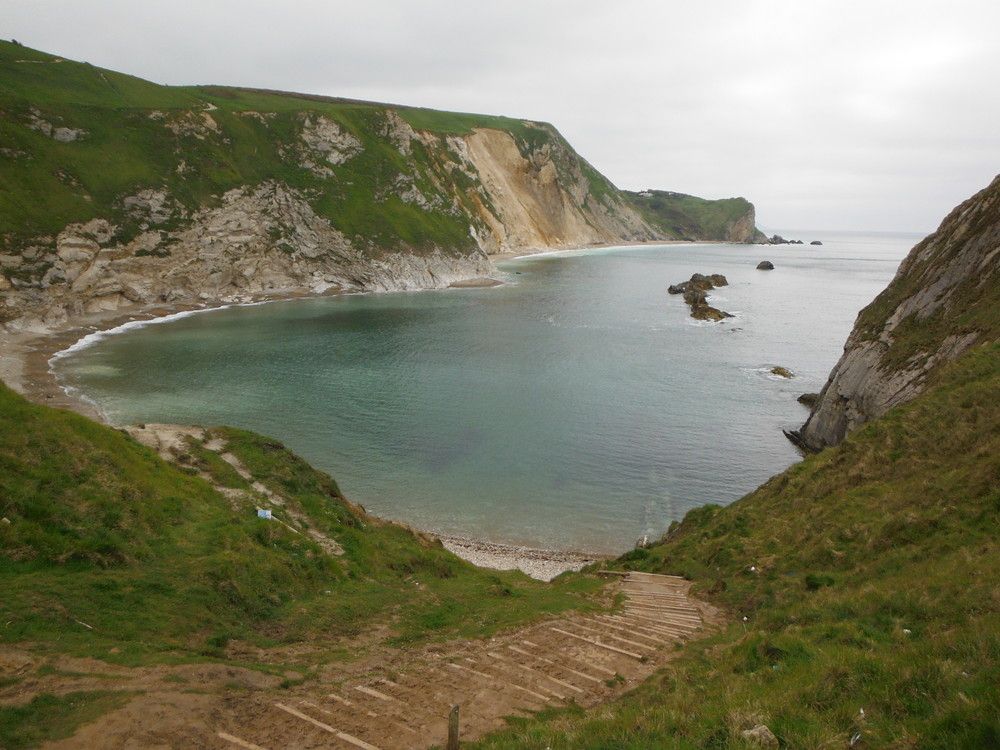
Figure 4: Man o’ War Cove and St Oswald’s Bay, west of Lulworth, Dorset. BGS © UKRI.
Sea level rise of over 120 m followed the end of the last ice age (from around 20 000 years ago), occurring from the late Pleistocene and through the most recent period of geological time, the Holocene. This brought the coastline to its present position and drowned an extensive offshore landscape. Continued coastal changes, including major landslips, provide clues on how the coast will evolve into the future. Increased understanding of bedrock structure in the cliffs and nearshore provided by the new mapping will also help predict the coastal evolution.
Coastal geological mapping
The BGS and our partners are busy applying this new approach to seamless, onshore–offshore geological mapping to other parts of the UK coast, helped increasingly by a richness of emerging surveying data, including aerial Lidar and near-shore, shallow-water, bathymetric surveying. This new Jurassic Coast map is provided as an exemplar of this new style of coastal geological mapping.
The geological map was produced as part of a joint MAREMAP project involving the BGS and Justin Dix and David Sanderson of the University of Southampton. The methodology is described in detail in an accompanying peer-reviewed paper (Sanderson et al., 2017).
The underlying topographical surface for the new map is a composite of offshore seabed multibeam data collected as part of the DORIS project, and onshore aerial Lidar data collected as part of the National Network of Regional Coastal Monitoring Programmes, coordinated by the Channel Coastal Observatory (CCO). These were stitched together to form a seamless elevation surface across the coastal zone, fully revealing its geomorphological and geological detail.
The offshore mapping has been joined seamlessly to the existing onshore 1:10 000-scale BGS digital geological bedrock map (BGS Geology 10k), which itself was updated by BGS surveying in the 1990s. The map viewer shows a strip of this onshore mapping coinciding with the strip of aerial Lidar coverage. The join between the onshore and offshore mapping was carried out using a combination of ‘virtual’ fieldwork, using the BGS-Virtalis GeoVisionary 3D visualisation software, and field and desktop mapping using the BGS·SIGMA digital mapping software.
The offshore mapping is accurate to the same 1:10 000 scale as the onshore mapping and provides unprecedented detail on the geological structures extending across Weymouth Bay, around the Isle of Portland to the west and the eastern end of the Isle of Purbeck.
The map shows the bedrock geology underlying the Dorset coastline. The oldest bedrock unit shown on the map is the Frome Clay Formation of Middle Jurassic age (around 168 million years (Ma)). The youngest unit outcropping in the coastal cliffs is the Chalk Group of Late Cretaceous age (around 66 Ma). Just inland to the north, the youngest rocks shown on the map are within the Bracklesham Group of Eocene age (around 40 to 50 Ma).
The most striking feature revealed by the map is the broad anticlinal structure shown by the sweeping outcrop of the Portland Group and Purbeck Group units, which trend across the south of Weymouth Bay from the Isle of Portland to St Alban’s Head and then turn to trend towards the west along the coastline past Lulworth. This structure is cored by the Corallian Group and Kimmeridge Clay Formation, which are affected by many north–south-trending normal faults picked out clearly by the geological layering on the sea bed.
The complex fold and fault structures formed within the east–west-trending Abbotsbury–Ridgeway–Purbeck fault zone can be seen trending parallel to the coast from Weymouth eastwards to Worbarrow Bay. This structural trend is continued across the Isle of Purbeck to the north of Swanage by the narrow ridge formed by steeply northward-dipping Chalk in the Purbeck Monocline.
This seamless coastal mapping is particularly useful for picking out the complexity of the Abbotsbury–Ridgeway–Purbeck structures in the famous coastal stretch around Lulworth Cove. These include spectacularly folded and faulted Corallian Group rocks in the nearshore at Ringstead (Figure 5) and complex structures in the seabed to the west and east of Durdle Door. The map completes the geological picture for the Lulworth Cove area by fully revealing the bedrock outcrops seamlessly across the coastline.
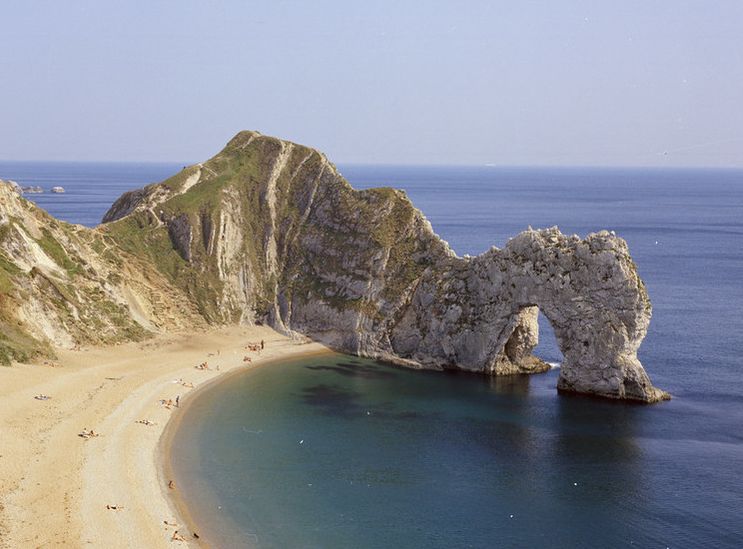
The structure of the bedrock also exerts a strong control on coastal geomorphology, most clearly seen in the central Isle of Purbeck where steeply dipping (or even vertical) Portland and Purbeck group limestones run parallel to the coast. The limestones form a strong barrier that has been breached in places to form famous coastal features such as the arch at Durdle Door (Figure 6) and Lulworth Cove.
Knowledge of the geology of the coast is traditionally much more detailed over its onshore component, mainly because of easier accessibility and greater data availability. It is also often not appreciated that large areas of the continental shelves are actually sediment starved and consequently thousands of square kilometres of seabed are actually exposed bedrock. On the UK shelf this is particularly true of the English Channel and Bristol Channel regions.
In the latter half of the 20th century the BGS undertook concerted geological mapping of the offshore zone (water depths greater than approximately 20 m) primarily through seabed sampling and high-resolution seismic data.
Since the turn of the 21st century, this data has been supplemented by synthesised bathymetric datasets collated by the UK Hydrographic Office and collected either through the Maritime and Coastal Agency‘s UK Civil Hydrography Programme (CHP) or the Royal Navy. Since 2004, all data acquired as part of the CHP has been collected to a consistent high standard (IHO Order 1a) with approximately 35 per cent of all UK waters having been surveyed to ‘modern standards’.
The high-resolution data (grids from 1 × 1 m and coarser) from the MCA (and some naval data) are now freely downloadable from the ADMIRALTY Marine Data Portal, which incudes the National Data Archive Centre for bathymetric surveys.
By comparison, the shallow waters (less than approximately 20 m depth) close to the coastline (known as the ‘shoreface’) have traditionally been less comprehensively mapped because of the difficulty in access. Over the years this has led to a gap in the data around the coastline known as the ‘white ribbon’ by geologists, reflecting the uncoloured strip sometimes seen on older geological maps. However, recent years have seen a revolution in data collection in the white ribbon zone, enabled by a new generation of shallow-water research vessels equipped with swath bathymetry systems. The Dorset DORIS dataset, for example, was collected by FugroOSAE vessel Jetstream equipped with a Kongsberg EM710.
Elsewhere in the UK, a range of similar vessels are busy collecting data for coastal engineering, nature conservation and geological mapping. The National Network of Regional Coastal Monitoring Programmes of England, coordinated by the CCO, has a long-term plan to survey the near-shore coastal area with swath bathymetry, extending from mean low water to approximately 1 km offshore. To date, in conjunction with the CHP, 40 per cent of the English white ribbon has been surveyed to IHO Order 1a, with the data being made publicly available from the CCO and the ADMIRALTY Marine Data Portal and National Data Archive Centre for bathymetric surveys.
Similarly, as part of the implementation of the Marine and Coastal Access Act (2009) a network of potential marine conservation zones has been surveyed throughout English waters (with similar schemes being undertaken in Scotland and Wales), many of which include data from the white ribbon zone. This work was coordinated by the Marine Protected Areas Group, chaired by Cefas. Ultimately, the data will be made publicly available through the Marine Environmental Data and Information Network (MEDIN).
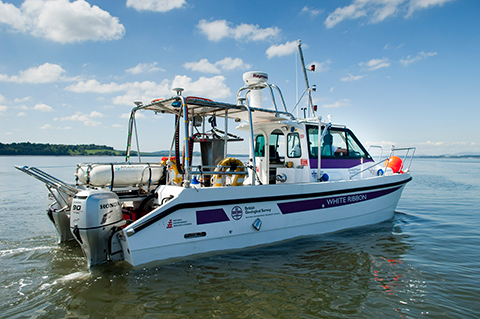
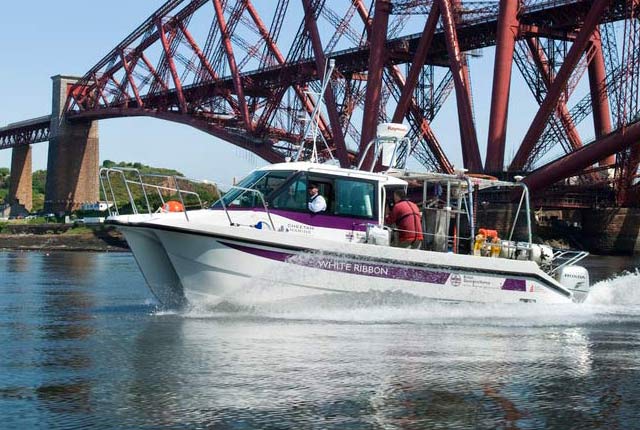
Finally, the BGS operates its own research vessel, the White Ribbon (named after the coastal geological gap described above) shown in Figure 7. Data collected from the White Ribbon also includes high-resolution multibeam bathymetry and backscatter (showing the form and make-up of the seabed), seabed sampling and subsurface geophysics. In many places, as in Dorset, such bathymetric data joins with onshore aerial Lidar information to provide a seamless elevation surface that can be used to make geological and other maps.
Such approaches mean we are at the start of a revolution in the classification of the whole coastal zone, seamlessly from the onshore through the near-shore to the offshore. The map presented here is just one example of what could be produced, which could underpin a much better future understanding of the physical and environmental resilience of our coast.
Sanderson, D J, Dix, J K, Westhead, R K, and Collier, J S. 2017. Bathymetric mapping of the coastal and offshore geology and structure of the Jurassic coast, Weymouth Bay, UK. Journal of the Geological Society of London, Vol. . DOI: https://doi.org/10.1144/jgs2016-070
Westhead, R K, Sanderson, D J, and Dix, J K. 2017. Bedrock map for the offshore Weymouth Bay area, with seamless coastal joint to BGS onshore (BGS Geology 10k) mapping. (Marine Environmental Mapping Programme, MAREMAP).
This digital map was based in part on data from DORIS (DORset Integrated Seabed survey), a collaborative project involving:
- Dorset Wildlife Trust
- Maritime and Coastguard Agency (MCA)
- Channel Coastal Observatory (CCO)
- Royal Navy
Major funding came from Viridor Credits environmental company.
Other partners included:
- Natural England
- Dorset Strategic Partnership
- University of Southampton
- National Oceanography Centre
You may also be interested in
Sea floor: marine geoscience
Providing independent and expert geological advice, research and data acquisition to anyone working in the marine environment.