BGS Geophysical Tomography (GTom) specialises in many innovative technologies with in the field of geophysical and geotechnical monitoring. We have created world-leading 4D electrical resistivity tomography monitoring equipment in PRIME, which works well with complementary remote sensor technologies such as wireless sensor networks and ALARMS.
We have also developed the novel, non-contact electrical imaging technology of capacitive resistivity imaging (CRI), which excels in studying highly resistive materials, and have a breadth of experience in cross-borehole imaging, induced potential and self-potential tomography.
Quick links
- PRIME — PRoactive Infrastructure Monitoring and Evaluation
- CRI — capacitive resistivity imaging
- ALERT — Automated time-Lapse Electrical Resistivity Tomography
- Geoelectrical imaging
- Wireless sensor networks
- ALARMS — Assessment of Landslides using Acoustic Real-time Monitoring Systems
PRIME — PRoactive Infrastructure Monitoring and Evaluation
PRIME is a low-cost, low-power, geophysical imaging instrument designed to monitor infrastructure, geohazards, and hydrogeological processes. It provides remote operation through innovative data telemetry, web portal access and intelligent monitoring.


Figure 1: close up of PRIME hardware.
Applications include:
- remote monitoring of infrastructure, for example dams, railway and highway embankments and cuttings
- physical hazards such as landslides and developing cavities/karsts
- waste management and contaminated land remediation
- understanding extreme events and their effects, including flooding, drought, and saltwater intrusion
More information can be found on our dedicated PRIME page, or our research highlight page BGS PRIME: An early warning system for slope failure.
CRI — capacitive resistivity imaging
New technology has been developed by the GTom team for imaging beneath engineered surfaces in the built environment as well as on dry or frozen ground. The team have also developed the novel use non-destructive evaluation of electrically insulating materials using CRI.
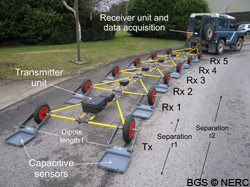
Figure 2: CRI Mark II prototype.
Unlike electrical resistivity tomography (ERT), non-contacting capacitive electrodes permit continuous towed data acquisition on highly resistive engineered surfaces in the built environment (e.g. roads; pavement) where invasive DC coupling is both difficult and undesirable. A real-time, kinematic global positioning system provides accurate navigation and location recovery.
This BGS-designed technology (Figure 2) has significant potential for commercialisation. To protect this innovation, a NERC patent application was filed with the US Patent Office. This has now been granted (Patent No. US 7,492,168 B2).
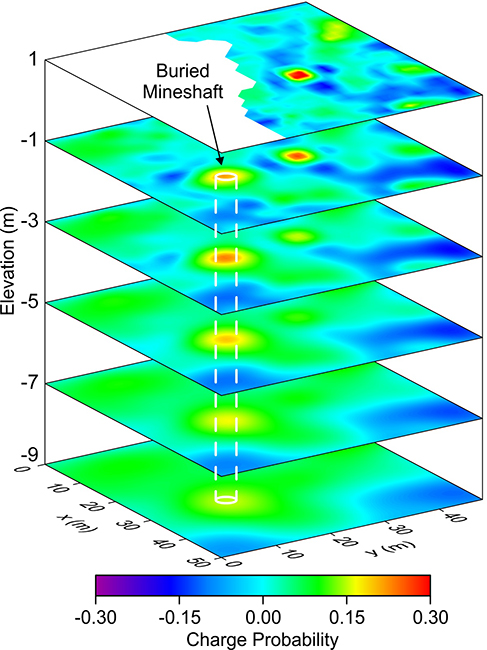
The CRI system has been used successfully to detect abandoned mine shafts (Figure 3) but the technology has great potential for the rapid mapping of soils, superficial deposits and permafrost as well as the non-destructive evaluation of roads, engineered structures and electrically insulating materials. High-density resistivity scans can now be obtained with centimetric resolution. We are continuing to prove the application of this technology through use in a range of case studies.
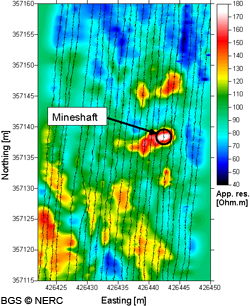
Figure 3: CRI image of a mine shaft.
Kuras, O, Beamish, D, Meldrum, P I, and Ogilvy, R D. 2006. Fundamentals of the capacitive resistivity technique. Geophysics, Vol. 71(3), G135–G152.
Kuras, O, Meldrum, P I, Beamish, D, Ogilvy, R D, and Lala, D. 2007. Capacitive resistivity imaging with towed arrays. Journal of Environmental and Engineering Geophysics, Vol. 12(3), 267–279.
Murton, J B, Kuras, O, Krautblatter, M, Cane, T, Tschofen, D, Uhlemann, S, Schober, S, and Watson, P. 2016. Monitoring rock freezing and thawing by novel geoelectrical and acoustic techniques. Journal of Geophysical Research: Earth Surface, Vol. 121(12), 2309–2332.
ALERT — Automated time-Lapse Electrical Resistivity Tomography
ALERT is a 4D electrical imaging system designed by the BGS to monitor temporal and spatial changes in subsurface electrical properties. Such changes may be related to changes in fluid flow, hydrochemistry or saturation levels.
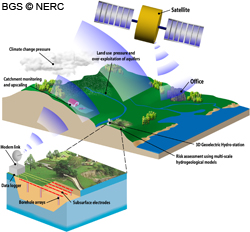
Figure 4: ALERT uses permanent, in situ electrode arrays and intelligent instrumentation to remotely capture volumetric images using wireless telemetry.
ALERT uses permanent, in situ electrode arrays and intelligent instrumentation to remotely capture volumetric images using wireless telemetry (GSM, GPRS, WiFi or satellite telecommunications) (Figure 4).
Sites may be interrogated ‘on demand’ from office-based PCs, thereby avoiding the need for expensive repeat surveys and manual intervention. This development has involved the design of a new instrument, a customised relational database to handle the unprecedented data streams, finite-element numerical modelling and novel time-lapse image reconstruction algorithms.
ALERT is the precursor to our new PRIME technology, which is designed to operate at a lower power and to be a more affordable solution to monitoring applications.
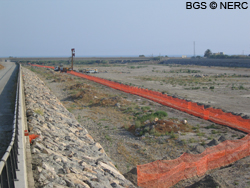
Figure 5: an ALERT system installed in the bed of the River Andarax, Almería, Spain.
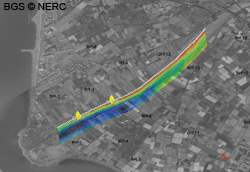
Figure 6: the ALERT system generates a daily time-lapse image.
Geoelectrical imaging
The GTom team has a wealth of experience in many geoelectrical techniques, including electrical resistivity tomography (ERT), induced polarisation (IP) and self-potential (SP) tomography.
The basic geoelectrical resistivity measurement involves using four electrodes, typically metal stakes or pins, inserted into the surface making good electrical contact. An electrical current, I, is passed through the ground between two of the electrodes. As a result of this, an electrical potential difference, V, is measured between the other two electrodes. The voltage depends on the strength of the current, the positions of the electrodes and the electrical resistivity of the ground (which quantifies how easy or difficult it is for current to flow).
If the resistivity beneath the surface is uniform throughout, the current flow lines (shown by blue arrows in Animation 1) resemble the well-known dipolar magnetic field around a bar magnet, but if objects of different resistivities are present, these will distort the current flow and change the measured voltage. Current will tend to flow around more resistive regions, like air-filled voids (red sphere), and flow into more conductive regions, like water-filled voids (blue sphere), either increasing or reducing the potential difference.

To produce an image of the ground electrical resistivity structure, many four-electrode measurements are made at different locations and with different distances between the electrodes (Animation 2). Most of the current flows in the vicinity of the electrodes, so measuring at different locations allows information about the resistivity at different positions to be collected. By increasing the distance between the electrodes, the current tends to flow deeper into the ground.
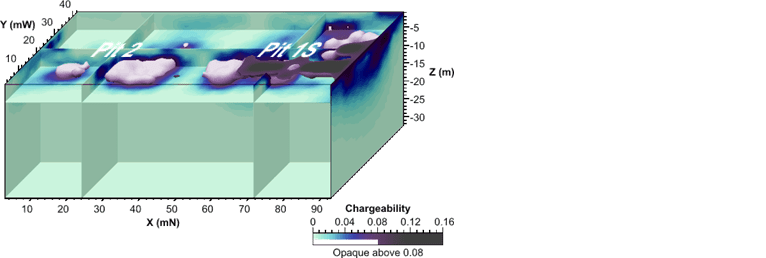
A related technique, known as induced polarisation or IP, depends on the extent to which the ground will store charge when a current flows (as well as its electrical resistivity). It can be measured in two different ways, either by carefully monitoring the voltage when the current is switched on and off (time-domain IP) or by passing currents at different frequencies and measuring the magnitude and phase of the voltage (spectral IP).
In time-domain IP, chargeable regions of the ground will cause the voltage to change over several seconds immediately after switch-on. This is caused by a build-up of charges on the surfaces of the chargeable body. When the voltage is switched off, these polarised charges maintain a fraction of the voltage, which decays over the same timescale (Animation 3). This decay is monitored over time, giving a measurement of the apparent chargeability in the vicinity of the electrodes. An image of the chargeability distribution can then be found in the same way as for electrical resistivity (by making measurements at different locations and separations and using an inverse modelling process).
Many subsurface processes cause spontaneously occurring geoelectrical fields, which can be measured to give insight into their nature and causes. Measuring these self-potentials (SPs) requires relatively expensive non-polarising electrodes and disentangling multiple causative effects can be challenging. However, it is often worthwhile measuring it because, in certain situations, SP can yield information unavailable by any other geophysical technique.
One important case is the streaming potential, which is caused by the flow of fluid through the ground. A difference in hydraulic head between sources and sinks of fluid drives the flow through the ground. This carries with it excess charges that build up on the pore surfaces, leading to a separation of accumulated charges in the ground and an associated electric field. This in turn causes a conduction current to flow back through the formation, leading to an observed voltage difference (typically tens of millivolts) between pairs on non-polarising electrodes, which can be used to map the distribution of the field (Animation 4).
Animation 4: SP electrical field caused by hydraulic flow (dashed blue line) in the subsurface.
This information can be interpreted in terms of a distribution of likely locations for the sources and sinks of current. For example, a SP tomography image was generated for a survey above a concealed abandoned mine shaft (Figure 8). Since the shaft was open, it provided a preferential pathway to drain water from the surface to depth, giving a clear self-potential signature and indication of its size, shape and location in the tomographic image.
Wireless sensor networks
Wireless sensors deliver near real-time information from remote field sites. The networks can deliver measurement data from multiple serial digital interface (SDI) sensors via a telemetry link to an active database scheme.
For more information, please visit SENSOR NET.
ALARMS — Assessment of Landslides using Acoustic Real-time Monitoring Systems
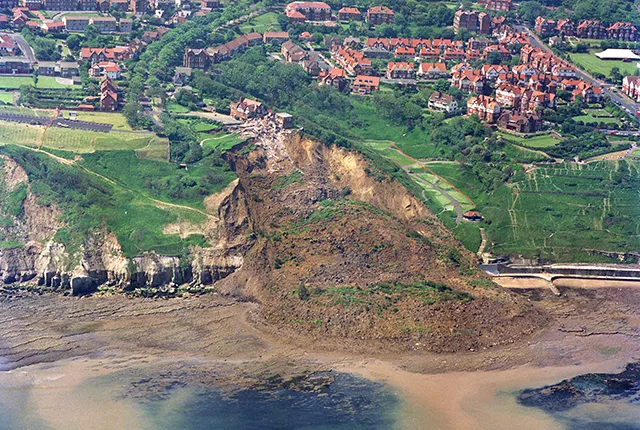
Worldwide, slope failures cause catastrophic consequences, resulting in many thousands of deaths each year, damage to civil infrastructure costing billions of pounds, displacement of people from their homes, and the breakdown of basic services such as water supply and transport.
A prototype acoustic emission device invented at Loughborough University has been re-engineered by the BGS using state-of-the-art, low-cost, miniaturised acoustic sensors and integrated with wireless networking capability (GSM) to provide early warning of slope instability.
Imminent landslides are normally accompanied by increased acoustic emissions levels (high-frequency stress waves) due to interparticle soil friction and displacement. The ALARMS sensors are permanently installed and transmit a real-time SMS text message when the acoustic soil activity reaches a pre-defined threshold.
ALARMS uses a steel tube called a wave guide to conduct the signals out of the ground. The steel tube is placed in a borehole in the ground that is filled with sand or gravel. The sand and gravel produces more energy when moved than the surrounding soil, which makes the signal easier to detect. The device also detects high-frequency waves of around 20–30 kHz.
Lower frequencies lose less energy and are easier to detect but invariably include background noise from other sources. Our results have demonstrated how the acoustic signal produced by the sand and gravel can be related to the speed and size of movement in the ground, regardless of the type of soil.
The device has been performance tested and demonstrated at the Hollin Hill Landslide Observatory in Yorkshire.
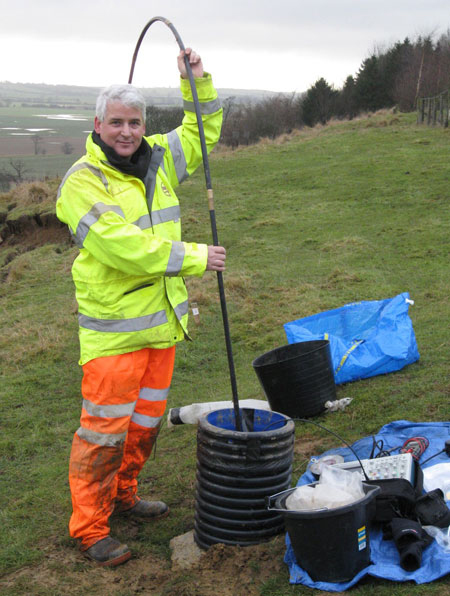
Figure 9: installation of ALARMS sensors.
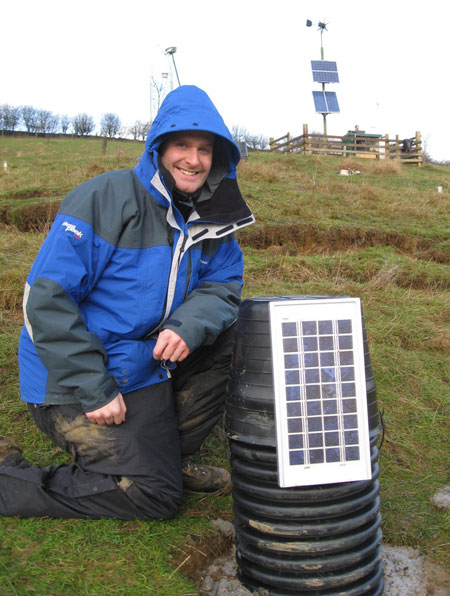
Figure 10: installation of ALARMS sensors.
A business plan has been developed to enable the commercial exploitation of the technology. The plan includes a long-term vision, cash-flow projections and a marketing strategy to attract inward investment by licensing or spin-out.
The wireless telemetry and re-engineering required for ALARMS drew heavily on the BGS’s expertise in developing an Automated time-Lapse Electrical Resistivity (ALERT) system for monitoring the stability of both natural landslides and engineered structures like dams, embankments and hydraulic barriers.
The research was funded by a joint EPSRC follow-on grant to the BGS and Loughborough University. The project won the University Enterprise Award in 2010 for being a practical, low-cost innovation that could significantly reduce loss of life in developing countries.
Dixon, N, Spriggs, M P, Smith, A, Meldrum, P, and Haslam, E. 2014. Quantification of reactivated landslide behaviour using acoustic emission monitoring. Landslides, Vol. 12, 549–560.
Dixon, N, Smith, A, Spriggs, M, Ridley, A, Meldrum, P, and Haslam, E. 2015. Stability monitoring of a rail slope using acoustic emission. Proceedings of the Institution of Civil Engineers — Geotechnical Engineering, Vol. 168(5), 373–384.
Smith, A, Dixon, N, Meldrum, P, Haslam, E, and Chambers, J. 2014. Acoustic emission monitoring of a soil slope: comparisons with continuous deformation measurements. Géotechnique Letters, Vol. 4(4), 255–261.
Our current research
BGS PRIME: an early warning system for slope failure
Dam and slope failures can lead to the wide-scale destruction of property and, in some cases, catastrophic loss of life.

Engineering and Geotechnical Capability
Leading the development and application of field and laboratory infrastructure and long-term management of geophysical and geotechnical property data.
Landslides
Building resilience both in the UK and internationally to landslides and carrying out many aspects of landslide research.