
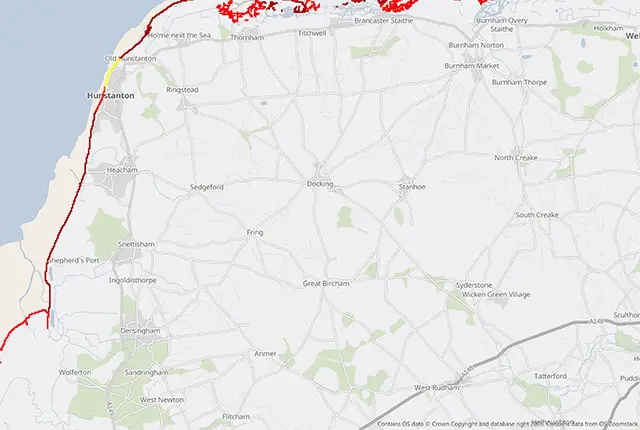
GeoCoast erosion susceptibility dataset. BGS © UKRI — contains OS data © Crown Copyright 2022.
GeoCoast Premium
- 1:50 000
- Great Britain
- Premium
BGS GeoCoast provides information on the morphology, behaviour and vulnerability of the coastline, underpinned by its geology and its coastal context. It offers assessments of susceptibility to coast erosion, innundation, subsidence and groundwater flooding as well as coastal morphology classification. It can be used to underpin coastal decision making and planning relative to coastal inundation, erosion and climate change impacts. The datasets are compatible with shoreline management plan areas and are targeted at coastal practitioners including regulatory bodies, local authorities and asset owners.
Key information
- Scale:
- 1:50 000
- Coverage:
- Great Britain
- Availability:
- Premium
- Price:
Coastal grid data (inc. flooding):
£936.85 per Shoreline Management Plan (SMP)
£22,072.33 for national coverageCoastal erosion data:
£255.50 per Shoreline Management Plan (SMP)
£6,018.55 for national coveragePlease enquire for multiple discount options
- Format:
- GIS vector grids (ESRI, other formats available on request)
- Uses:
- Local-level to region-level use
- Themes:
- Environmental change, Hazards
- Sector:
- Flooding, Weathering and erosion
BGS GeoCoast provides information on the morphology, behaviour and vulnerability of the coastline, underpinned by its geology and its coastal context (shape; profile; height, etc.). It can be used to underpin coastal decision making and planning relative to coastal inundation, erosion and climate change impacts. The datasets are compatible with shoreline management plan areas and are targeted at coastal practitioners including regulatory bodies, local authorities and asset owners, but anyone with an interest in the coast can use it.
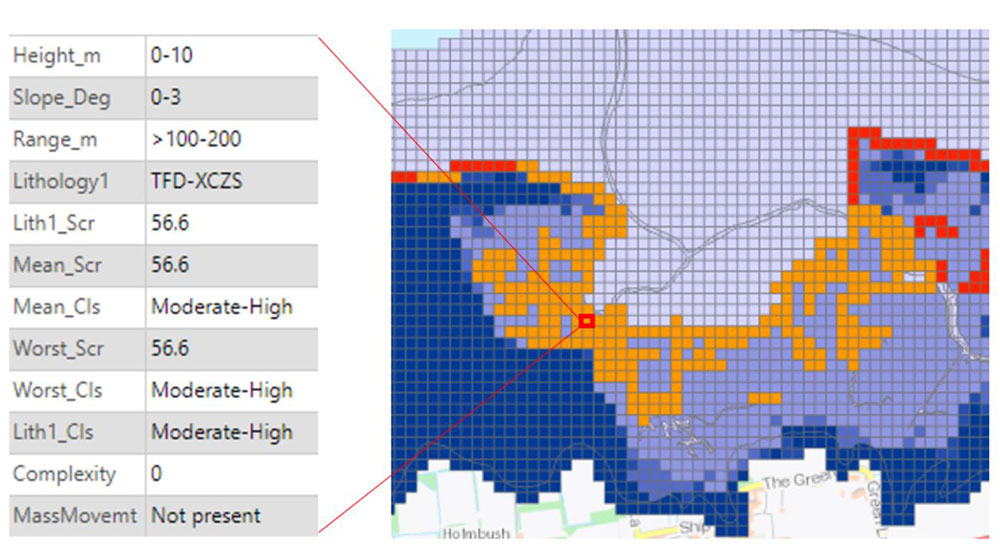
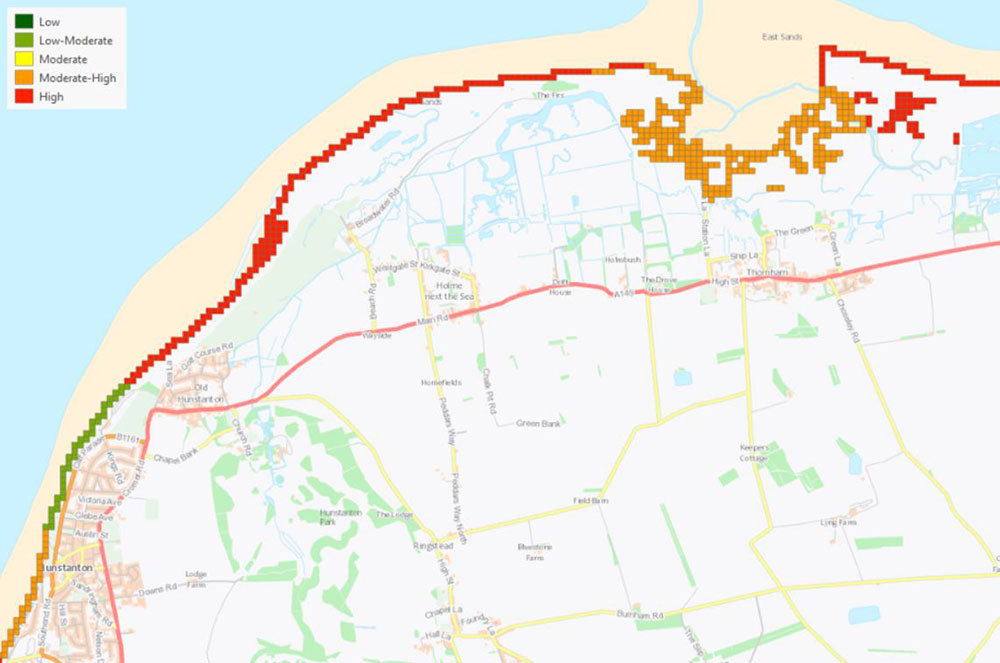
Example BGS GeoCoast data. Coast grid attributes include coastal profile and erosion susceptibility scores. BGS © UKRI — contains OS data © Crown Copyright 2022.
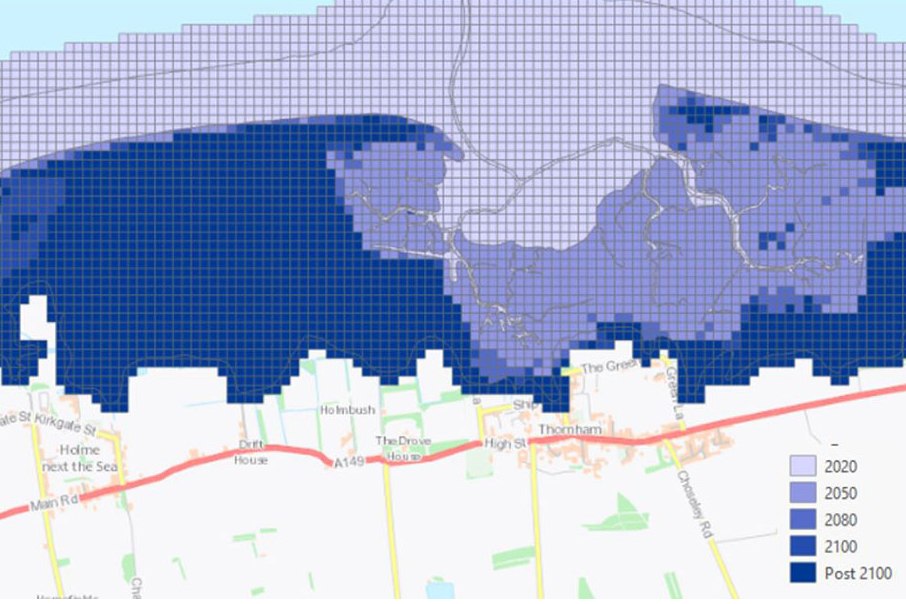
GeoCoast inundation potential under UKCP18 climate scenarios. BGS © UKRI — contains OS data © Crown Copyright 2022.
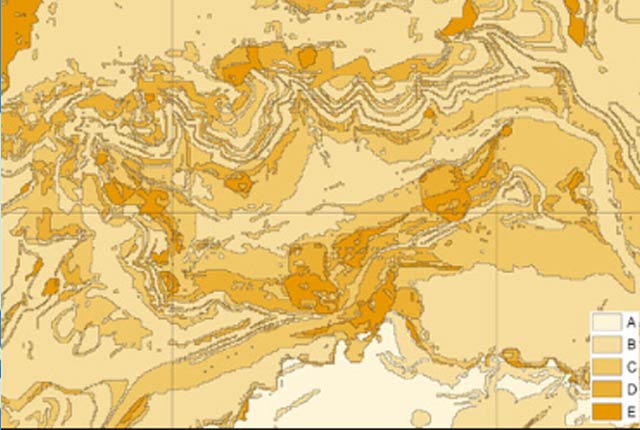
GeoCoast erosion susceptibility dataset. BGS © UKRI — contains OS data © Crown Copyright 2022.
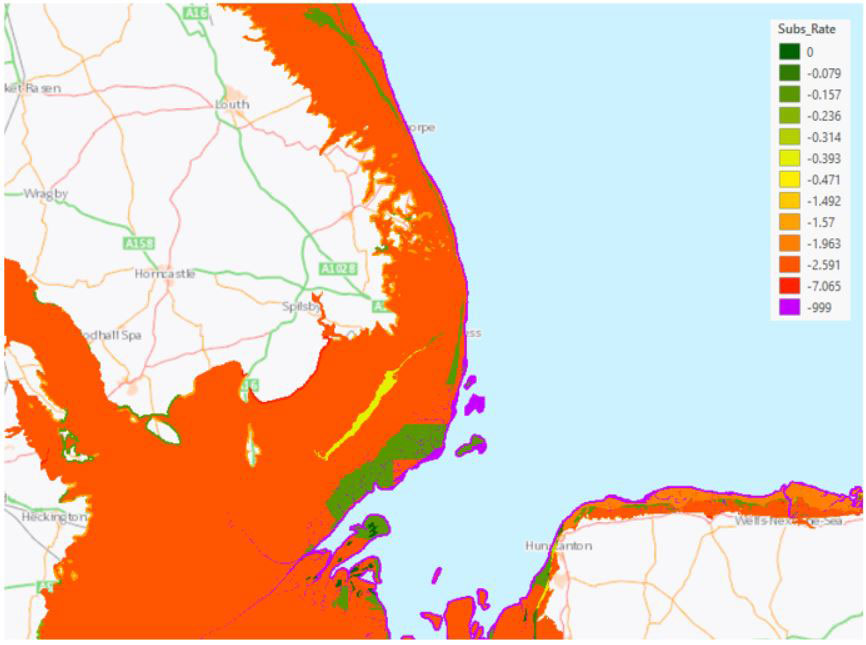
GeoCoast subsidence rate (mm/year). BGS © UKRI — contains OS data © Crown Copyright 2022.
BGS GeoCoast Premium
GeoCoast Premium provides a range of geological and geomorphological properties that influence coastal vulnerability. They are provided as attributed 50 m grid cells around the coastline of Great Britain. The data has been developed from BGS databases and datasets, regional expertise and additional analytics to compile the essential baseline geo-information necessary to feed into coastal vulnerability analyses and assessments for resilience and adaptation.
GeoCoast Premium consists of:
- coast grid dataset
- Foreshore (type; properties; spatial area)
- backshore (type; properties; spatial area)
- coastal erosion susceptibility overview (vertical cliff layers; properties)
- cliff profiling (slope angle; distance; cliff height)
- potential inundation zones under climate change scenarios (future sea level rise forecast for 2050, 2080 and 2100)
- coastal subsidence potential (satellite measurements and lithology type)
- groundwater flooding and coastal flood dataset (combined hazards indicating exacerbated impact)
- coastal erosion susceptibility dataset (a full lithology by lithology detailed attributes)

BGS GeoCoast is an integrated GIS package of datasets designed to inform and support coastal management and adaptation.
Frequently asked questions
These questions and answers have been provided to address any potential issues relating to how the product can be used or how it can be interpreted. If you have any additional questions, please contact digitaldata@bgs.ac.uk.
GeoCoast is an integrated GIS package of datasets designed to inform the user about geological and climate change factors that influence coastal evolution, and to support stakeholders seeking to assess coastal management and adaptation.
GeoCoast Premium contains information on the morphology, properties and vulnerability of the coastline, underpinned by its geology and its coastal context (profile; height, etc.). It includes:
- information on coastal erosion susceptibility
- modelled inundation under different climate scenarios
- potential subsidence
- cliff profiles
In addition, there are a suite of open datasets (GeoCoast Open) that provide summary data at county, local authority and shoreline management plan levels.
GeoCoast can be used to underpin coastal decision making and planning relative to coastal inundation, erosion and climate change impacts. The datasets are compatible with shoreline management plan areas. Being in GIS format, GeoCoast is easily combined with other geospatial data.
GeoCoast is targeted at all coastal practitioners including regulatory bodies, local authorities and asset owners.
The GeoCoast dataset has been created as vector grids and is available in GIS ESRI format and geopackage. Other formats are available on request.
The GeoCoast product and its component datasets are produced for use at 1:50 000 scale providing 50 m ground resolution, and must not be used at larger scales. All spatial searches against the data should be done with a minimum 50 m buffer.
The datasets have full national coverage for the coastal zone of Great Britain.
Shoreline management plans are developed by Coastal Groups to help manage the threat of coastal change. Members of the coastal group typically consist of local councils and the Environment Agency. Shoreline management plans identify the most sustainable approach to managing flood and coastal risks to the coastline in the short, medium and long-term. Shoreline management plans are used in England and Wales. https://www.gov.uk/government/publications/shoreline-management-plans-smps
Local plan districts are used in Scotland for flood risk management purposes. A strategy has been developed for each local plan district and approved by Scottish Government and published by the Scottish Environment Protection Agency. https://www2.sepa.org.uk/frmstrategies/index.html
Natural ground stability and flood hazards may lead to financial loss for anyone involved in the ownership or management of property, including developers, householders or local government. GeoCoast can be used to underpin coastal decision making and planning relative to coastal inundation, erosion and climate change impacts.
Armed with knowledge about potential hazards, preventative steps can be put in place to alleviate the impact of the hazard to people and property. The cost of such prevention may be low and is often many times lower than the repair bill following ground movement.
The identification and classification of these hazards can be of use to regional planners, local government offices, developers, homeowners, solicitors, loss adjusters, the insurance industry, architects and surveyors.
The erosion scores are created by analysing the lithological properties within a cliff or coastal slope. These scores range from 0 to 100 (low to high susceptibility).
Each lithology within a coastal slope will have a score, therefore it is important to consider the range of lithologies present. A high lithology score would suggest that the area has a higher susceptibility to wave erosion. A high worst-case class would mean that one or more lithologies within that coastal section have a high susceptibility.
An indication of coastal erosion does not necessarily mean that a location will be affected by coastal processes, especially if the area has coastal defences. Such an assessment can only be made by inspection of the area by a qualified professional.
The final gridded output is designed to streamline the multiple key datasets and potential factors that impact on coastal processes. Rather than having multiple layers, the data will be combined to create an easy-to-use dataset that contains all the relevant data necessary for a coastal assessment. The gridded format (50 m grid cells) helps to convey to users the accuracy limitations of the data rather than having a specific vector line that users often perceive as a precise location, particularly where shorelines are concerned.
Not all attributes will be present for all grid cells, it depends on the location e.g. foreshore or backshore, or the hazard e.g. future inundation or groundwater flooding. For example, a grid cell showing the extent of inundation under climate change will have a greater extent that the foreshore or cliff erosion and therefore these attribute will not be present as the data is not relevant.
A coastal erosion susceptibility algorithm is used (based on lithology strength, permeability and discontinuities) to determine a final score, and normalised from 0 to 100 for erosion susceptibility. This score is then divided by equal intervals to create the five classes: low, low-moderate, moderate, moderate-high and high.
The GeoCoast data represents the natural properties present along Great Britain’s coastline and therefore doesn’t consider the impact of coastal defences. This is because it is important to understand the natural properties as well as the range of practices in use. Not all areas will have defences; some will be degraded, no longer maintained or have differing shoreline management plans, and there is no nationally consistent source of data on coastal defence condition.
It is also useful to consider that, if defences are removed from areas of similar characteristics, might the coastal processes behave as at other locations and can lessons be learned or shared. It should also be considered that some defences will not provide sufficient protection as sea levels continue to increase.
The current erosion susceptibility analysis looks at the strength, permeability and discontinuities within and between different layers of strata/lithologies. The calculation does not include any previous instability because the process of coastal erosion is complex.
Previous instability might make the coast less susceptible initially, increasing susceptibility over time as wave erosion undermines to toe of a landslide, for example. However, the rate and frequency of these processes are difficult to predict. We have included a ‘mass movement’ attribute that provides an indication of where past instability has occurred and this is derived from the BGS Geology mass movement dataset.
GeoCoast does not go as far as providing predicted extents of erosion or erosion rates due to the inherent uncertainties associated with coastal erosion processes.
There are multiple complex influencing factors, both natural and artificial, that mean that predicting the timing and extent of erosion is extremely difficult at a national scale. However, GeoCoast does plug this data gap and provides a suite of geological properties data at a more granular scale that can be used by stakeholders as key components within a modelling environment alongside additional factors such as defences, tidal currents, wave heights, etc.
The mapping accuracy associated with the GeoCoast dataset is primarily based on that of the BGS Geology 50K dataset. Derived by vector capture from paper map archives, this data has a nominal +/-1 mm precision at map scale (1:50 000), which equates to +/-50 m in real space. This is only a measure of how faithfully the lines were captured from their legacy paper map sources. Consequently, this dataset must not be used at scales finer than 1:50 000.
The UKCP18 sea level rise data is based on 100 km2 gridded data. The mapping of the vertical cliff lithologies was created through expert knowledge and are based on 1:10 000 to 1:50 000-scale mapping knowledge.
The datasets derived as part of the GeoCoast product are predicted values based on real-world values and on the expert judgement of engineering geologists and district geologists with regional expertise.
The current version (V1) was released in 2022. The dataset will be revised when sufficient source data is updated and there is a user demand. An ongoing programme of product development is in place and frequent reviews will determine when a new version of the dataset will be released.
If you would like to use this for commercial applications, please contact us via digitaldata@bgs.ac.uk
Relative topics
You may also be interested in
GeoCoast Open
GeoCoast Open provides a range of historic images and diagrams extracted from our archives, memoirs and other publications, which can provide a reference for coastal change.
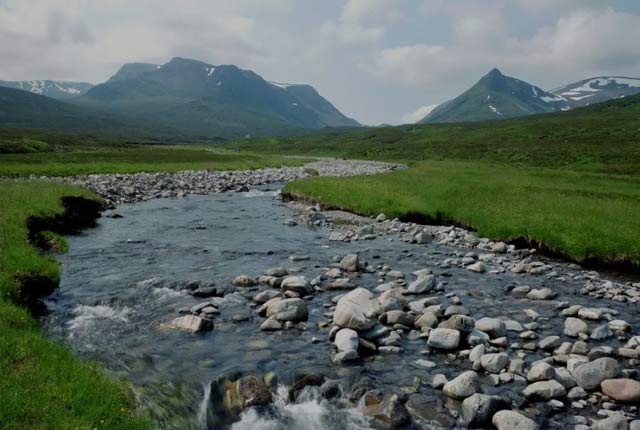
BGS GeoScour Premium
The BGS GeoScour datasets provide a generalised overview of the natural characteristics and properties of catchment and riverine environments for the assessment of river scour in Great Britain.
BGS GeoSure
The BGS GeoSure datasets identify areas of potential hazard and, therefore, potential natural ground movement, in Great Britain.
BGS National Landslide Database
The National Landslide Database is the most extensive source of information on landslides in Great Britain with over 17 000 records.

Geological indicators of flooding
BGS has produced the geological indicators of flooding dataset from geological maps detailing the floodplains and coastal plains in Britain.
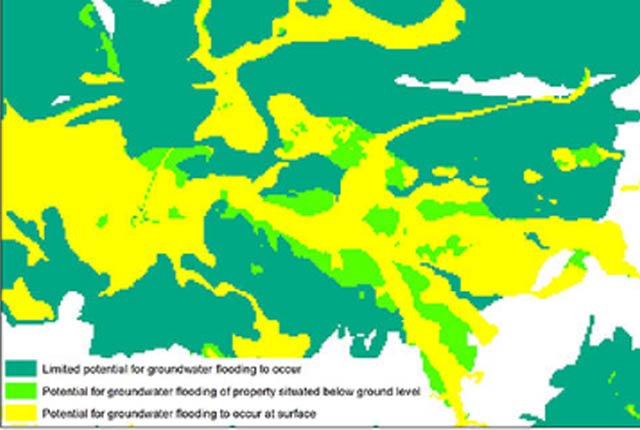
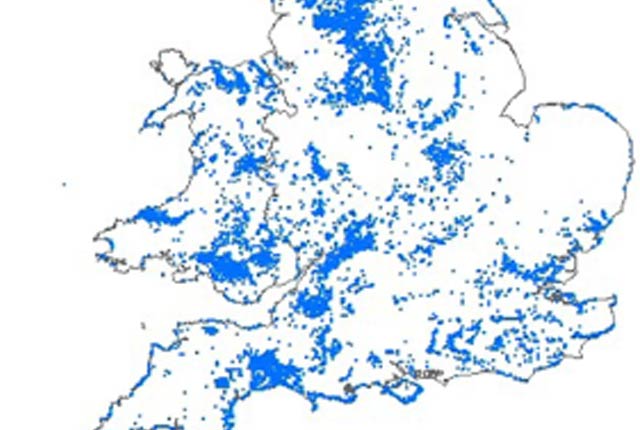
Groundwater flooding
In response to the need for more information on groundwater flooding, BGS has produced the first national dataset on the susceptibility across Britain.