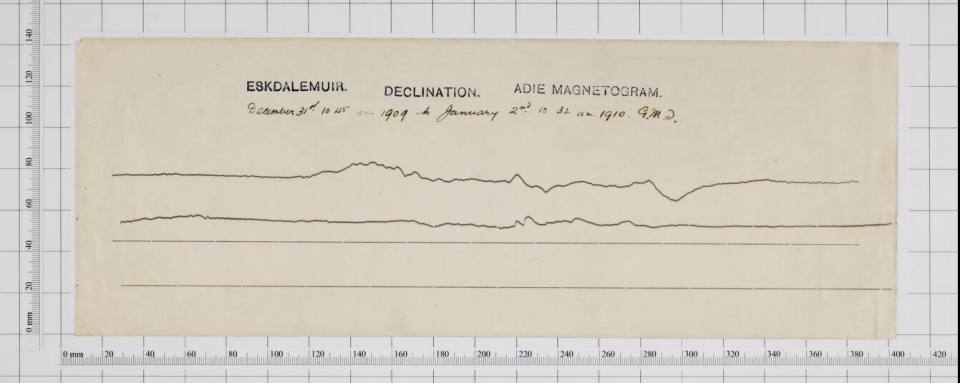
The BGS holds a unique collection of about 250 000 historical magnetograms on photographic paper — original recordings of the variations in the strength and direction of the Earth’s magnetic field.

Eskdalemuir magnetogram 31/12/1909 – 01/01/1910. BGS © UKRI
The magnetogram collection — one of the longest running geomagnetic series in the world — provides a continuous record of more than 160 years of UK measurements.
Search the magnetograms collection
What’s the attraction of magnetograms?
The collection is a valuable, partly untapped data resource for studying geomagnetic storms, space weather and the evolution of the Earth’s magnetic field. The magnetograms provide insight into:
- the Earth’s outer core: long-term change (years to centuries) in the dynamo that sustains our magnetic field
- space weather: short-term changes (seconds to days) in near-Earth space and on the ground
- space climate: long-term change (decades to centuries) in solar activity and consequences for Earth’s environment
All the above have an impact on human activities. For example, bad space weather affects technologies that we increasingly rely on, such as electrical power and GPS networks.

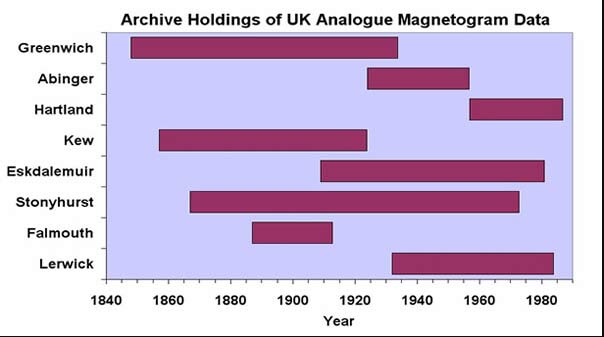
Archive holdings of UK analogue magnetogram data. BGS © UKRI
Measurements from nine observatories
In the UK measurements were made at eight long-running observatories.
- Abinger, London
- Eskdalemuir, Dumfries and Galloway
- Falmouth, Cornwall
- Greenwich, London
- Hartland, Devon
- Kew, London
- Lerwick, Shetland
- Stonyhurst, Lancashire
We also have records from the Cape Evans observatory that ran continuously at Robert Falcon Scott’s Antarctic base camp during the British Antarctic Expedition 1910–13.
Scanning the archive
Between 2009 and 2013 BGS undertook a programme of work to capture high-quality digital images of the magnetogram collection to provide a back up to the photographic paper originals. The images captured are available to search online. Scientists and the general public around the world can now gain easy access to this historical dataset.
Information about the results of your magnetogram search
The results of your search include the observatory name, the components used, the date range of the recording start date and links to view the front and back of the magnetogram.
Most of the backs of the magnetograms don’t have any data on them but we have given you the option to view them if you want just so that you know if there is anything on them or not.
The letters in the component(s) column are component codes. If you don’t know what they mean, view the component dictionary for an explanation. This can be accessed from the ‘See also’ menu on the right-hand-side of the browser window.
Historical yearbooks
We also hold archived copies of the UK yearbooks. These contain the published results from each observatory, including data manually transcribed from magnetograms, series of single or spot manual observations of the magnetic components and other derived results.
Significantly, the yearbooks provide information on the observatory operations, observing equipment and observation methods, which are essential for meaningful use of the magnetograms and other data.
Browse our online geomagnetic yearbooks and historical articles for current and past UK magnetic observatories or historic British colonial magnetic observatories (around 1840–1850).
Contact
If you want to discover more then please contact Ellen Clarke.
British Geological Survey. (2013). UK Magnetic Observatory Magnetograms. British Geological Survey. (Dataset). https://doi.org/10.5285/4eeec93c-12e6-4244-9b99-52c61350f9aa
You may also be interested in
Scanned records
Open access to a number of our digital scan collections, including borehole log scans and published maps.

Geomagnetism
Measuring, recording and interpreting variations in the Earth’s magnetic field including those caused by space weather


