The aim of the Investigation and Monitoring of Aggregate Deposits Using Geo-Electrical Resistivity Imaging (IMAGER) project is to develop 3D electrical resistivity tomography (ERT) as a nationally applicable method for investigating economically and strategically important onshore sand and gravel deposits.
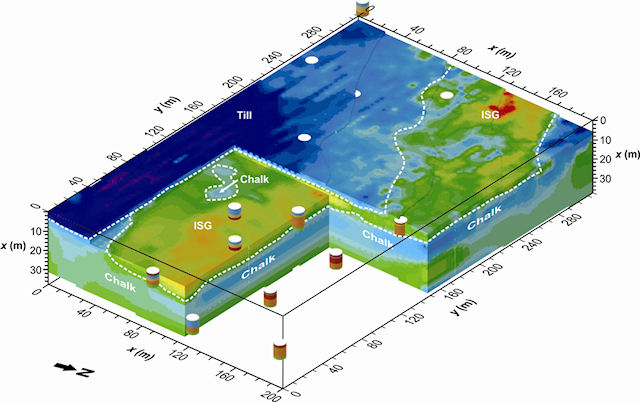

3D ERT image of a complex sand and gravel deposit.
ERT is a very powerful geophysical ground-imaging tool that can be used for both deposit characterisation and groundwater monitoring; IMAGER will develop ERT for both these purposes.
Project partners
IMAGER is a Mineral Industry Sustainable Technology Programme (MIST)-funded project, carried out in partnership with:
- BGS
- Minerals Industry Research Organisation (MIRO)
- Tarmac
- Hanson
- CEMEX
- Lafarge (now part of Holcim UK)
- Aggregate Industries
Deposit characterisation
When used as a geological characterisation tool, 3D ERT can provide high-resolution volumetric images of the ground and is therefore particularly suited to investigating complex deposits or deposits that are difficult to drill.
Although research has begun into the use of ERT for sand and gravel deposit evaluation, it has yet to be tested in many economically important geological settings in the UK. Moreover, there is still much work to be done to quantify the performance and resolution of ERT and to quantify the economic and environmental benefits of integrating ERT into the deposit investigation process. The IMAGER project will address these knowledge gaps.
Deposit visualisation
As part of the project, ERT has been successfully used to image the subsurface architecture of sand and gravel deposits at a number of commercial quarries. Advanced 3D modelling and voxel visualisation permits the quarry operator to see the full spatial distribution of a deposit prior to drilling and hence to estimate the potential tonnage. By setting appropriate resistivity iso-surfaces, the background overburden or bedrock can be removed from the tomographic image to further define the sand and gravel geometry (see Animation 1).
Animation 1: 3D visualisation of a resistivity image of a quarry. Progressive removal of the bedrock and overburden reveals the extent of the sand and gravel deposit.
Groundwater monitoring
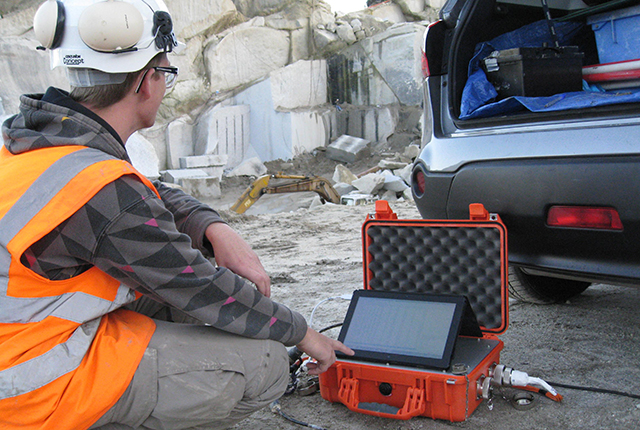
Time-lapse ERT data can be used to monitor changes in both groundwater levels and quality. By using the state-of-the-art, BGS-designed ALERT (automated time-lapse ERT) monitoring system it will be possible to spatially image rapidly changing hydrogeological conditions caused by quarry dewatering in real-time.
Although ERT monitoring is now being used in other sectors (e.g. contaminated land investigation; waste management; groundwater) it has yet to be applied by the minerals industry. The IMAGER project will therefore demonstrate proof-of-concept for this technology in relation to sand and gravel workings. Our focus will initially be on deploying time-lapse ERT for high-risk sites where particular care has to be given to groundwater management. Examples of these include sites with significant environmental or ecological sensitivities, such as Sites of Special Scientific Interest (SSSIs), or at sites in complex hydrogeological settings where dewatering could affect surrounding aquifers or ecosystems.
Animation 2: monitoring of dewatering in a sand aquifer using time-lapse ERT. Red = unsaturated; blue = saturated; dashed line shows the water table.
Contact
If you would like to discover more then please contact Jonathan Chambers.
You may also be interested in
Applications
Applications range from mineral exploration and waste management, to monitoring active processes within the subsurface, such as the movement of pollutants, or the flow of groundwater in unstable slopes affecting infrastructure.
Technologies
Creating innovative technologies with in the field of geophysical and geotechnical monitoring.