The BGS is conducting preliminary research into the impacts of interacting hazards in Great Britain. Using an array of GIS tools, statistical analysis and qualitative and semi-quantitative approaches, we identify where multiple hazards co-exist, how they interact and what their potential interrelated effects are.
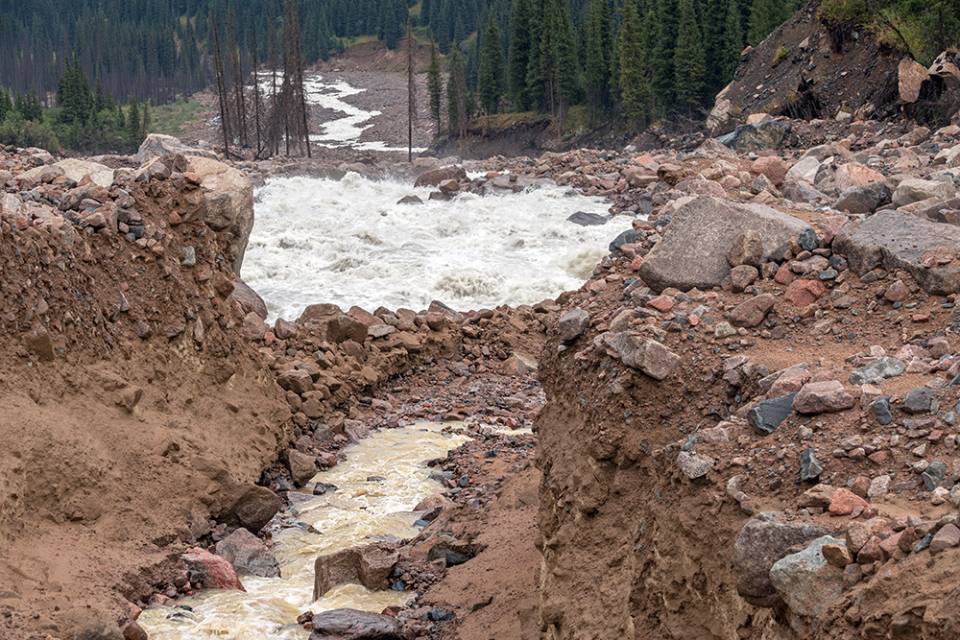

Riverbed after a mudflow in the mountains. © kiwisoul.
The number of natural hazard events that may occur simultaneously, cascadingly or cumulatively over time in Great Britain is high. The consequences of such hazard relationships occurring means that an impact is generated that is different from that of the individual hazards occurring in isolation. This can lead to considerable challenges, especially for asset managers and operators of national networks.
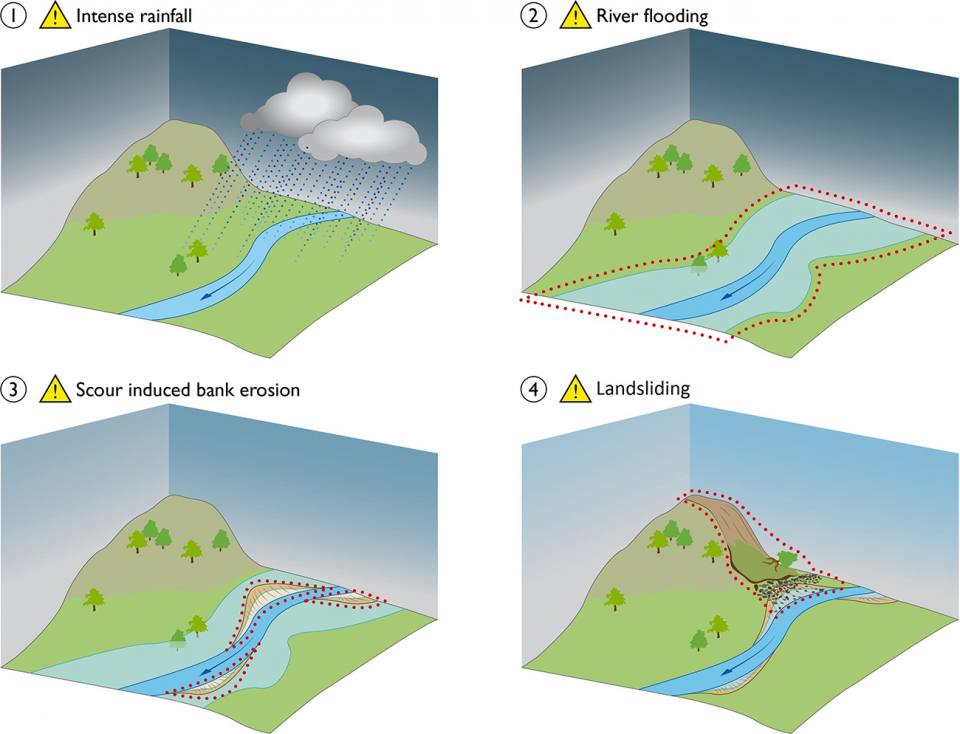
An example of a multi-hazard scenario: (1) intense rainfall triggers (2) river flooding, which causes (3) scour-induced bank erosion, which results in removal of material from the toe section of a slope and induces (4) landsliding. © BGS/UKRI.
Hazard relationships
Understanding how one hazard can trigger or increase the probability of a secondary hazard is key to assessing and mitigating multi-hazard events. We use a hazard interaction matrix (Gill and Malamud, 2014) to describe relationships between hazards and identify potential cascading events based on expert knowledge. The type of relationship most likely for each hazard combination is identified by listing the primary hazard on the x-axis and any secondary hazards on the y-axis. Each cell is attributed depending on whether or not the primary hazard is thought to trigger or increase likelihood of the secondary hazard.
Principal component analysis
The BGS has previously created susceptibility maps for individual hazards. We used these maps and principal component analysis to identify which hazards have a high spatial correlation. For example, the analysis showed a higher correlation between compressible ground, running sand and geological indicators of flooding than between groundwater flooding and shrink–swell.
A multi-hazard impact assessment system — MImAS
Combining the results from all of the above with evidence from the literature, the next step will be to create a multi-hazard map for Great Britain using a ‘compound hazard index’ approach. Weighted scores will be attributed to particular combinations of hazards based on their relationship type. The hazard map can then be integrated with a wide range of asset and infrastructure data (e.g. power; water; telecommunication and transport networks) and visualised using a data dashboard. Information about the exposure and vulnerability of different assets can further be integrated in the GIS system and interrogated through the dashboard tool.
MImAS is a tool that helps stakeholders better understand multi-hazard processes and their potential impacts. It can assist asset managers with prioritising investments, selecting mitigation options or reconsidering design in areas susceptible to particular combinations of interacting hazards. MImAS can also contribute towards time saving by reducing the need for site visits, whilst helping to identify sites requiring closer monitoring.
Future work
Future work will focus on developing the prototype MImAS tool. A focus group will be organised to ensure the product meets stakeholders’ requirements and needs. The trial version will be released for evaluation soon after.
In addition to answering the question of where multi-hazards could occur, research is underway to understand when and how big these processes can be.
Gill, J C, and Malamud, B D. 2014. Reviewing and visualising the interactions of natural hazards. Reviews of Geophysics, Vol. 52(4), 680–722.
Contact
If you want to discover more then please contact Roxana Ciurean.

Hazard and resilience modelling
Developing new and innovative data products that deliver geoscientific information to a range of users in an accessible form.