As part of the work being done by BGS to pilot a series of new ground investigation (GI) data tools for user testing, we have developed the following infographics which summarise the engineering geological descriptions and geotechnical properties for different geological units. The analysis is based on data held within the BGS National Geotechnical Properties Database for exploratory holes located within the Glasgow area.
Stratigraphic interpretations for all exploratory hole records have been validated by the BGS. The BGS has interpreted stratigraphy where this information has not been provided and reinterpreted the stratigraphy where it is inconsistent with current geological maps, the BGS 3D geological model of Glasgow and nearby borehole records.
The summary data presented here are not intended to be used for design purposes or to replace site-specific ground investigation. The purpose of these summaries is to provide statistically significant dataset for comparison to help reduce uncertainties associated with small site-specific datasets and to aid the planning of more targeted ground investigations.
Geotechnical property summaries include both parametric (mean, standard deviation and coefficient of variation) and nonparametric statistics (percentiles). While parametric statistics may be more familiar and frequently used, non-parametric statistics are more reliable for non-normally distributed data and data that contain extreme outliers. As such they are considered more appropriate for characterising the central tendency and dispersion of geotechnical properties. Further information on the variability and inherent uncertainties in geotechnical data and the application of robust statistical approaches is presented in Hallam (1990).
Summary infographics and statistical summaries are only provided for each unit where there are sufficient data for these to be meaningful. Density plots and 2D histograms are used in place of scatterplots to better represent large volumes of data. Percentiles in tables are reported based on sample size.
| Percentiles reported | Sample size |
|---|---|
| 50th | ≥5 |
| 25th, 50th, 75th | ≥10 |
| 10th, 25th, 50th, 75th, 90th | ≥25 |
| 2.5th, 10th, 25th, 50th, 75th, 90th, 97.5th | ≥100 |
| 0.5th, 2.5th, 10th, 25th, 50th, 75th, 90th, 97.5th, 99.5th | ≥500 |
Alluvium (ALV)

Geological descriptions
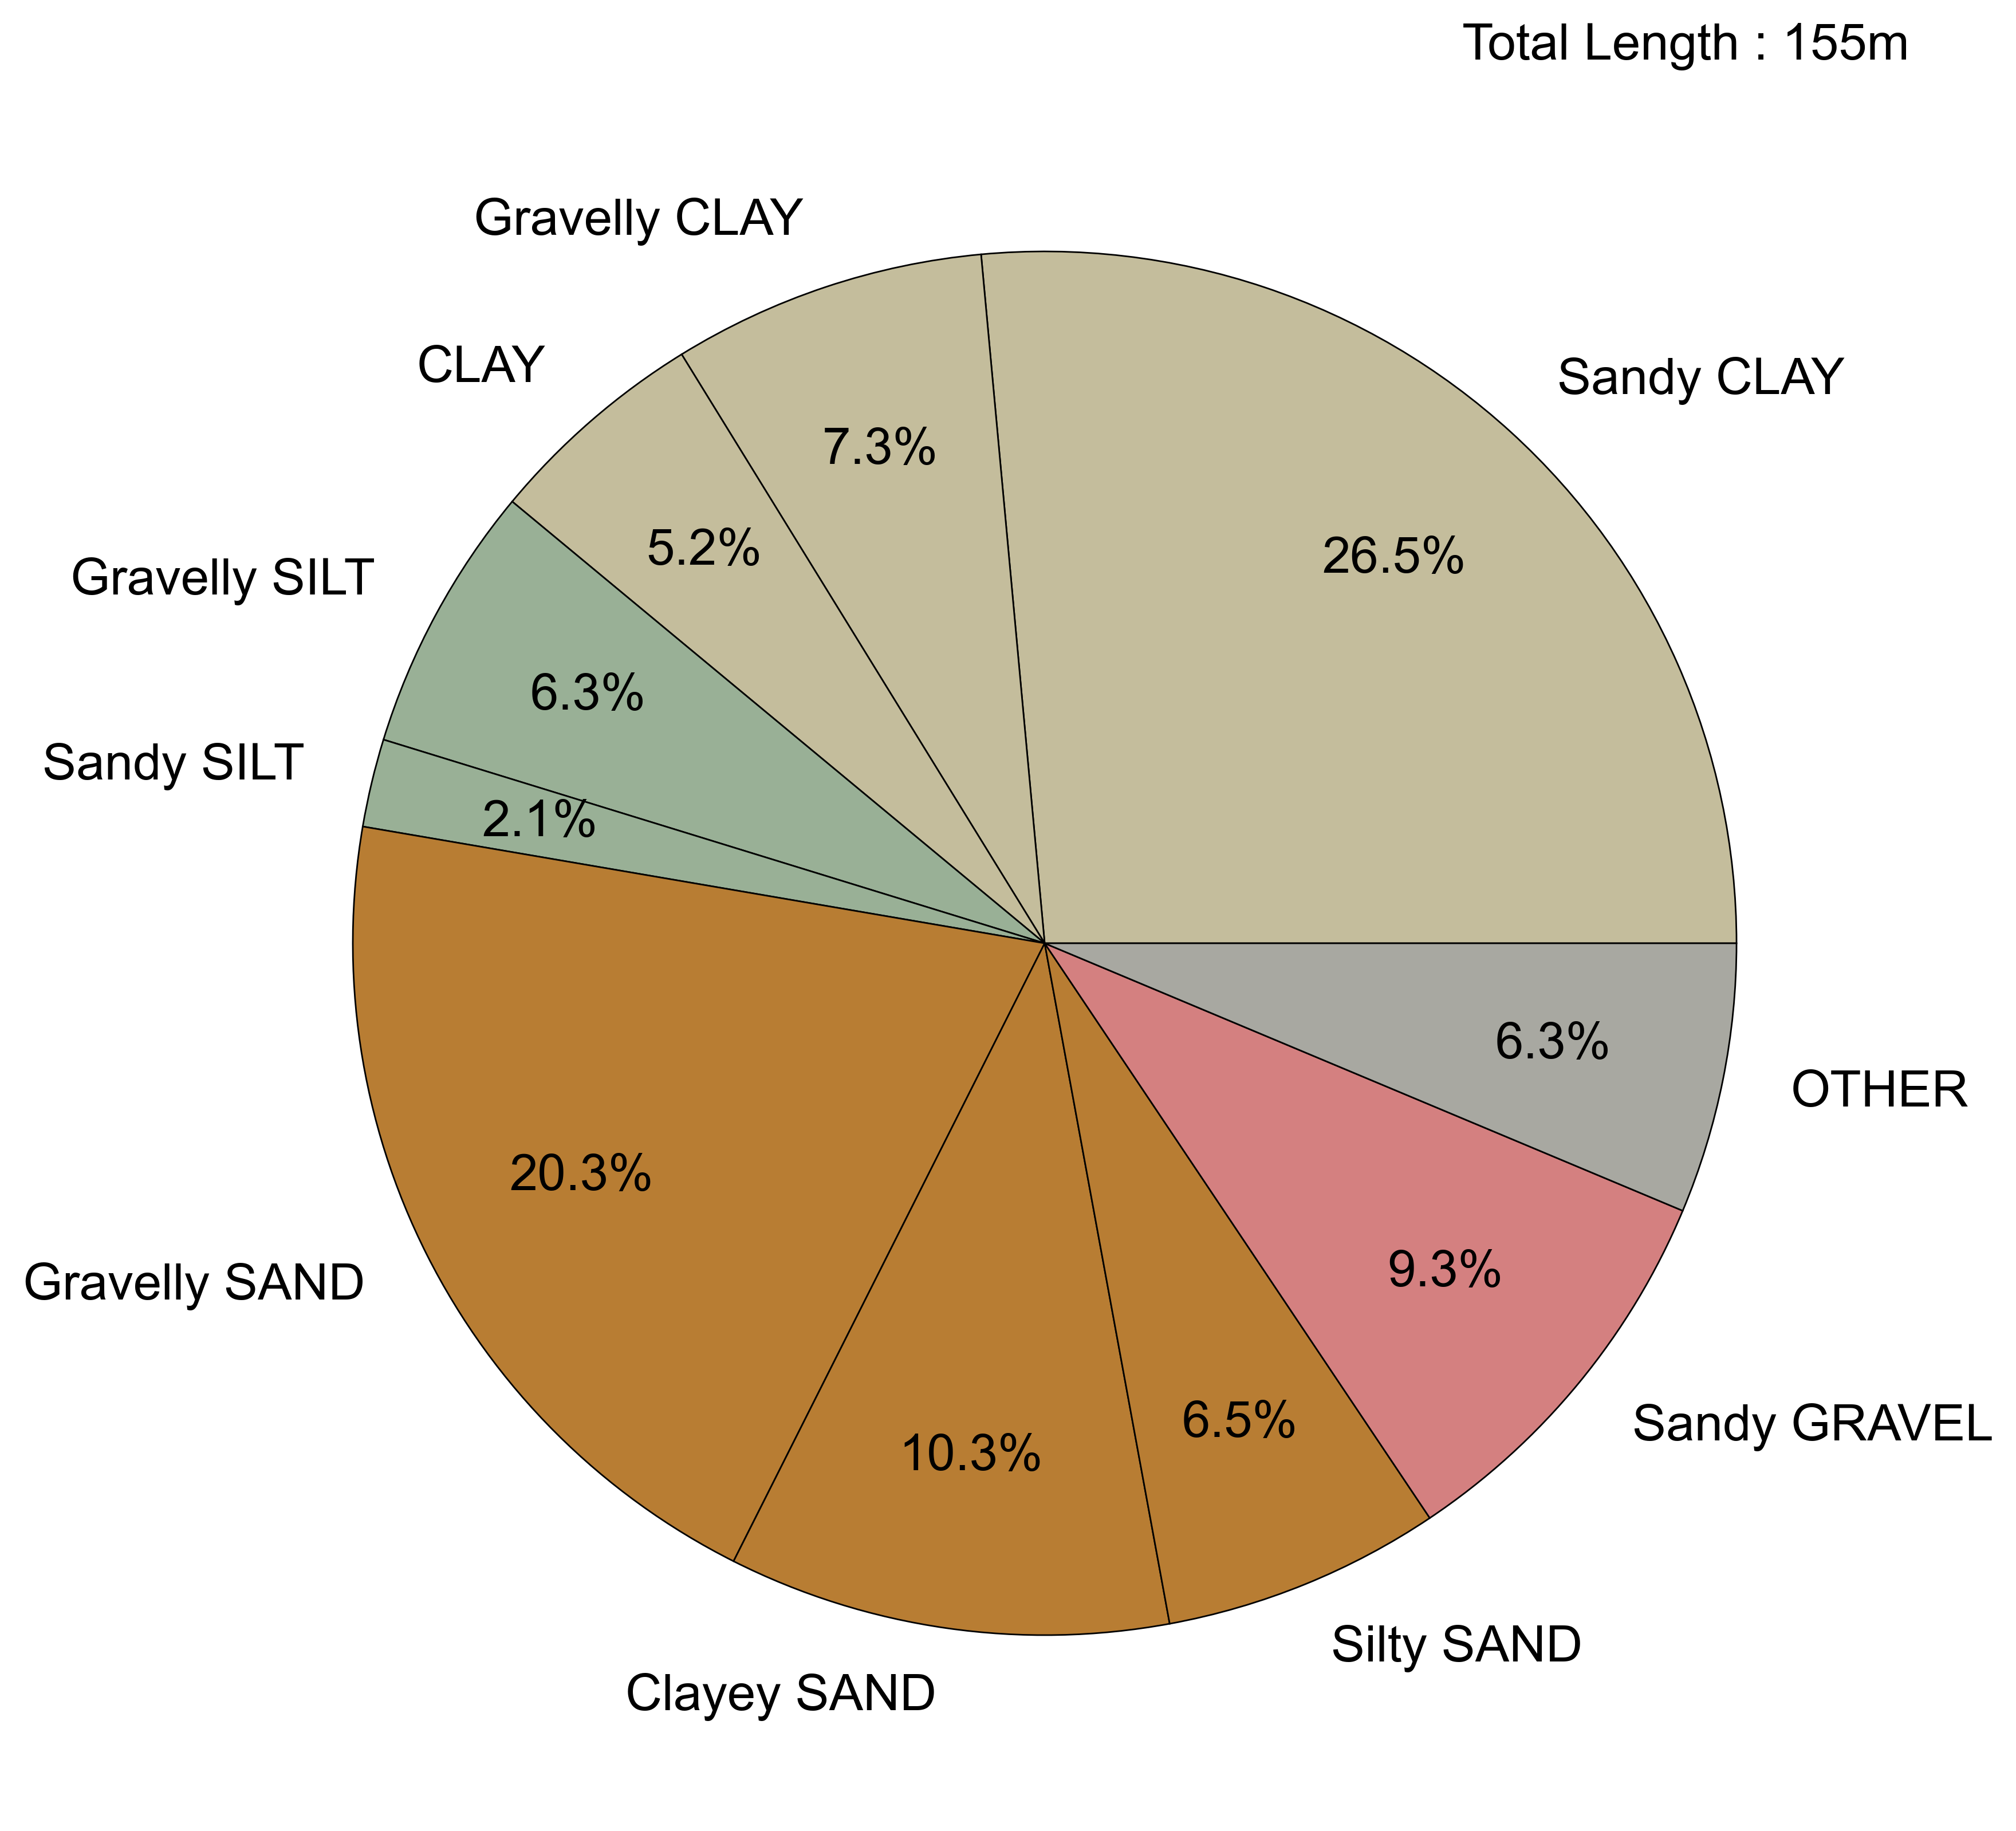
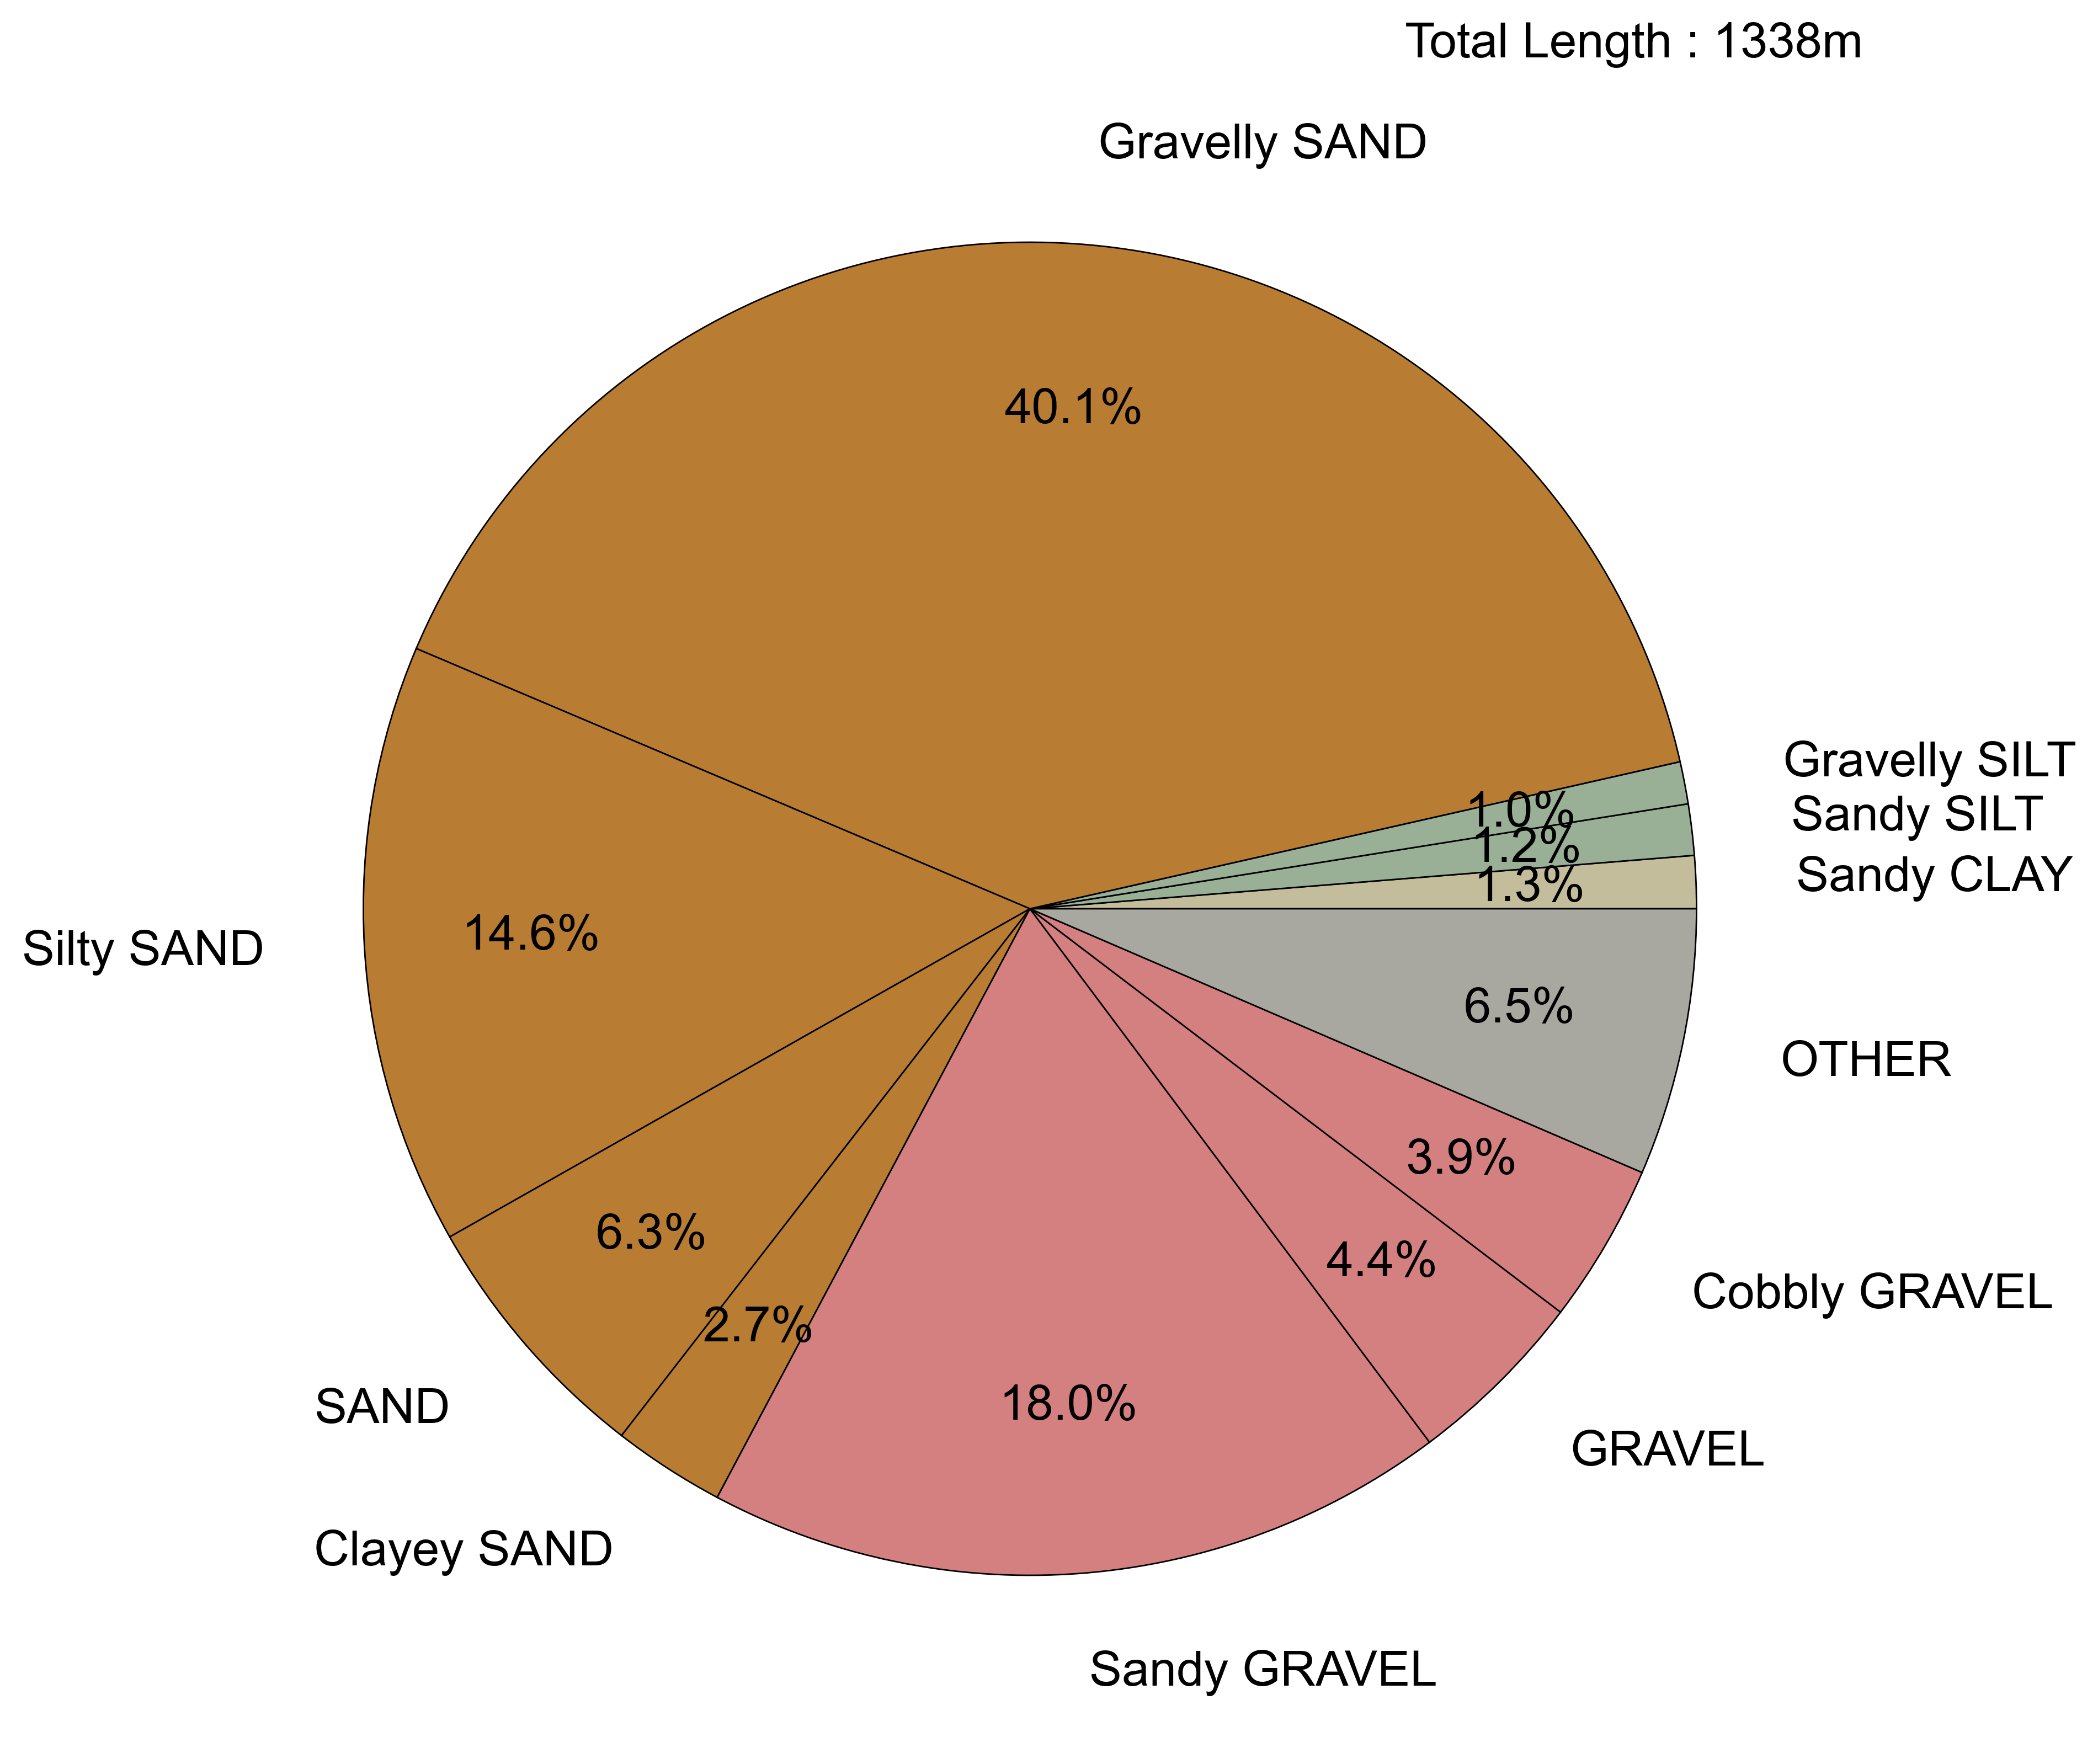
Pie chart summarising the dominant soil types (primary and secondary constituents) described in exploratory hole logs based on total metres logged. Descriptions have been simplified to remove tertiary constituents and a threshold of 1 per cent applied to aid graphical presentation. Soil types representing less than 1 per cent of the total logged are included in the ‘other’ category. BGS © UKRI.
Geological descriptions
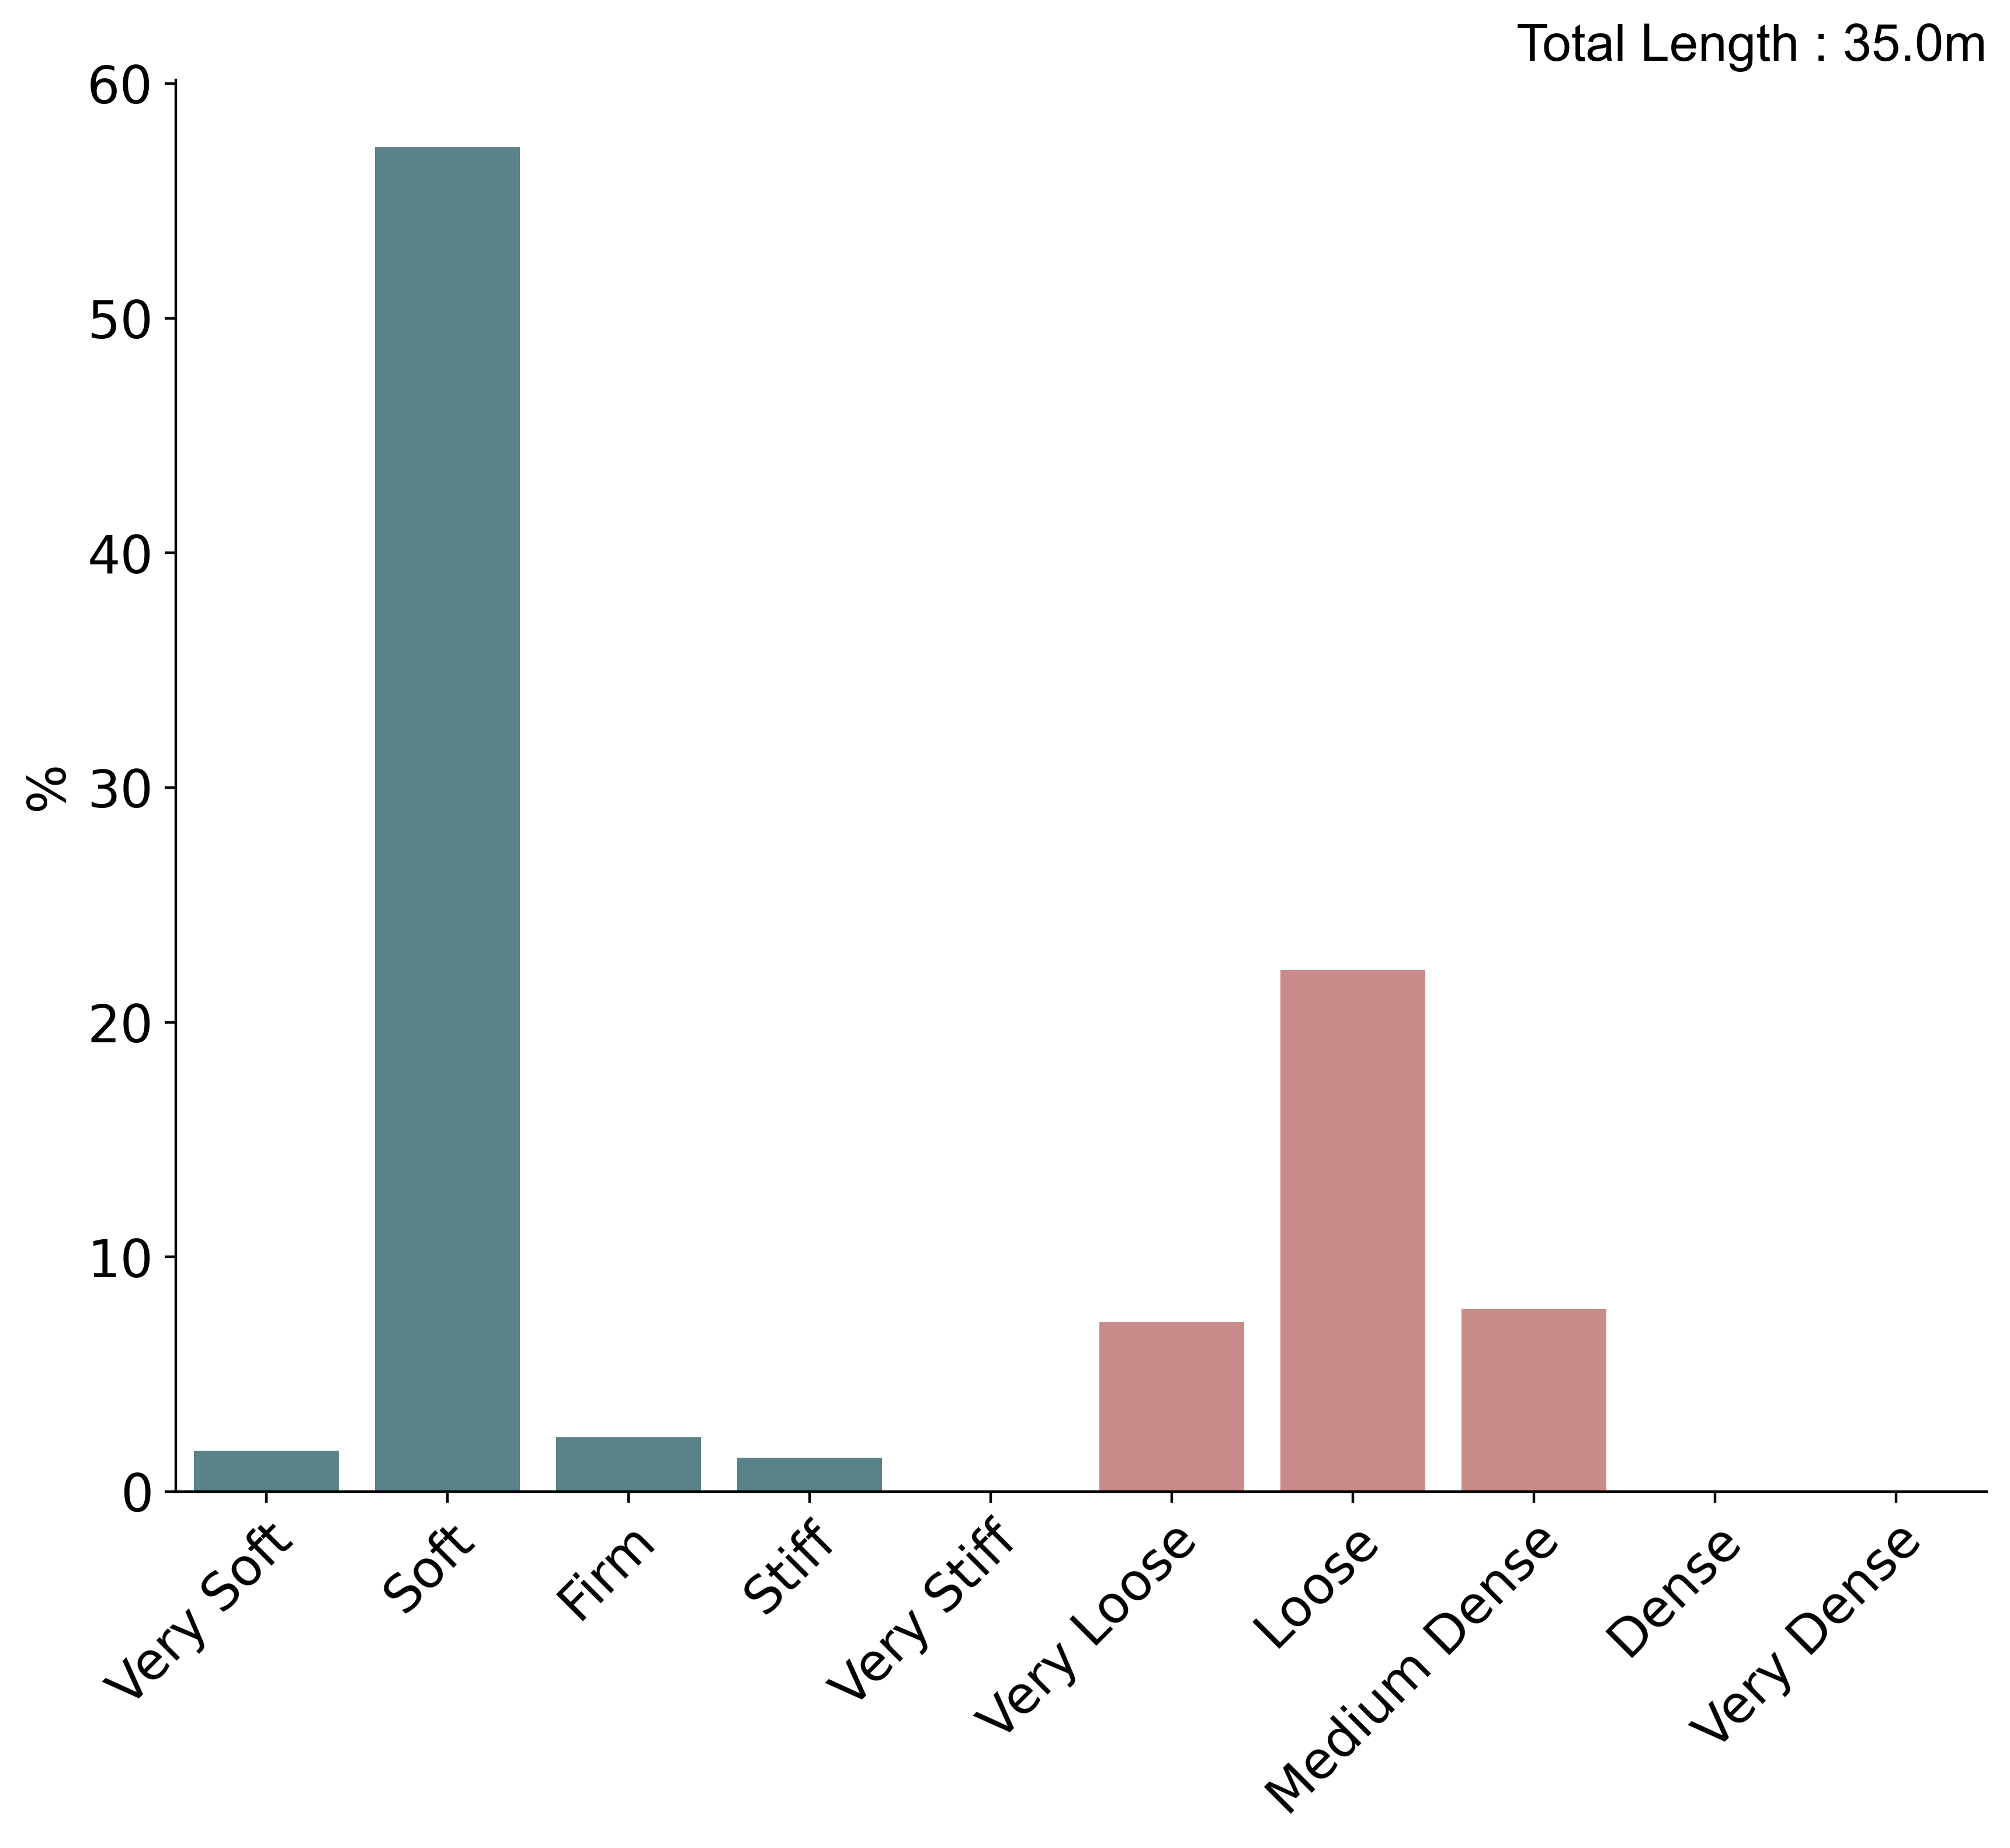
Histogram summarising the consistency and relative density described in exploratory hole logs based on total metres logged. BGS © UKRI.
Geotechnical properties: Classification tests
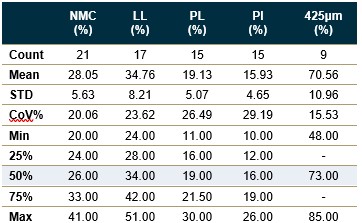
Statistical summaries of geotechnical index properties from laboratory tests. STD – standard deviation; CoV% – coefficient of variation; NMC – natural moisture content; LL – liquid limit; PL – plastic limit; PI – plasticity index; 425 μm – percentage of sample by mass passing 425 μm sieve. Percentiles reported based on sample size; no summaries are provided where there are fewer than 5 samples. BGS © UKRI
Geotechnical properties: classification tests
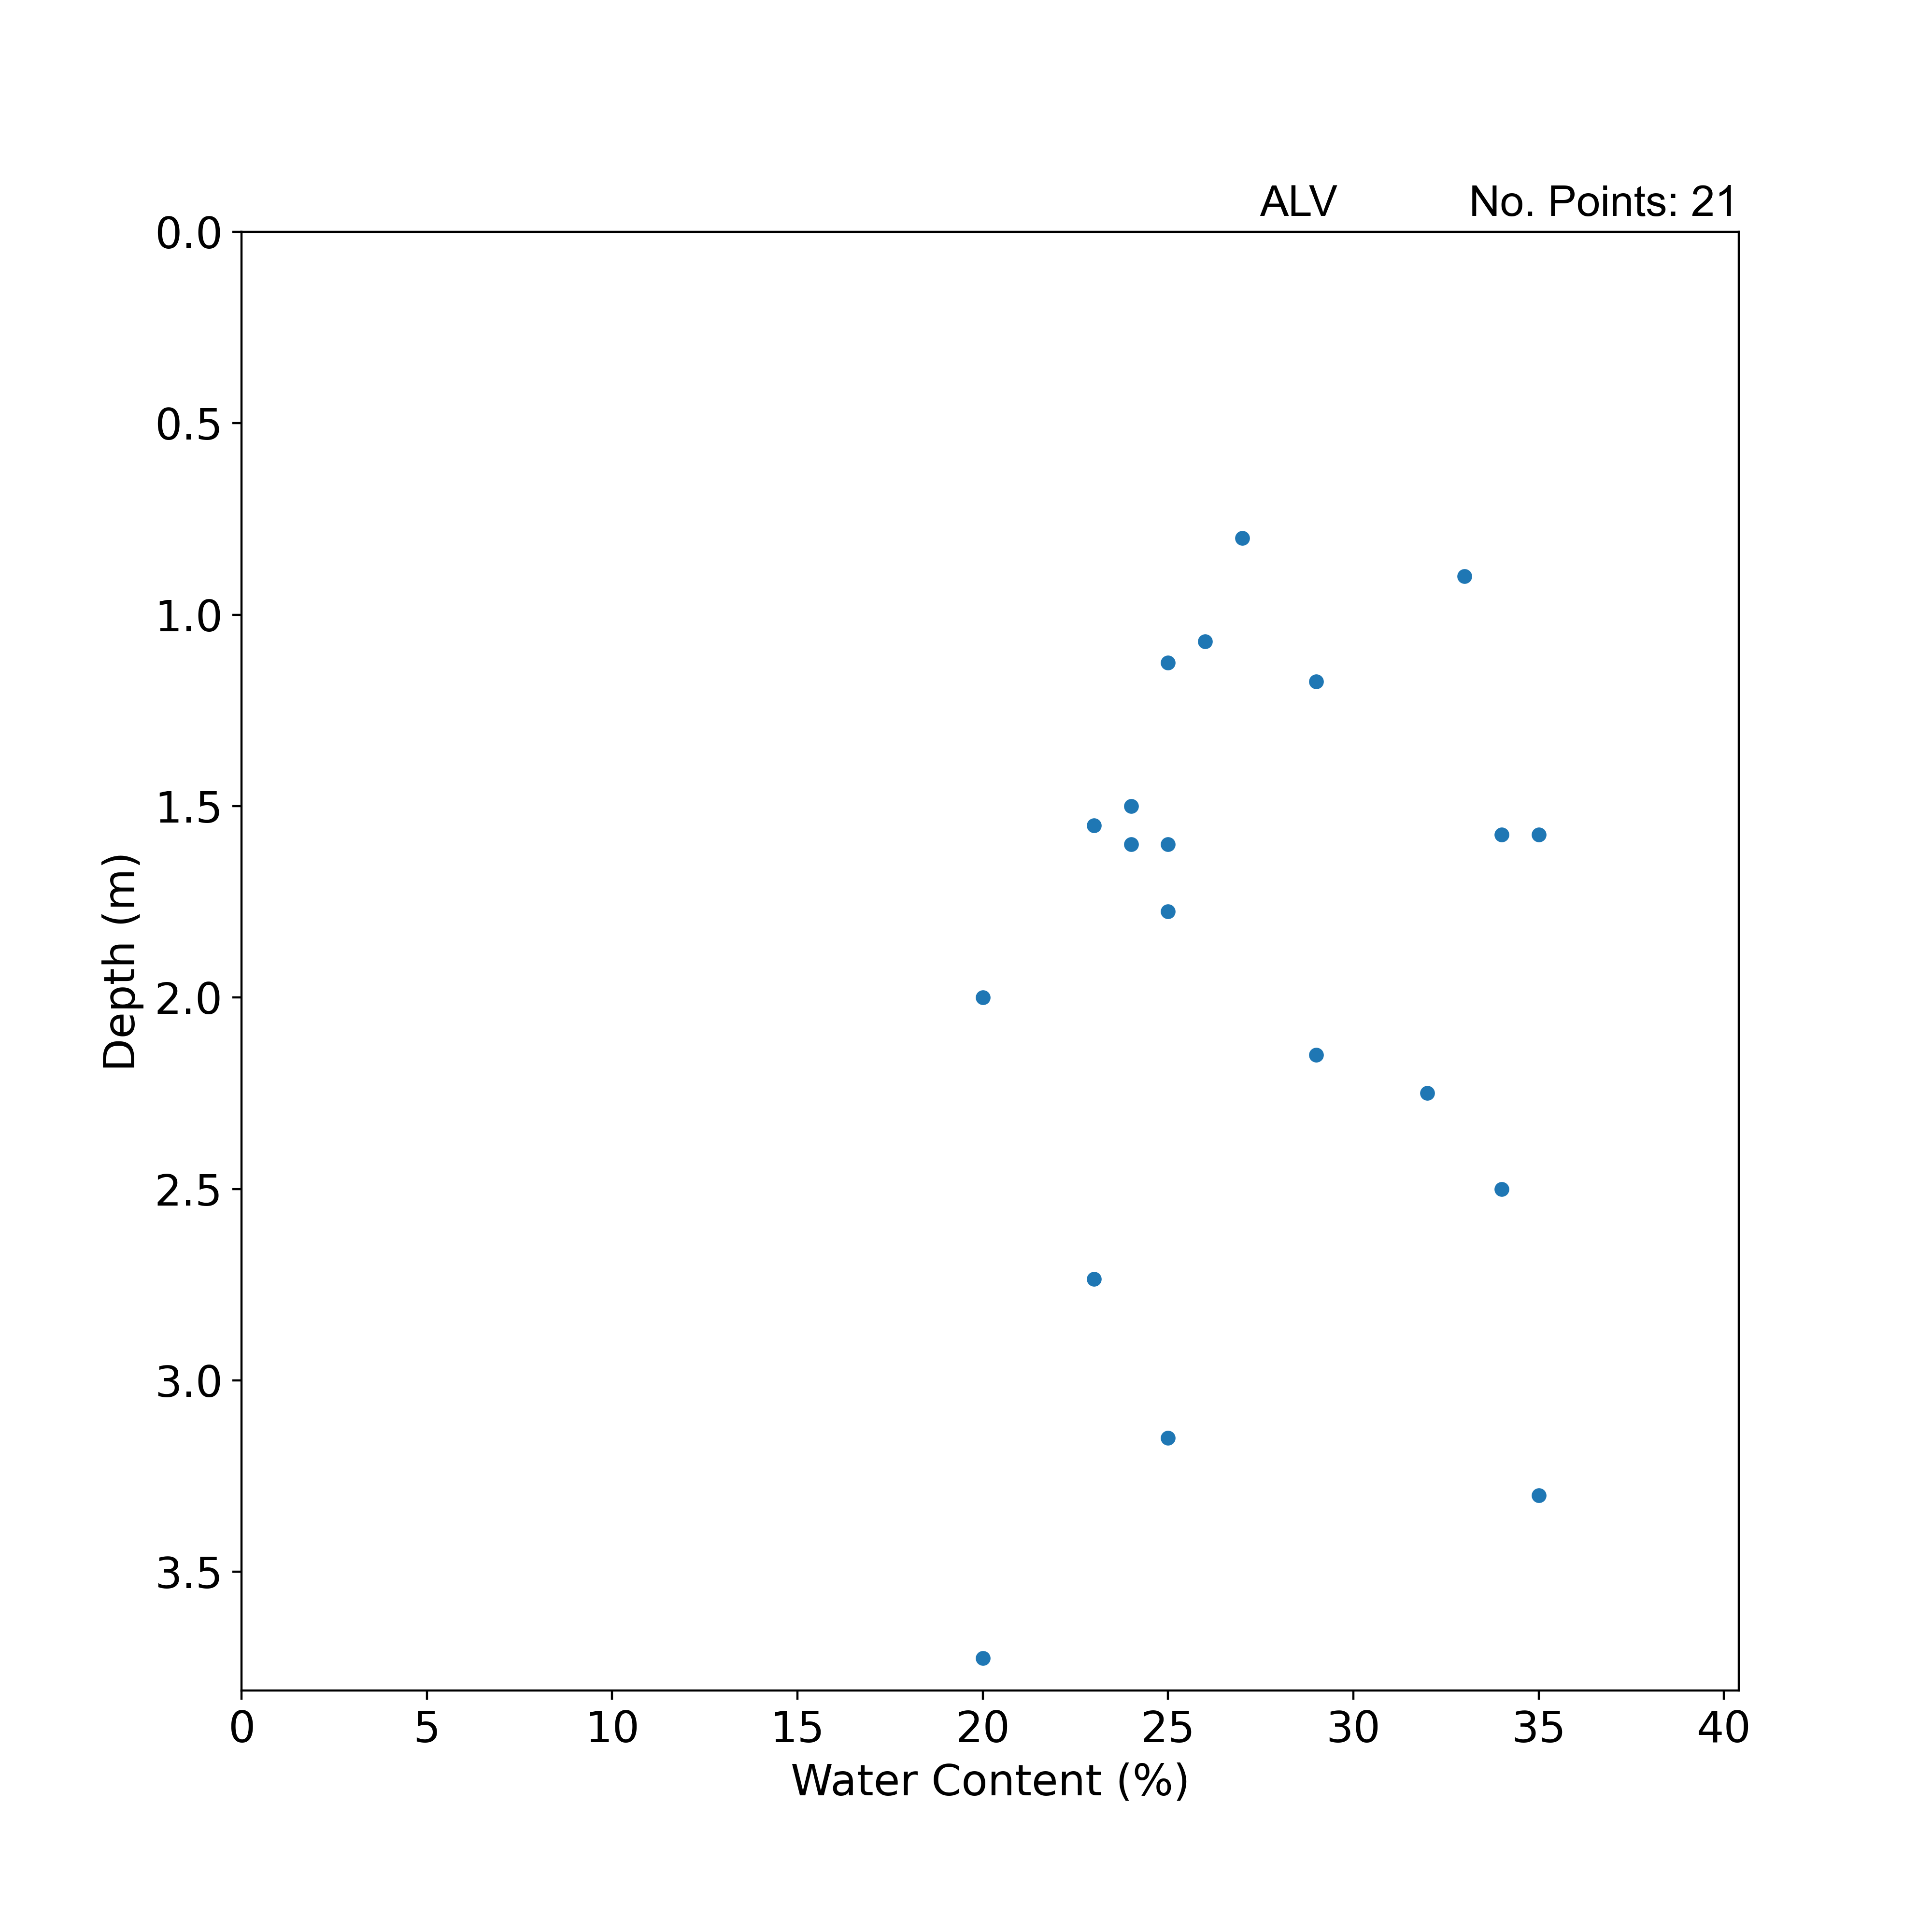
Scatterplot summarising water content with depth. BGS © UKRI.
Geotechnical properties: classification tests
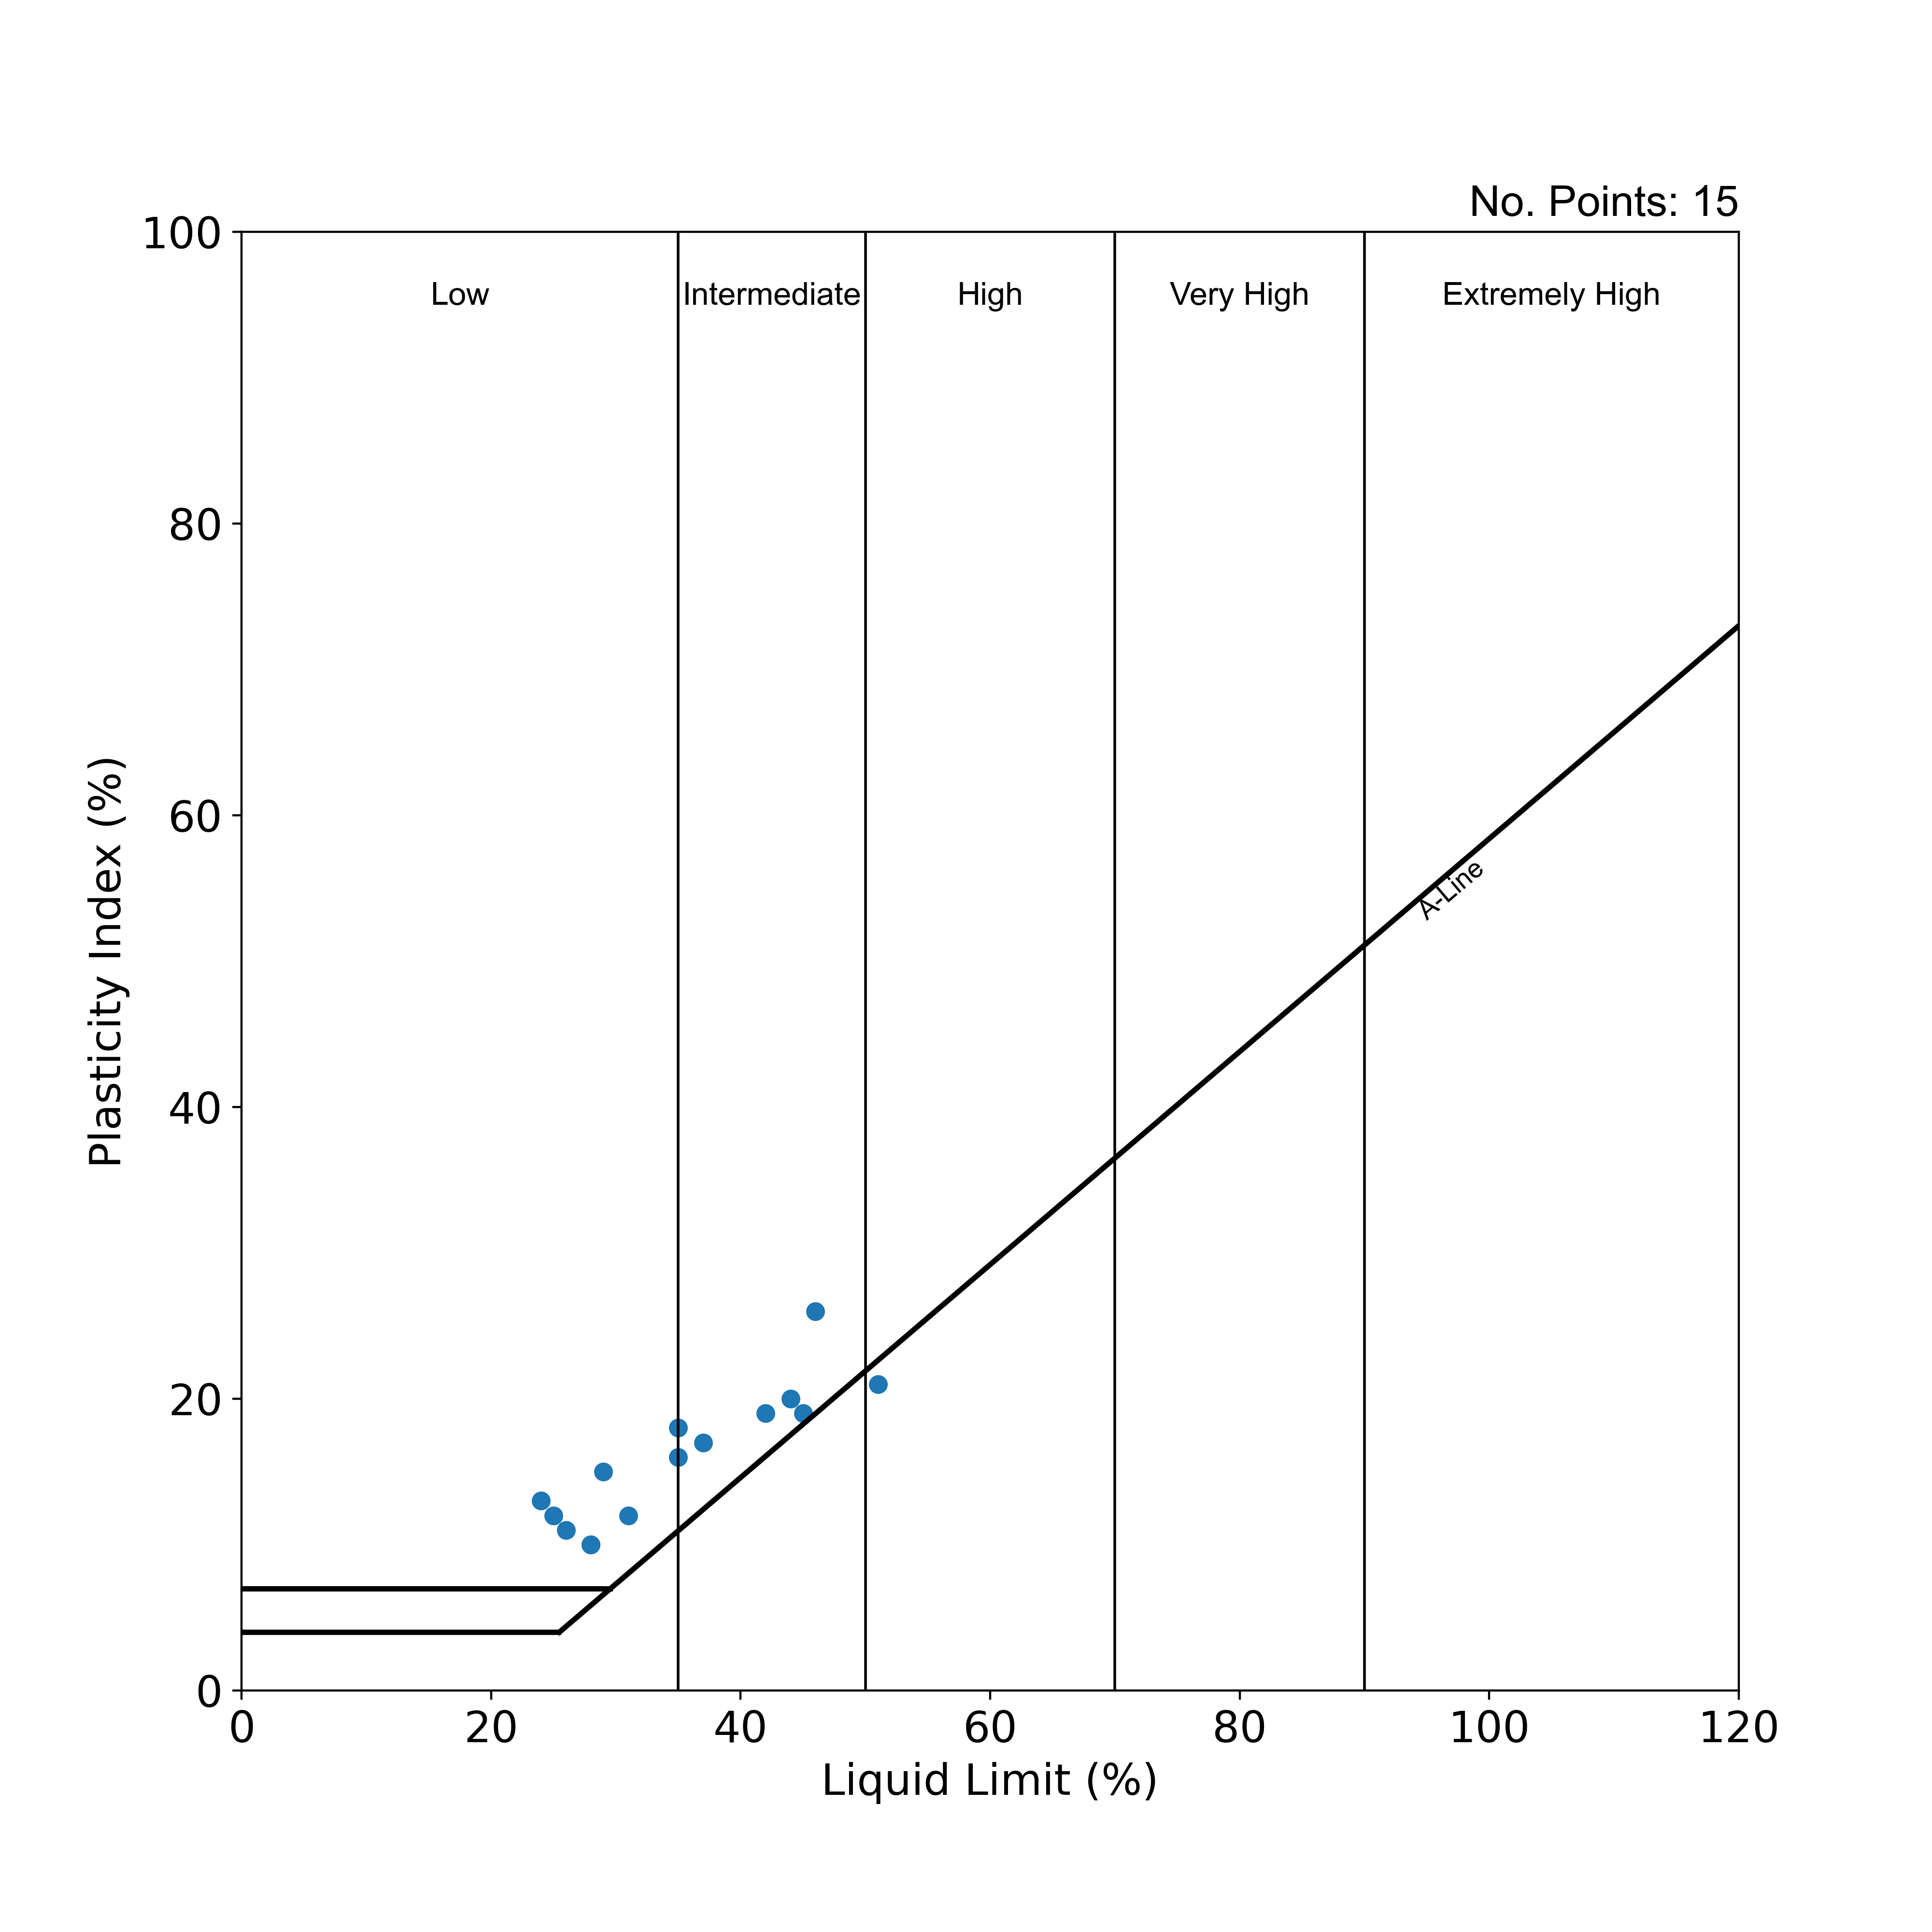
Casagrande plasticity summarising the distribution of plasticity results. BGS © UKRI.
Geotechnical properties: strength tests
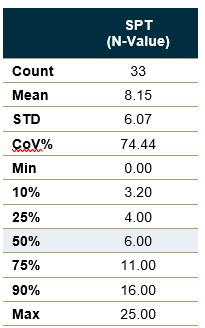
Statistical summaries of geotechnical strength properties from laboratory and in situ tests. STD – standard deviation; CoV% – coefficient of variation; SPT – standard penetration test (number of tests with N-value > 50 or with no N-value = 1); IVAN – in situ vane shear test undrained shear strength . Percentiles reported based on sample size; no summaries are provided where there are fewer than 5 samples. BGS © UKRI.
Geotechnical properties: strength tests
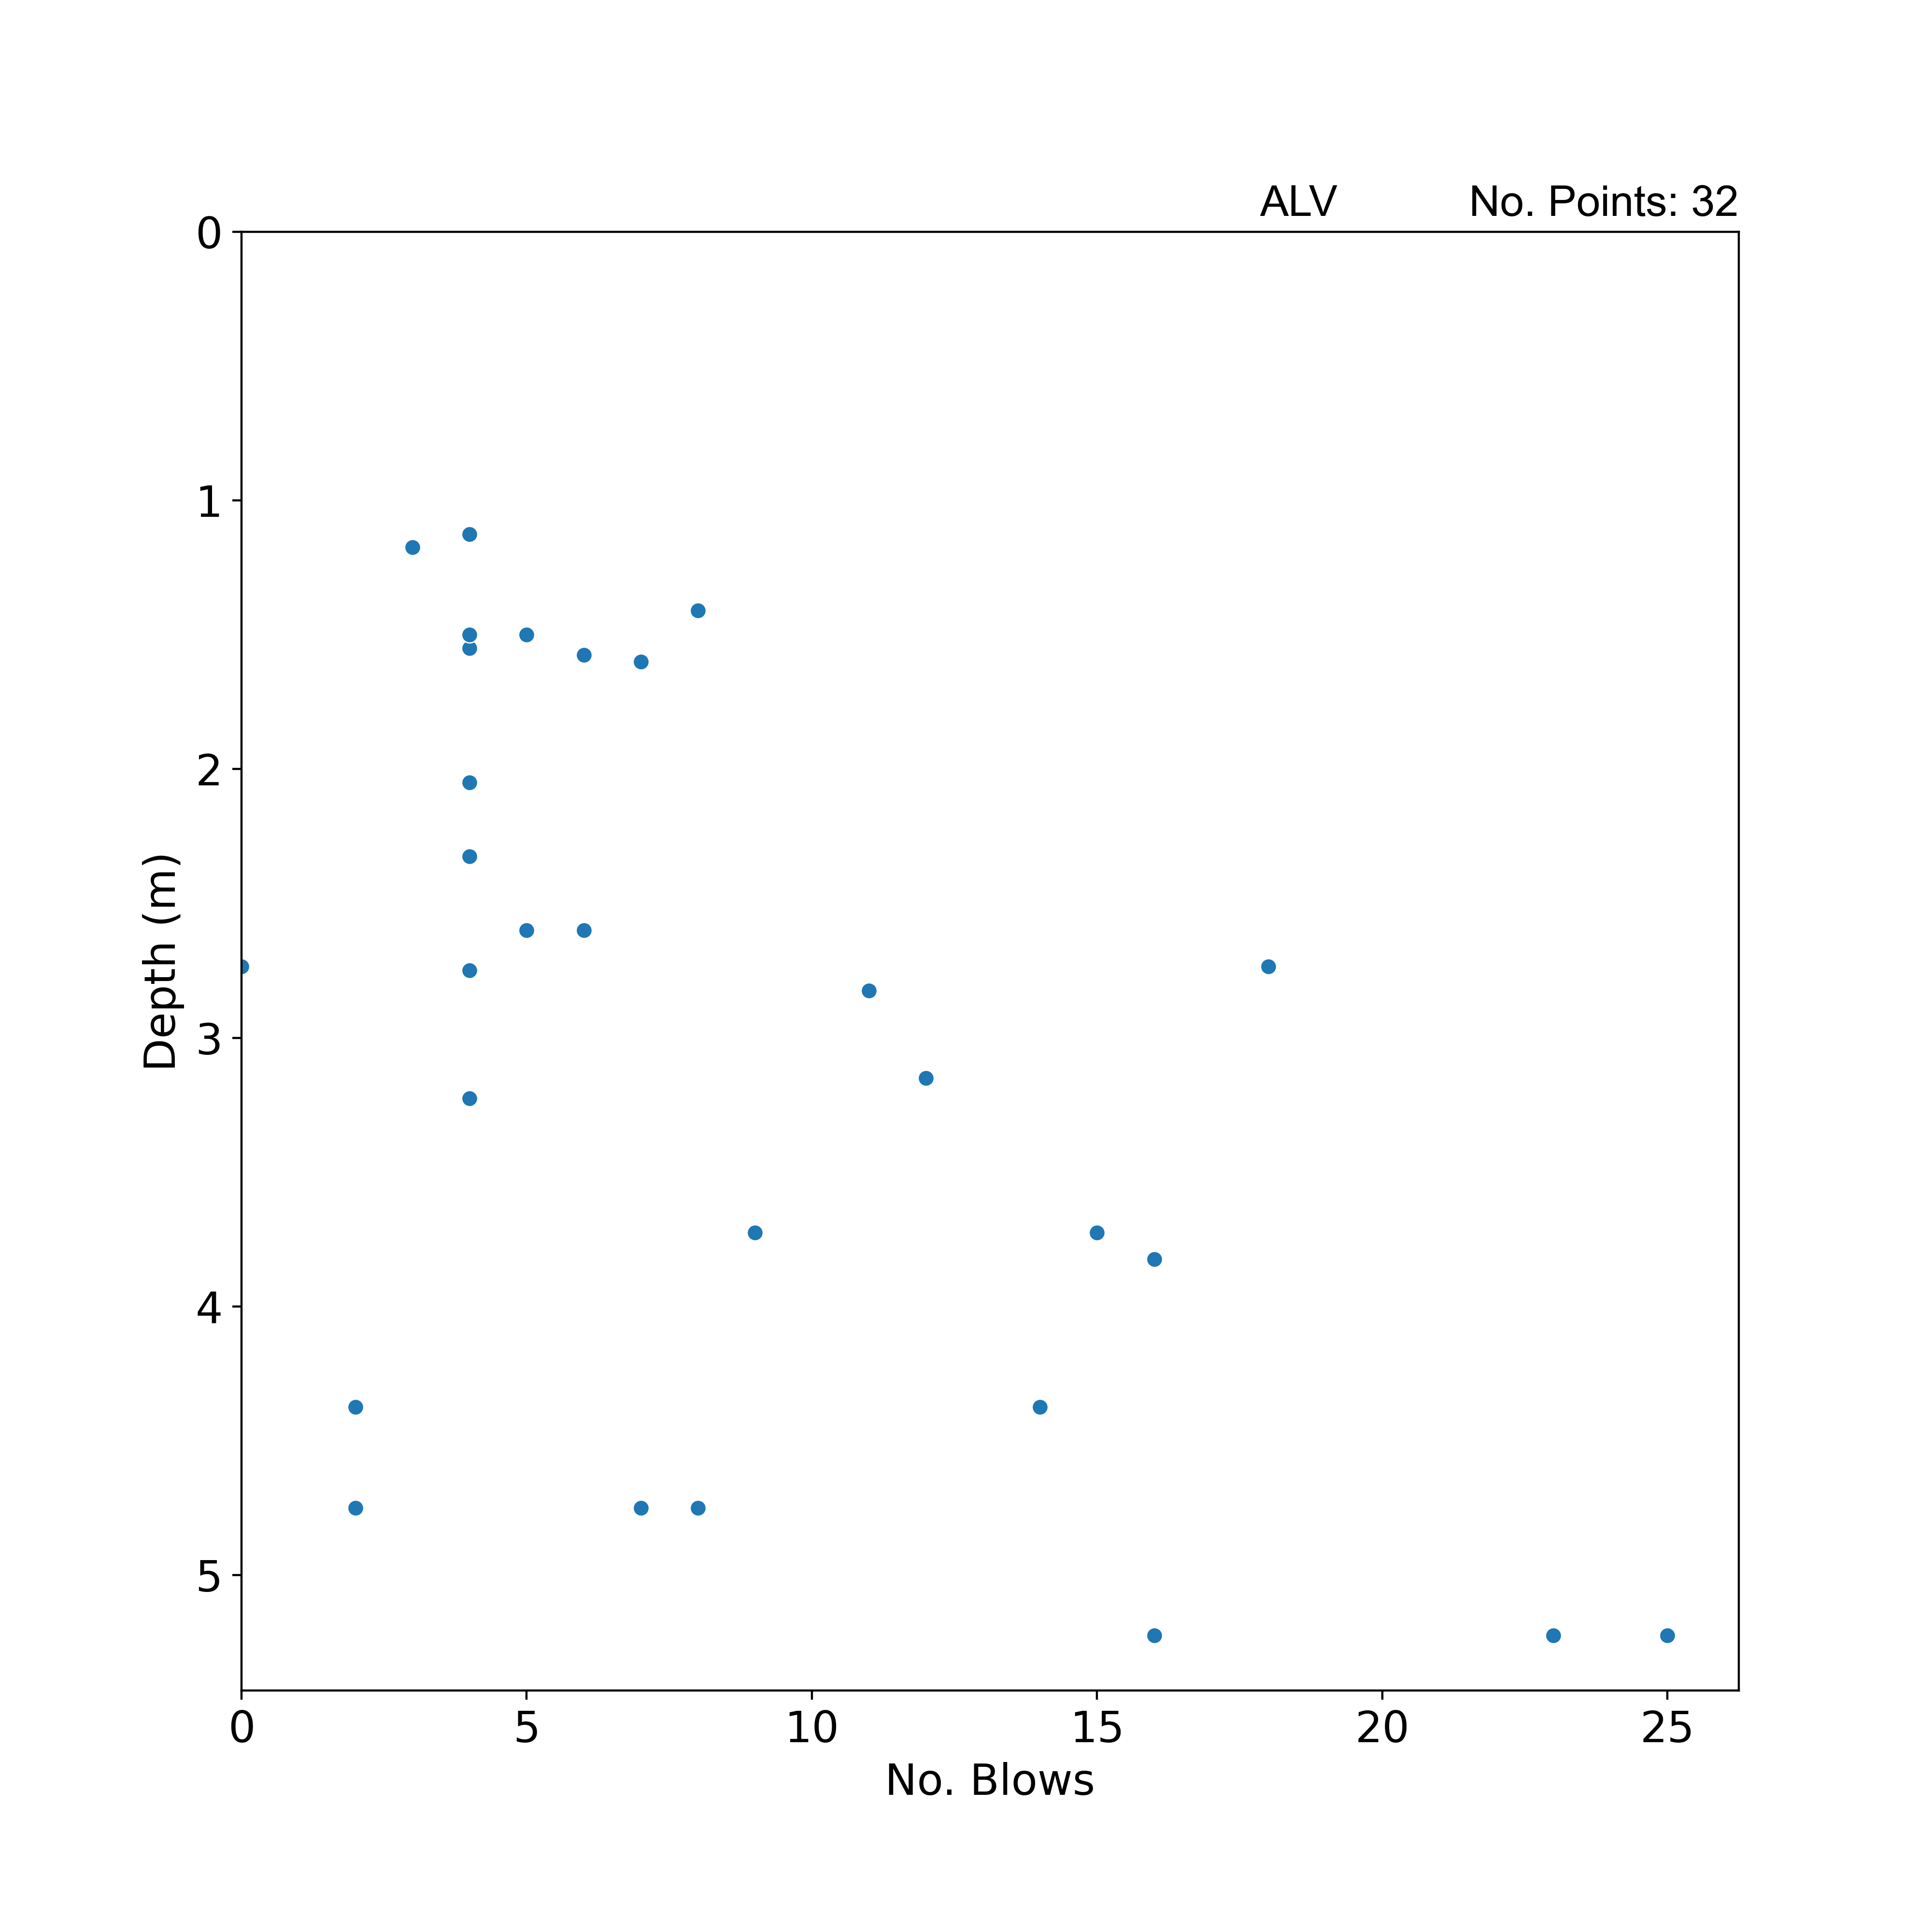
Scatterplot summarising SPT N-value results with depth. Number of tests with N-value > 50 or with no N-value = 1. BGS © UKRI.
Broomhouse Sand and Gravel Formation (BHSE)
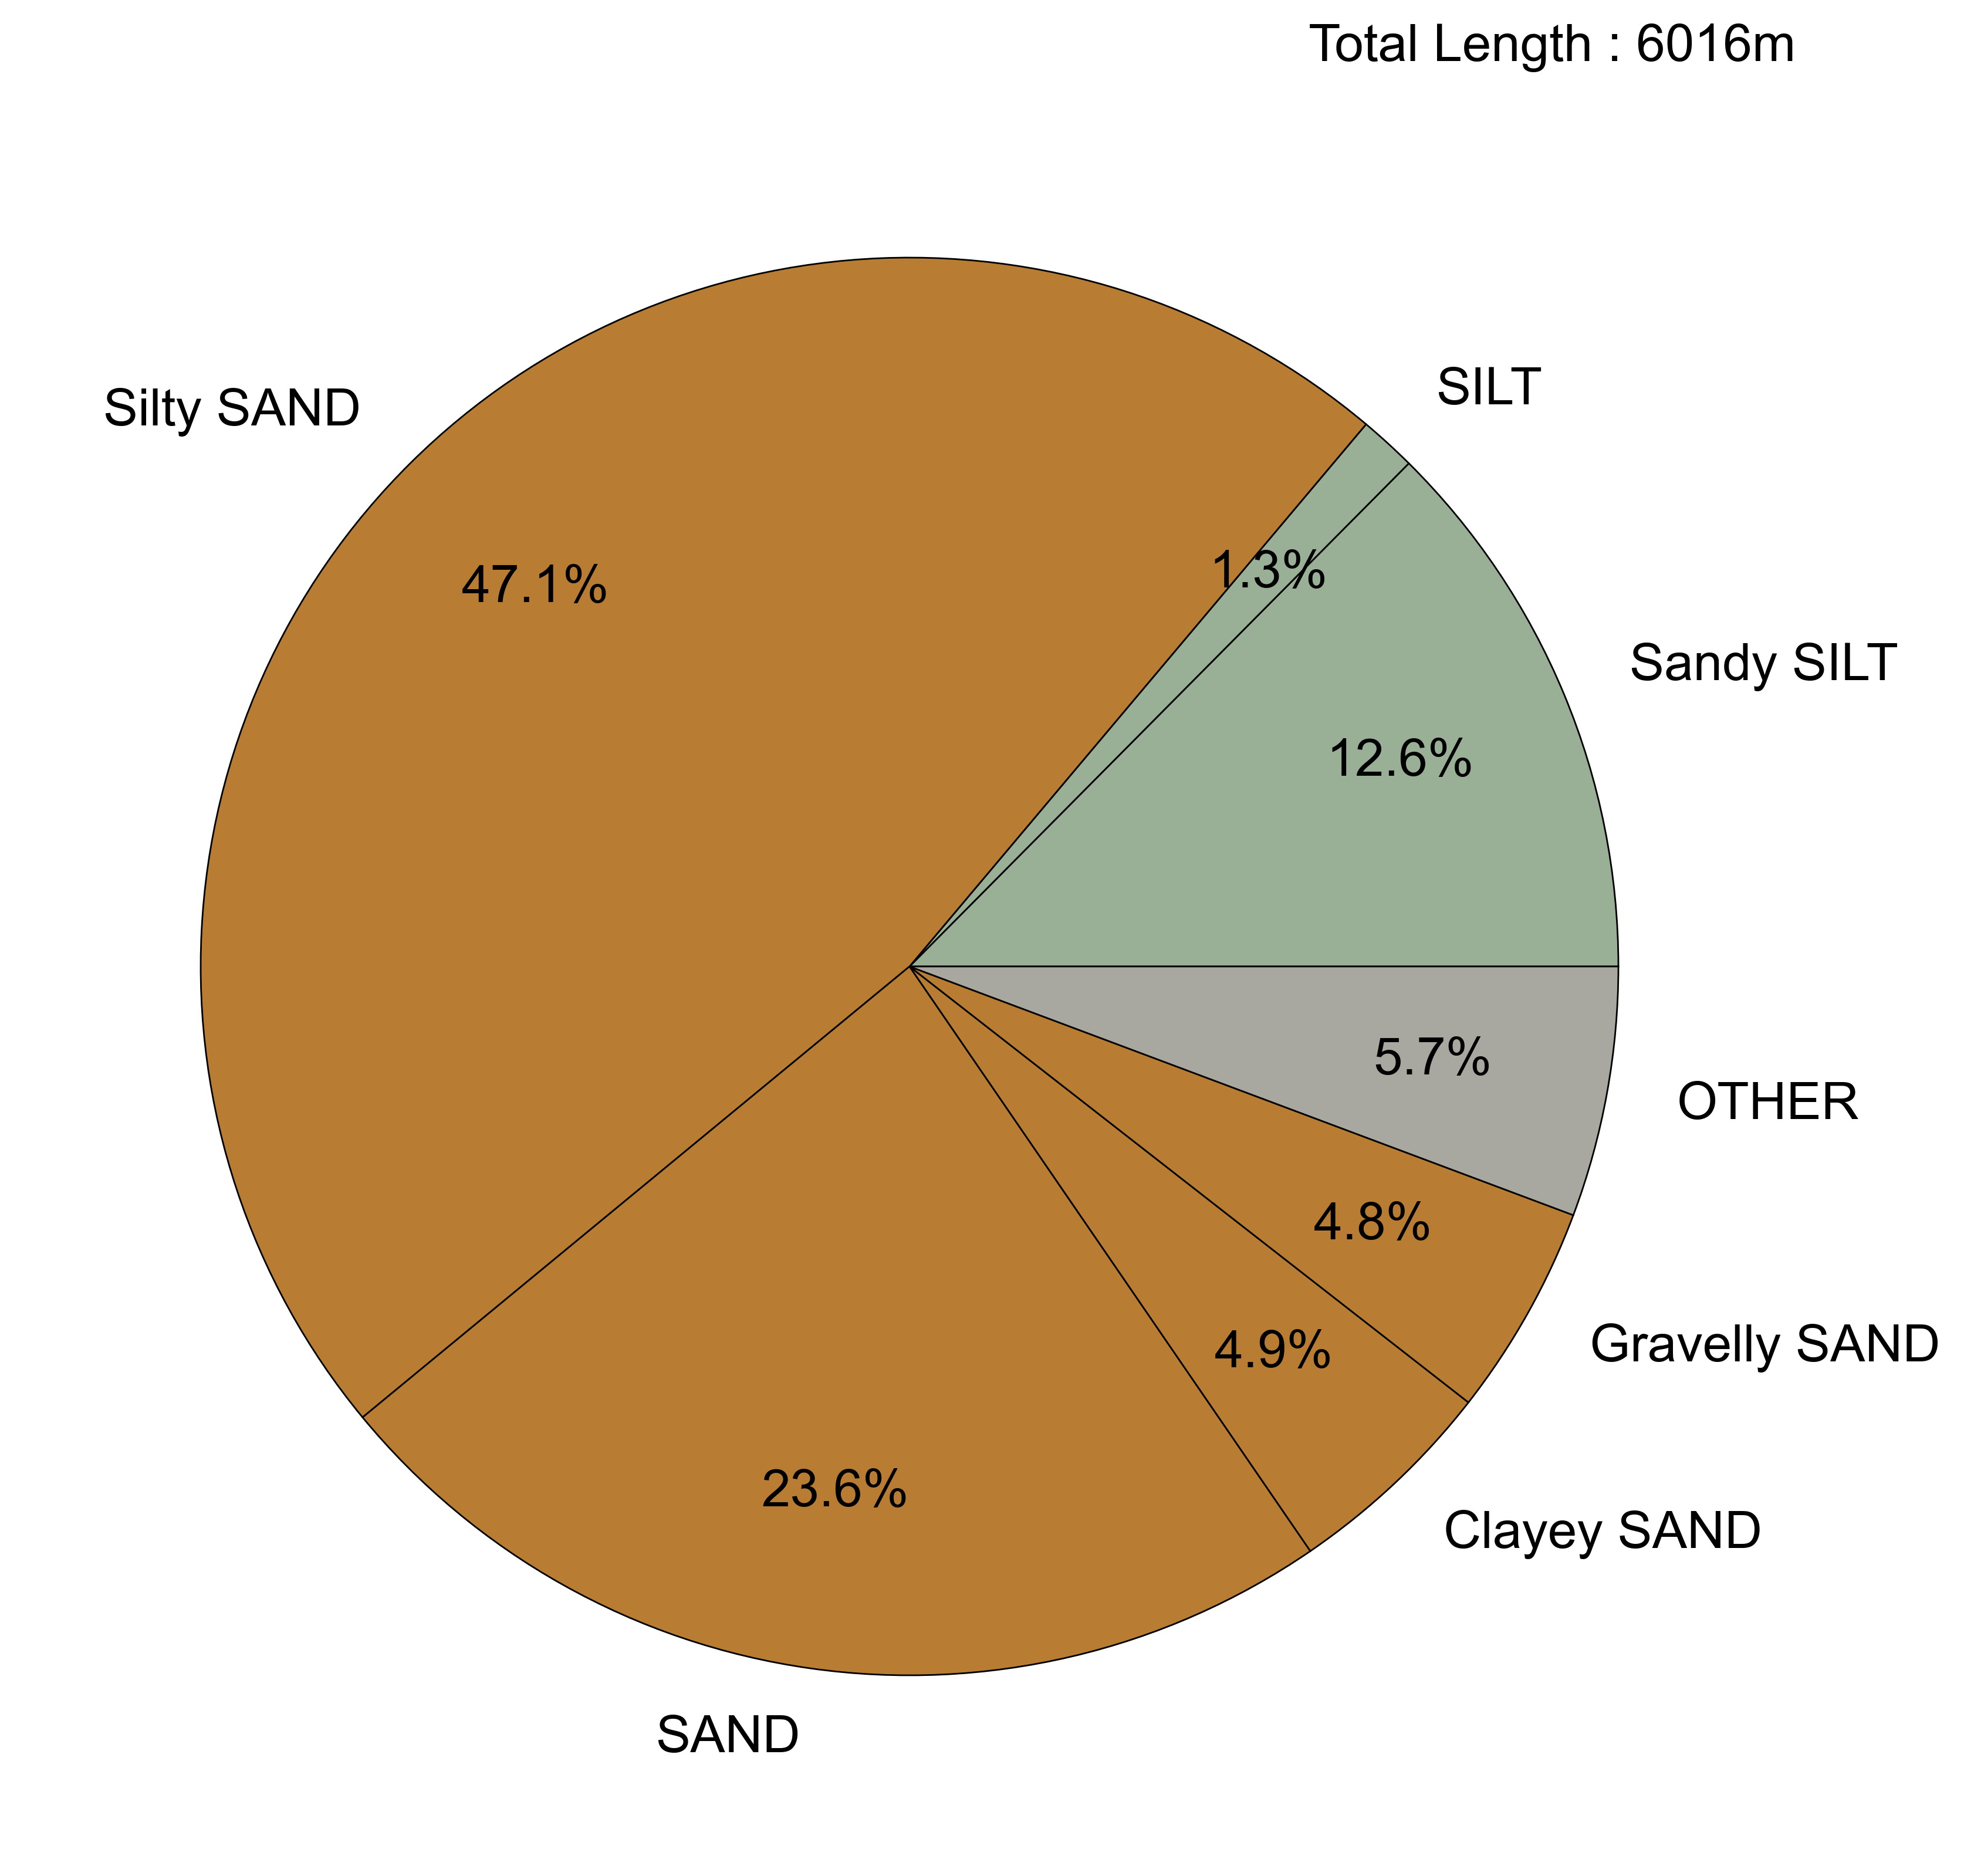
Geological descriptions
Pie chart summarising the dominant soil types (primary and secondary constituents) described in exploratory hole logs based on total metres logged. Descriptions have been simplified to remove tertiary constituents and a threshold of 1 per cent applied to aid graphical presentation. Soil types representing less than 1 per cent of the total logged are included in the ‘other’ category. BGS © UKRI.
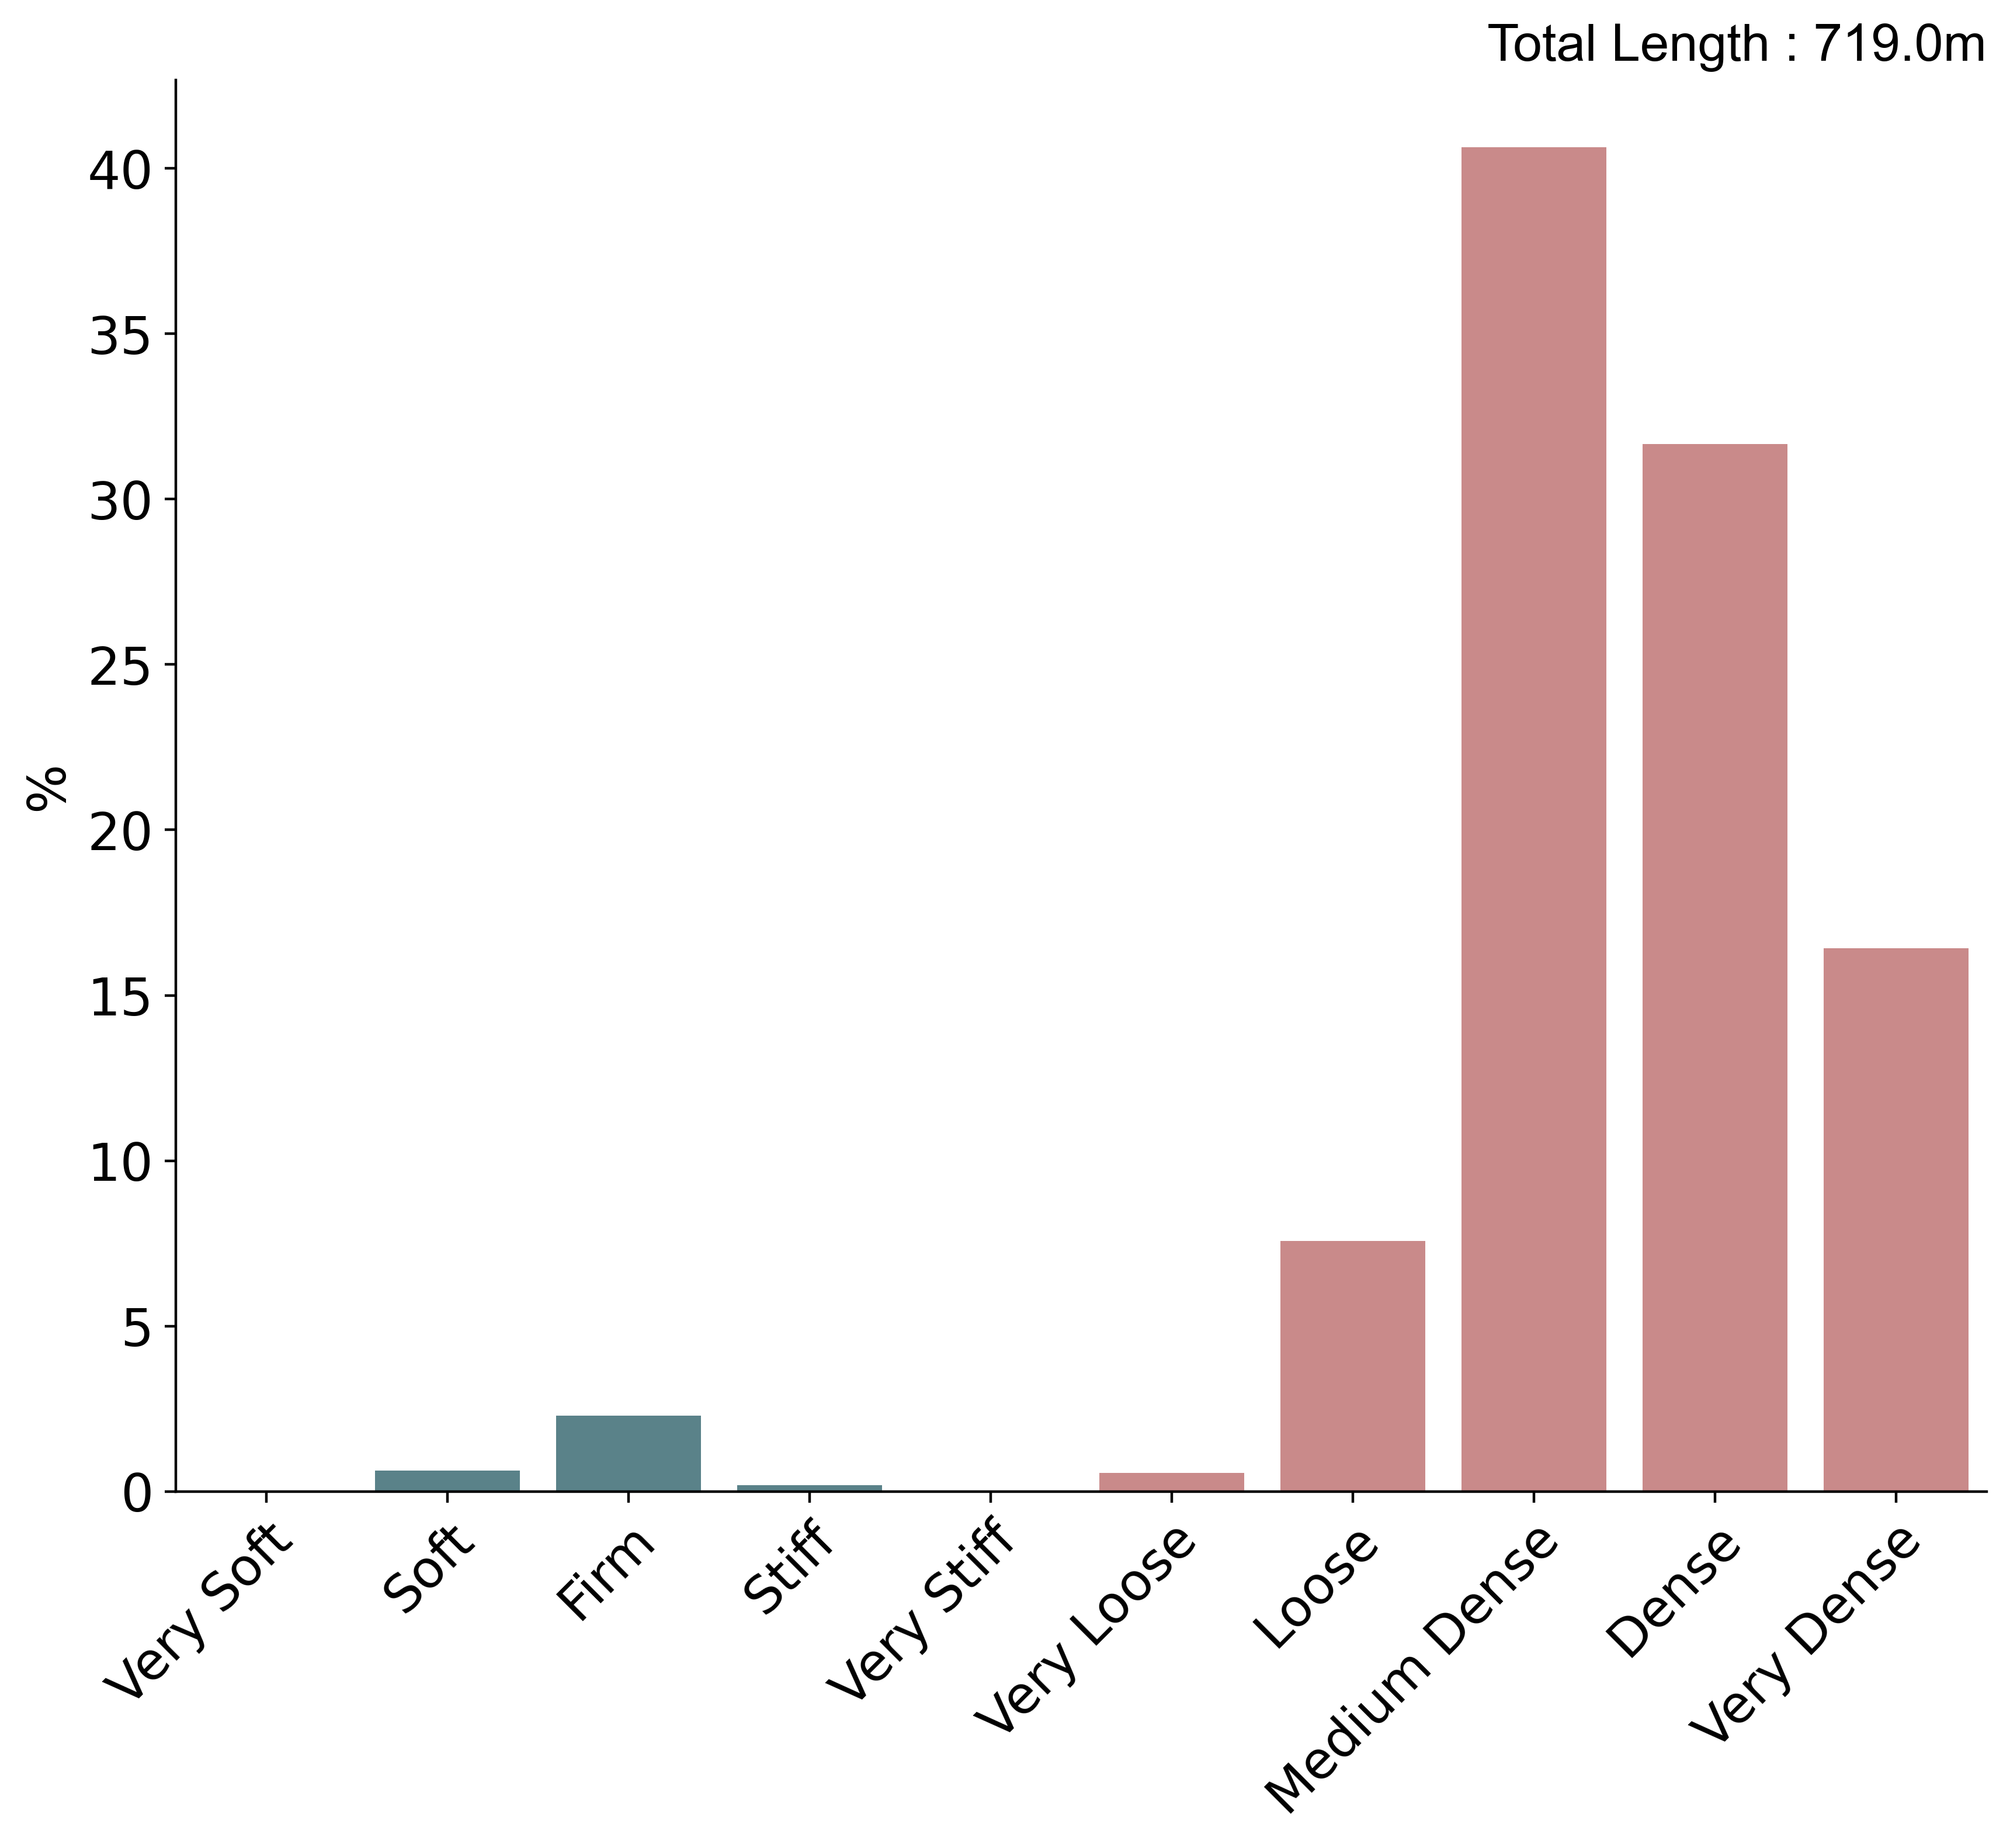
Geological descriptions
Histogram summarising the consistency and relative density described in exploratory hole logs based on total metres logged. BGS © UKRI
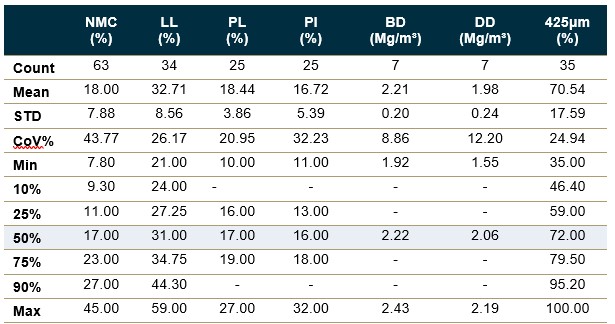
Geotechnical properties: classification tests
Statistical summaries of geotechnical index properties from laboratory tests. STD – standard deviation; CoV% – coefficient of variation; NMC – natural moisture content; LL – liquid limit; PL – plastic limit; PI – plasticity index; BD – bulk density; DD – dry density; 425 μm – percentage of sample by mass passing 425 μm sieve. Percentiles reported based on sample size; no summaries are provided where there are fewer than 5 samples. BGS © UKRI
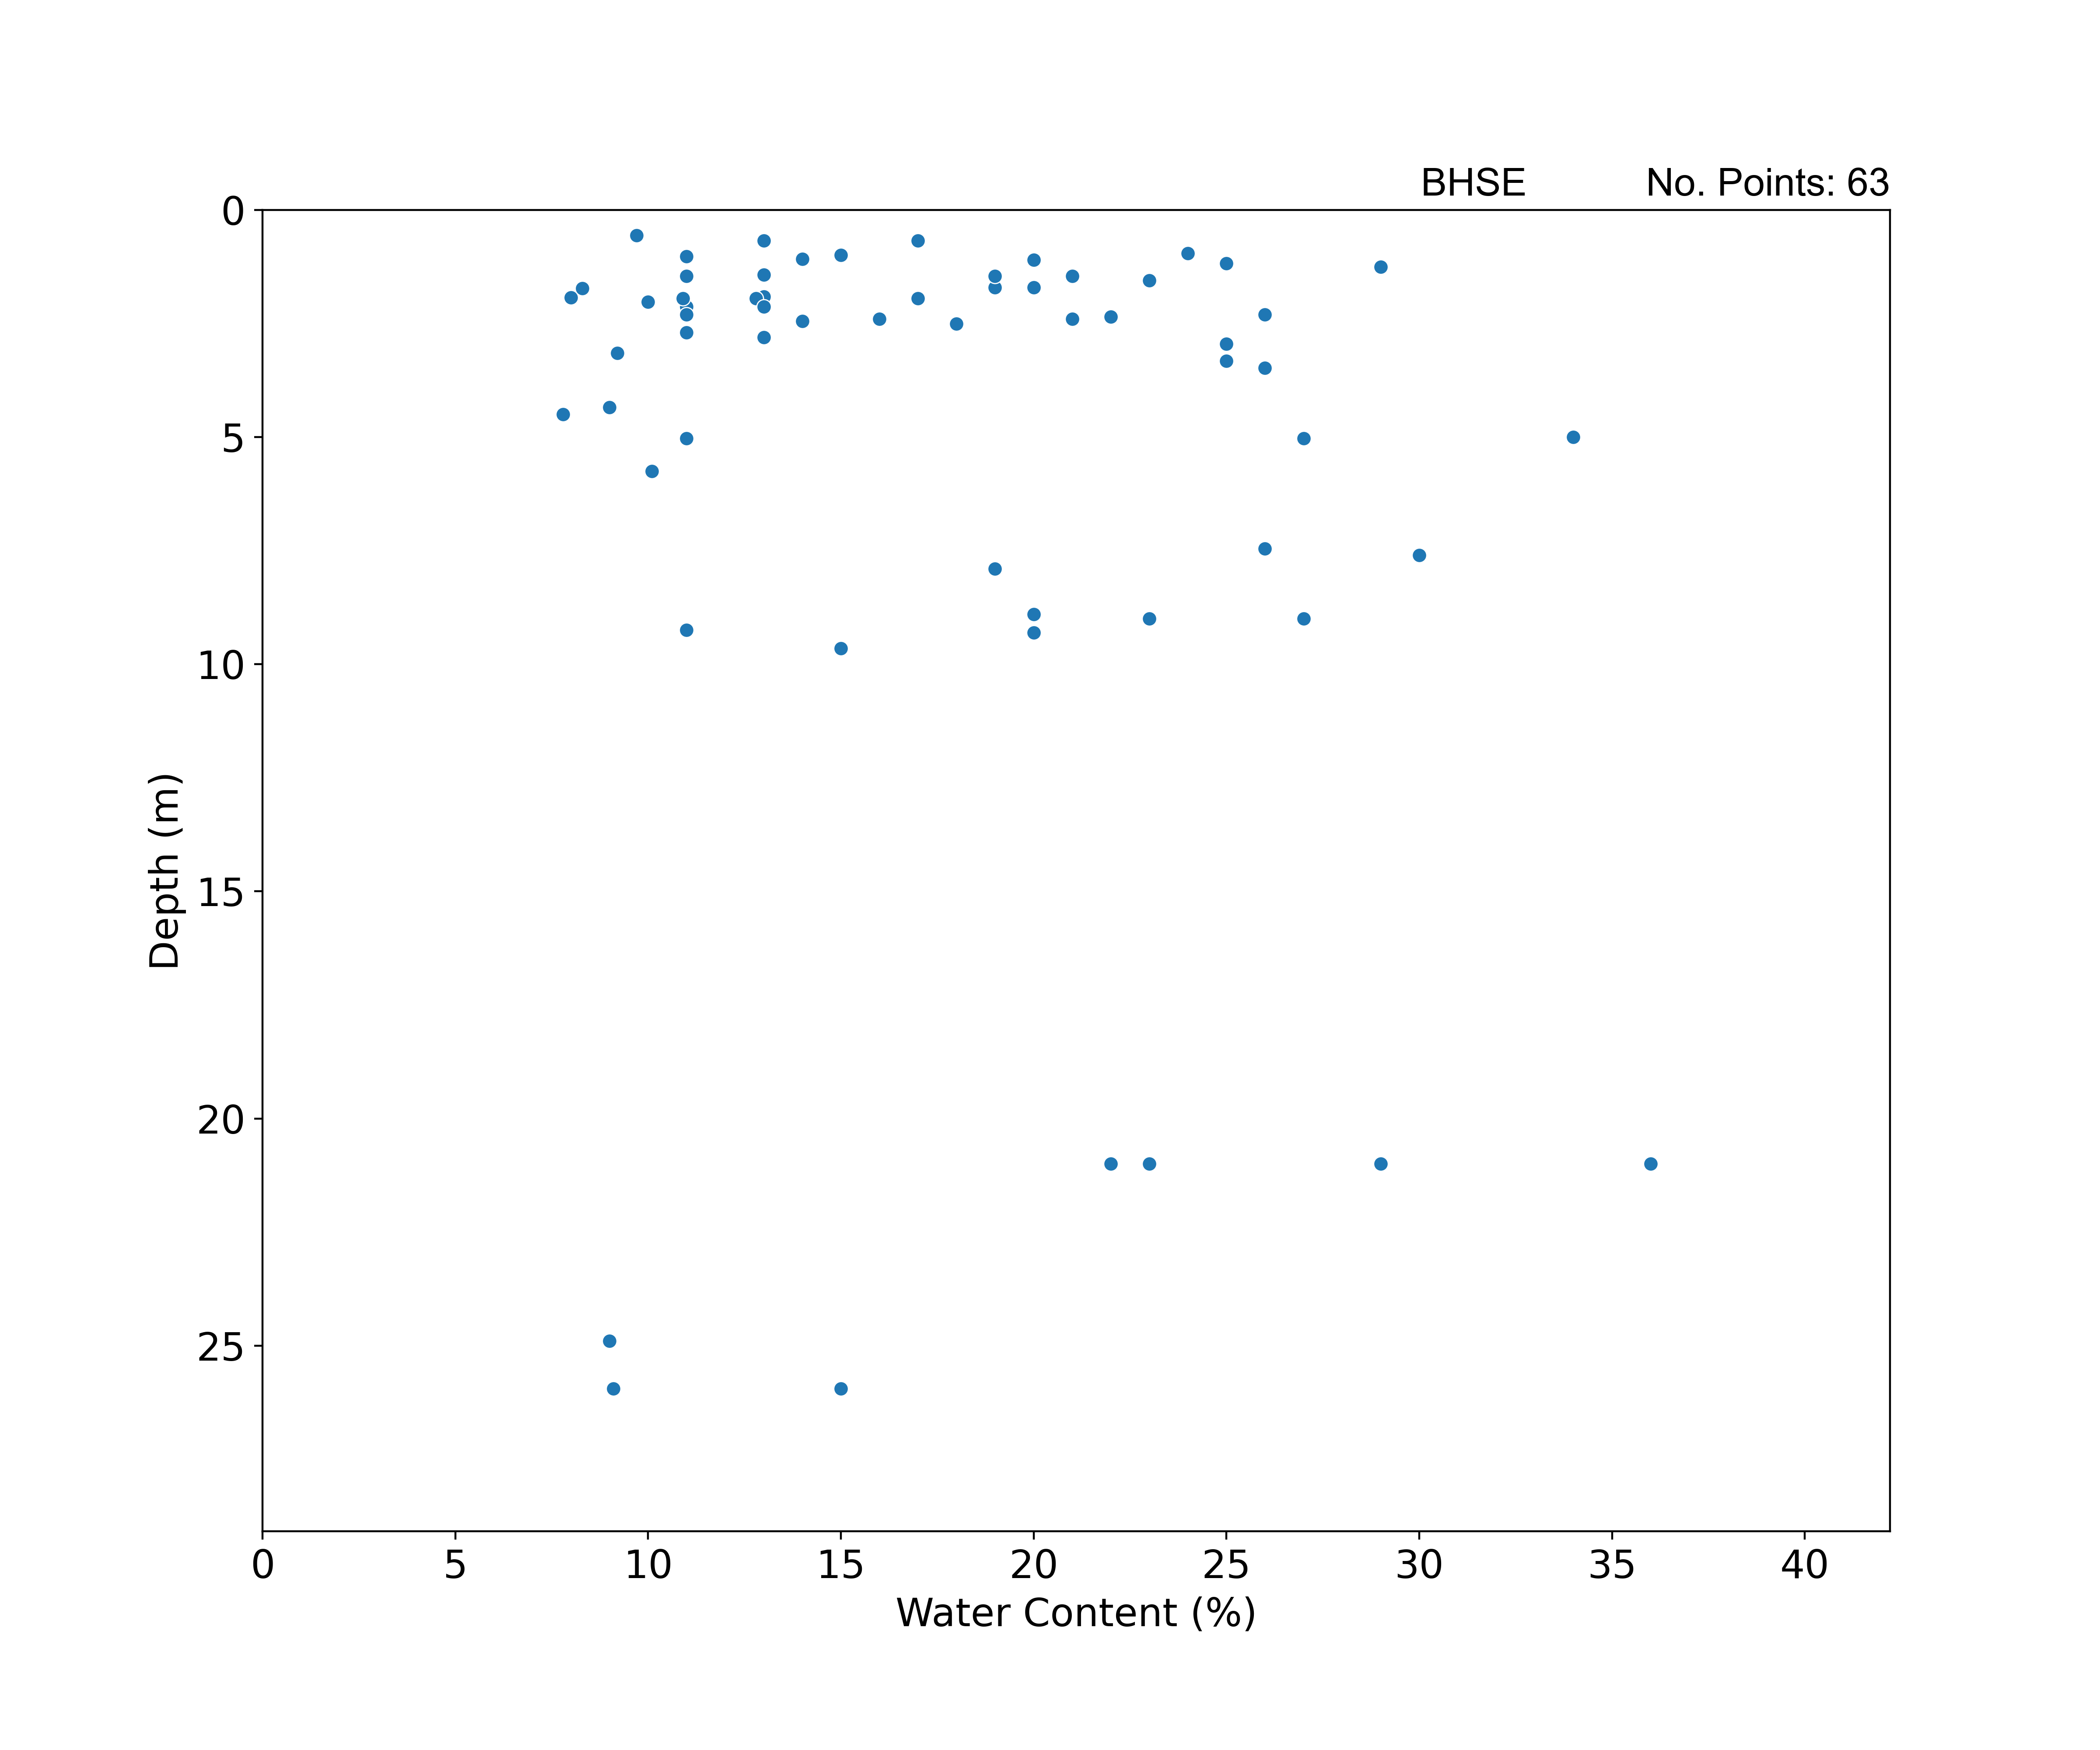
Geotechnical properties: classification tests
Scatterplot summarising water content with depth. BGS © UKRI.
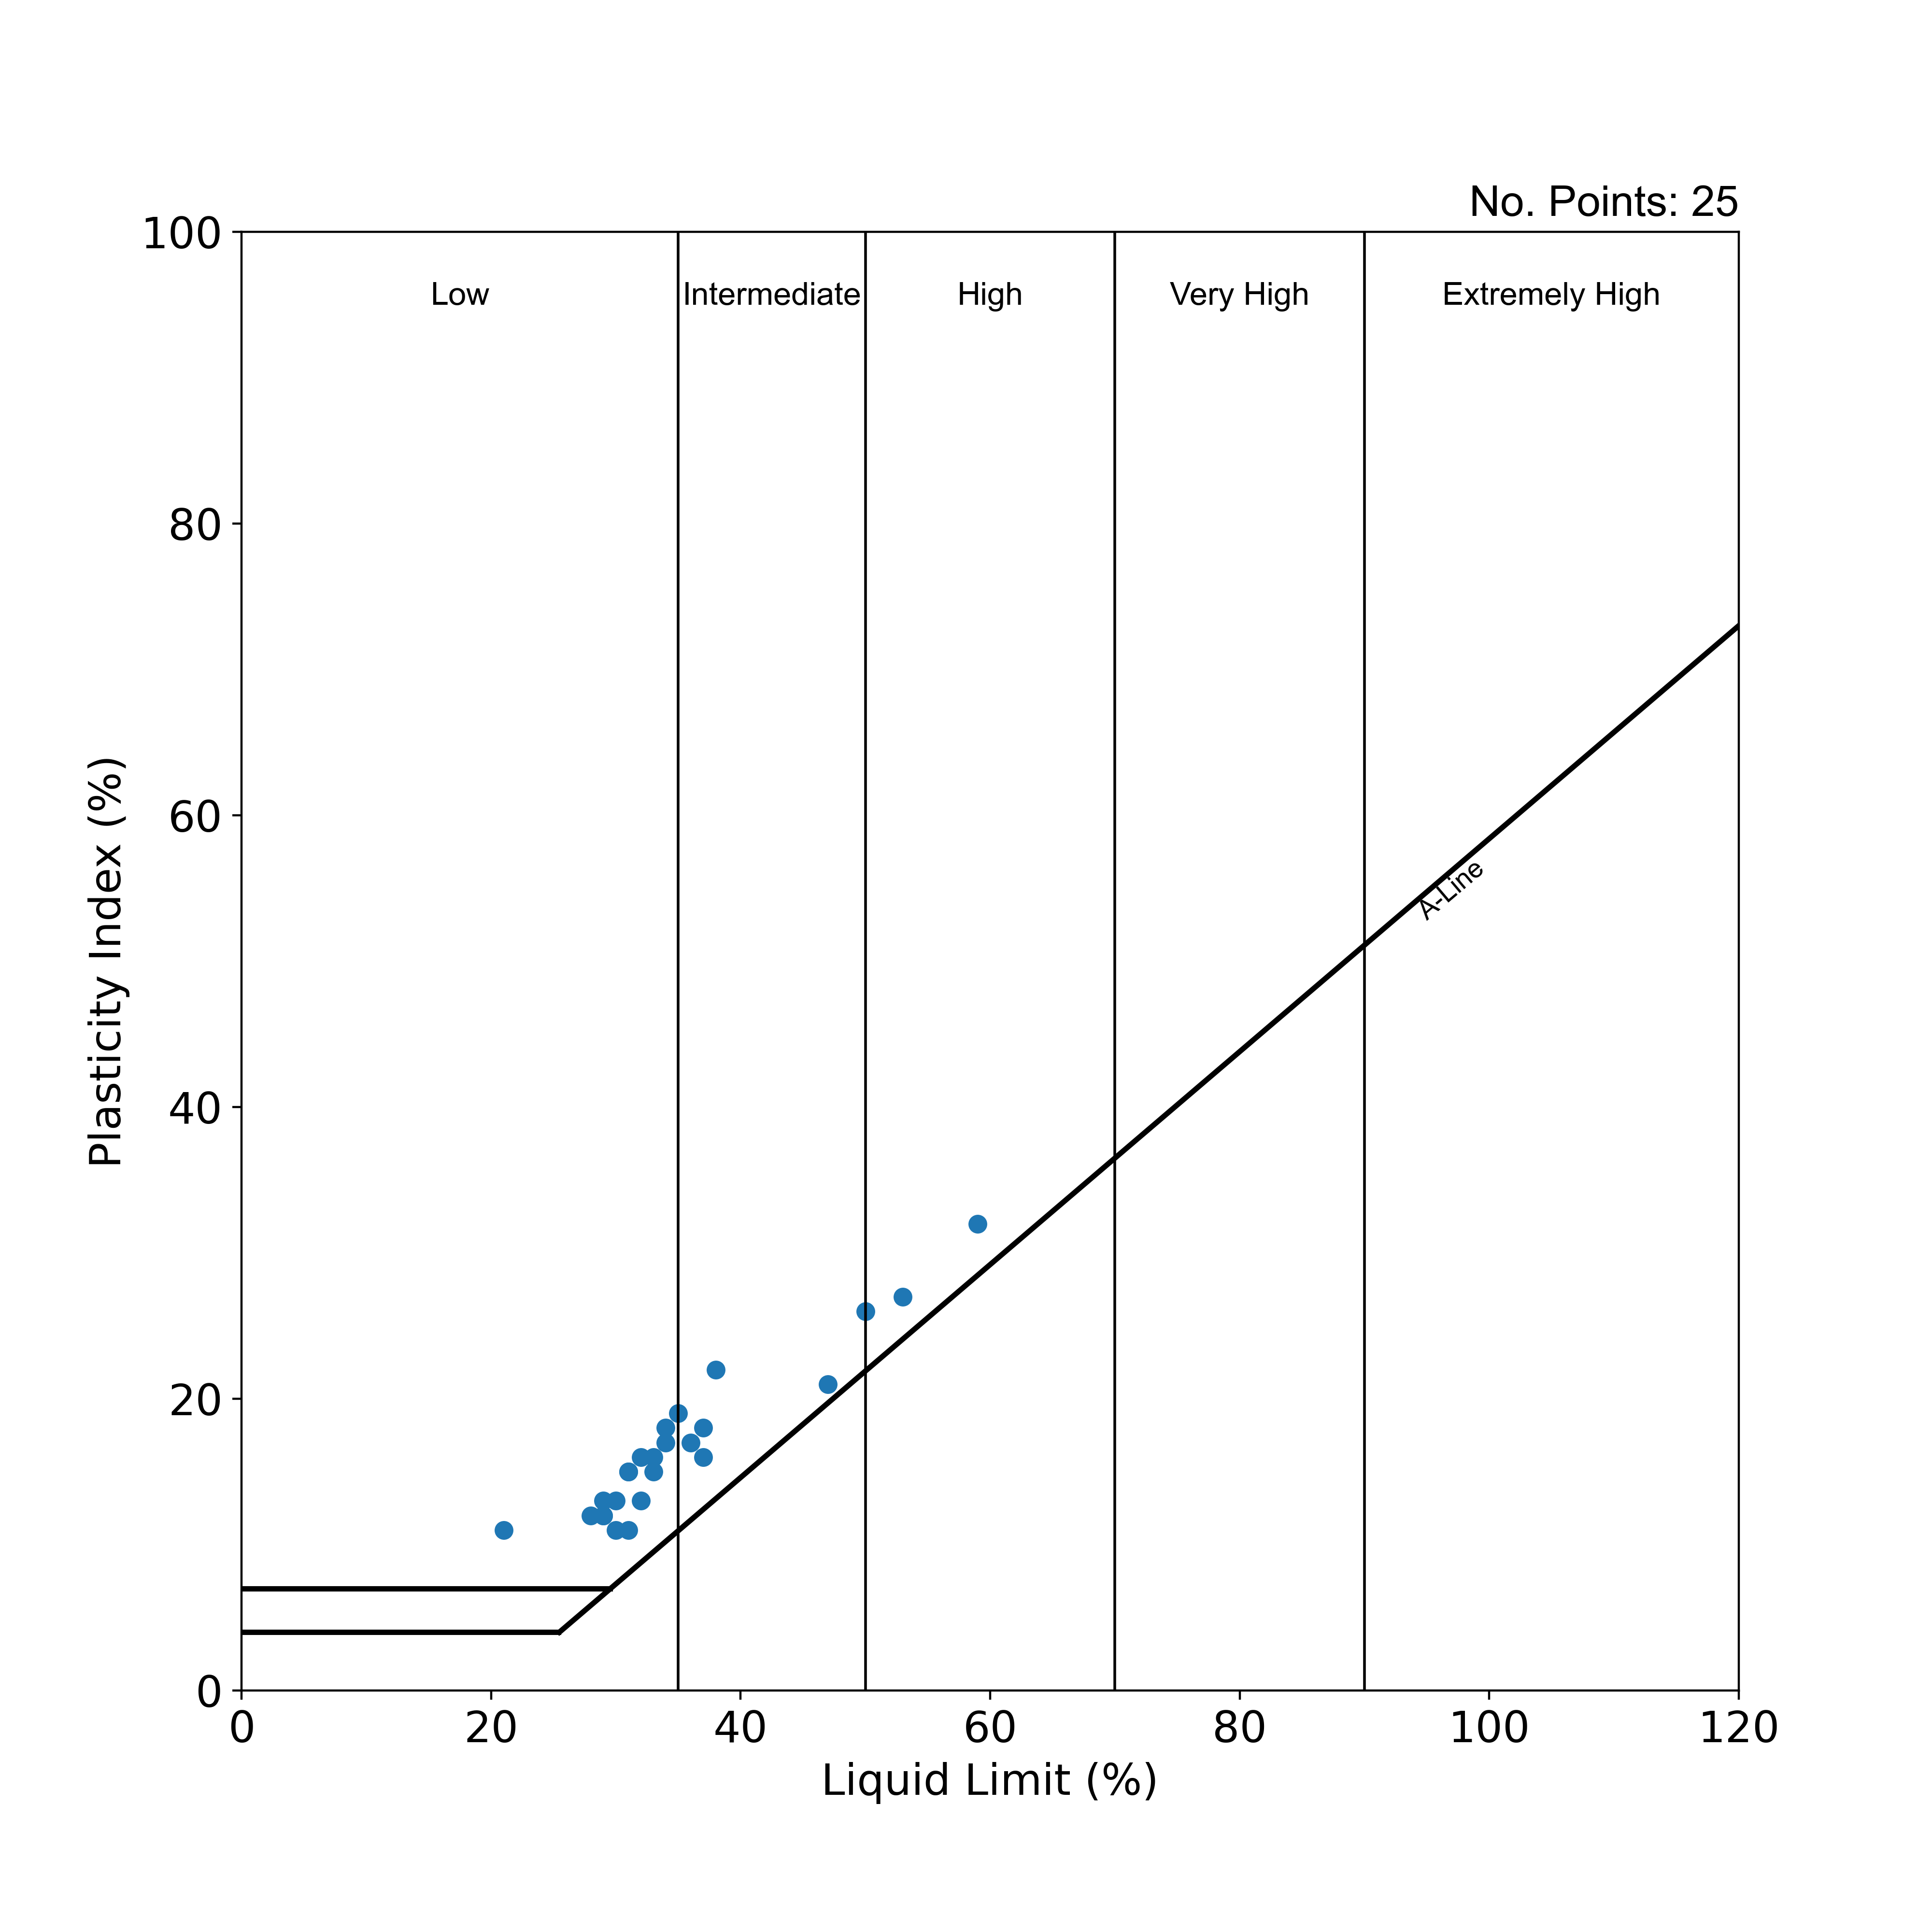
Geotechnical properties: classification tests
Casagrande plasticity summarising the distribution of plasticity results. BGS © UKRI.
Geotechnical properties: strength tests
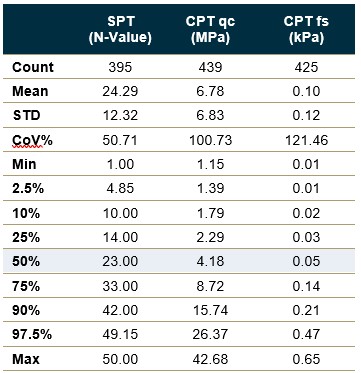
Statistical summaries of geotechnical strength properties from laboratory and in situ tests. STD – standard deviation; CoV% – coefficient of variation; SPT – standard penetration test (number of tests with N-value > 50 or with no N-value = 87); CPT qc – cone penetration test resistance; CPT fs – cone penetration test friction (negative friction values removed for statistical analysis). Percentiles reported based on sample size; no summaries are provided where there are fewer than 5 samples. BGS © UKRI
Geotechnical properties: strength tests
Statistical summaries of geotechnical strength properties from laboratory and in situ tests. STD – standard deviation; CoV% – coefficient of variation; SPT – standard penetration test (number of tests with N-value > 50 or with no N-value = 87); CPT qc – cone penetration test resistance; CPT fs – cone penetration test friction (negative friction values removed for statistical analysis). Percentiles reported based on sample size; no summaries are provided where there are fewer than 5 samples. BGS © UKRI
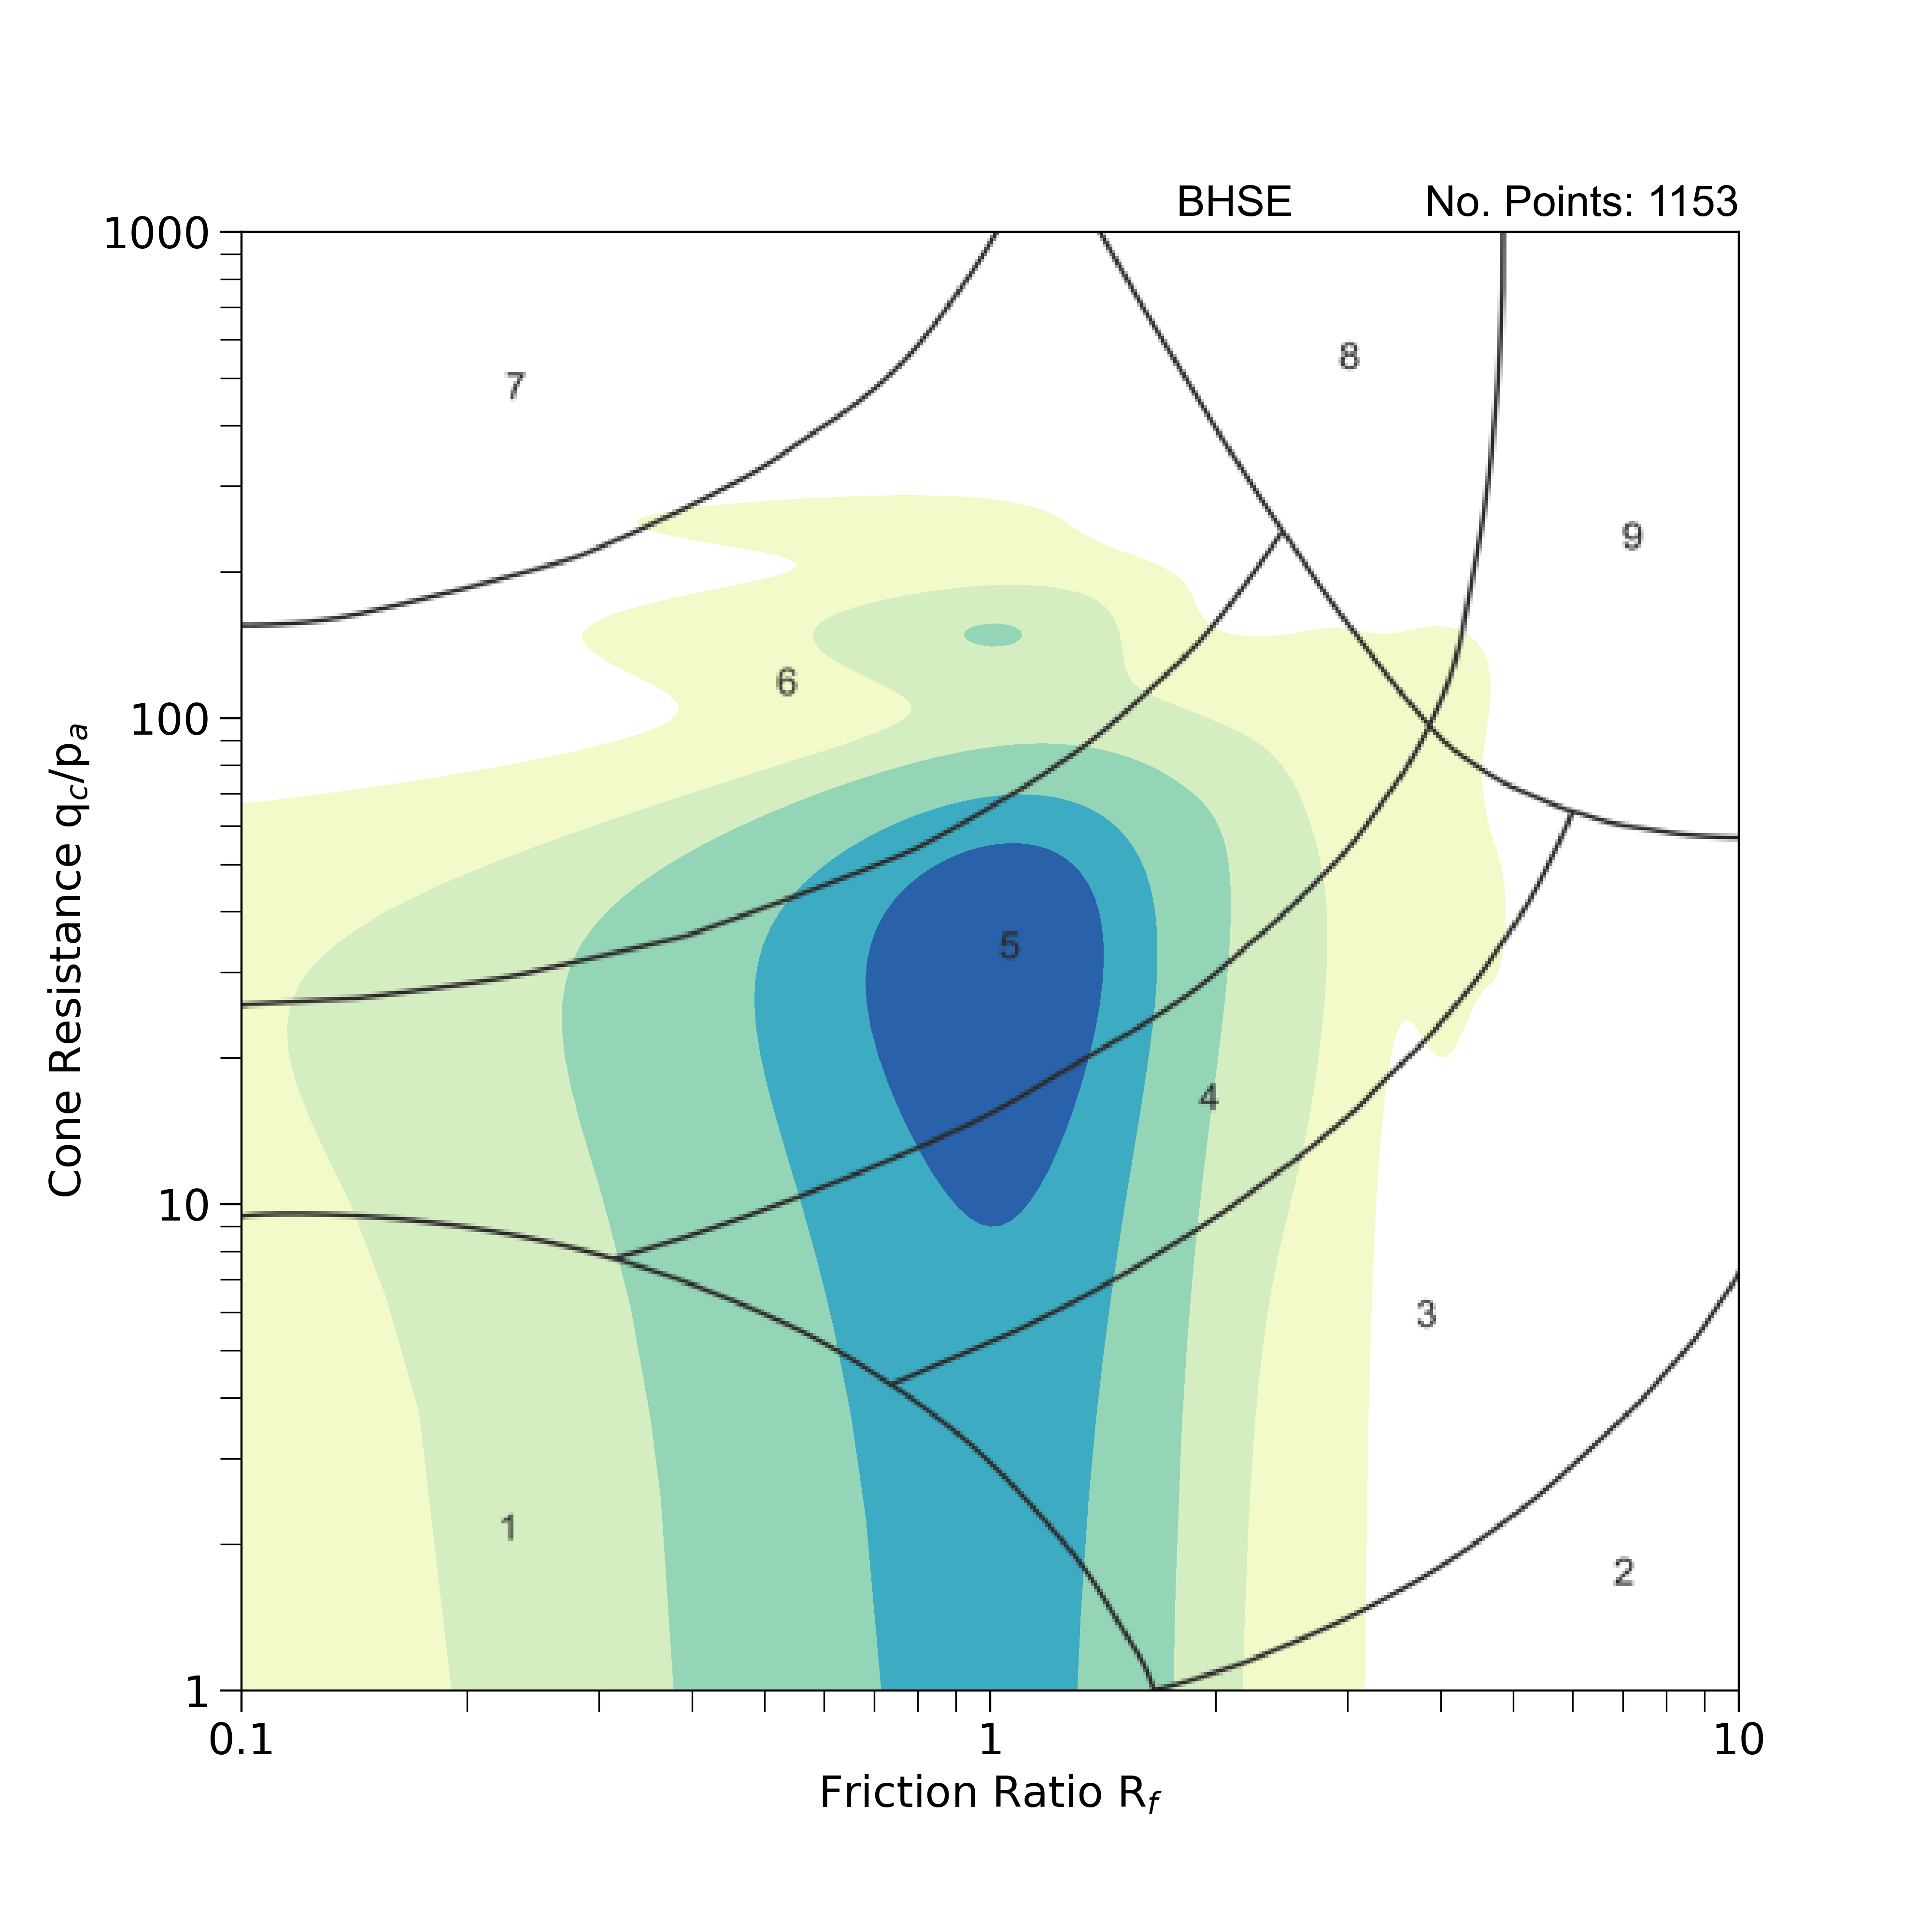
Geotechnical properties: strength tests
Non-normalised soil behaviour type chart after Robertson (2010) with 2D kernel density estimation of dimensionless cone resistance and friction ratio obtained from cone penetration tests. 1: sensitive fine-grained; 2: clay — organic soil; 3: clays — clay to silty clay; 4: silt mixtures — clayey silt and silty clay; 5: sand mixtures — silty sand to sandy silt; 6: sands — clean sands to silty sands; 7: dense sand to gravelly sand; 8: stiff sand to clayey sand (overconsolidated or cemented); 9: stiff, fine-grained sand (overconsolidated or cemented). BGS © UKRI.
Bridgeton Sand Member (BRON)
Geological descriptions
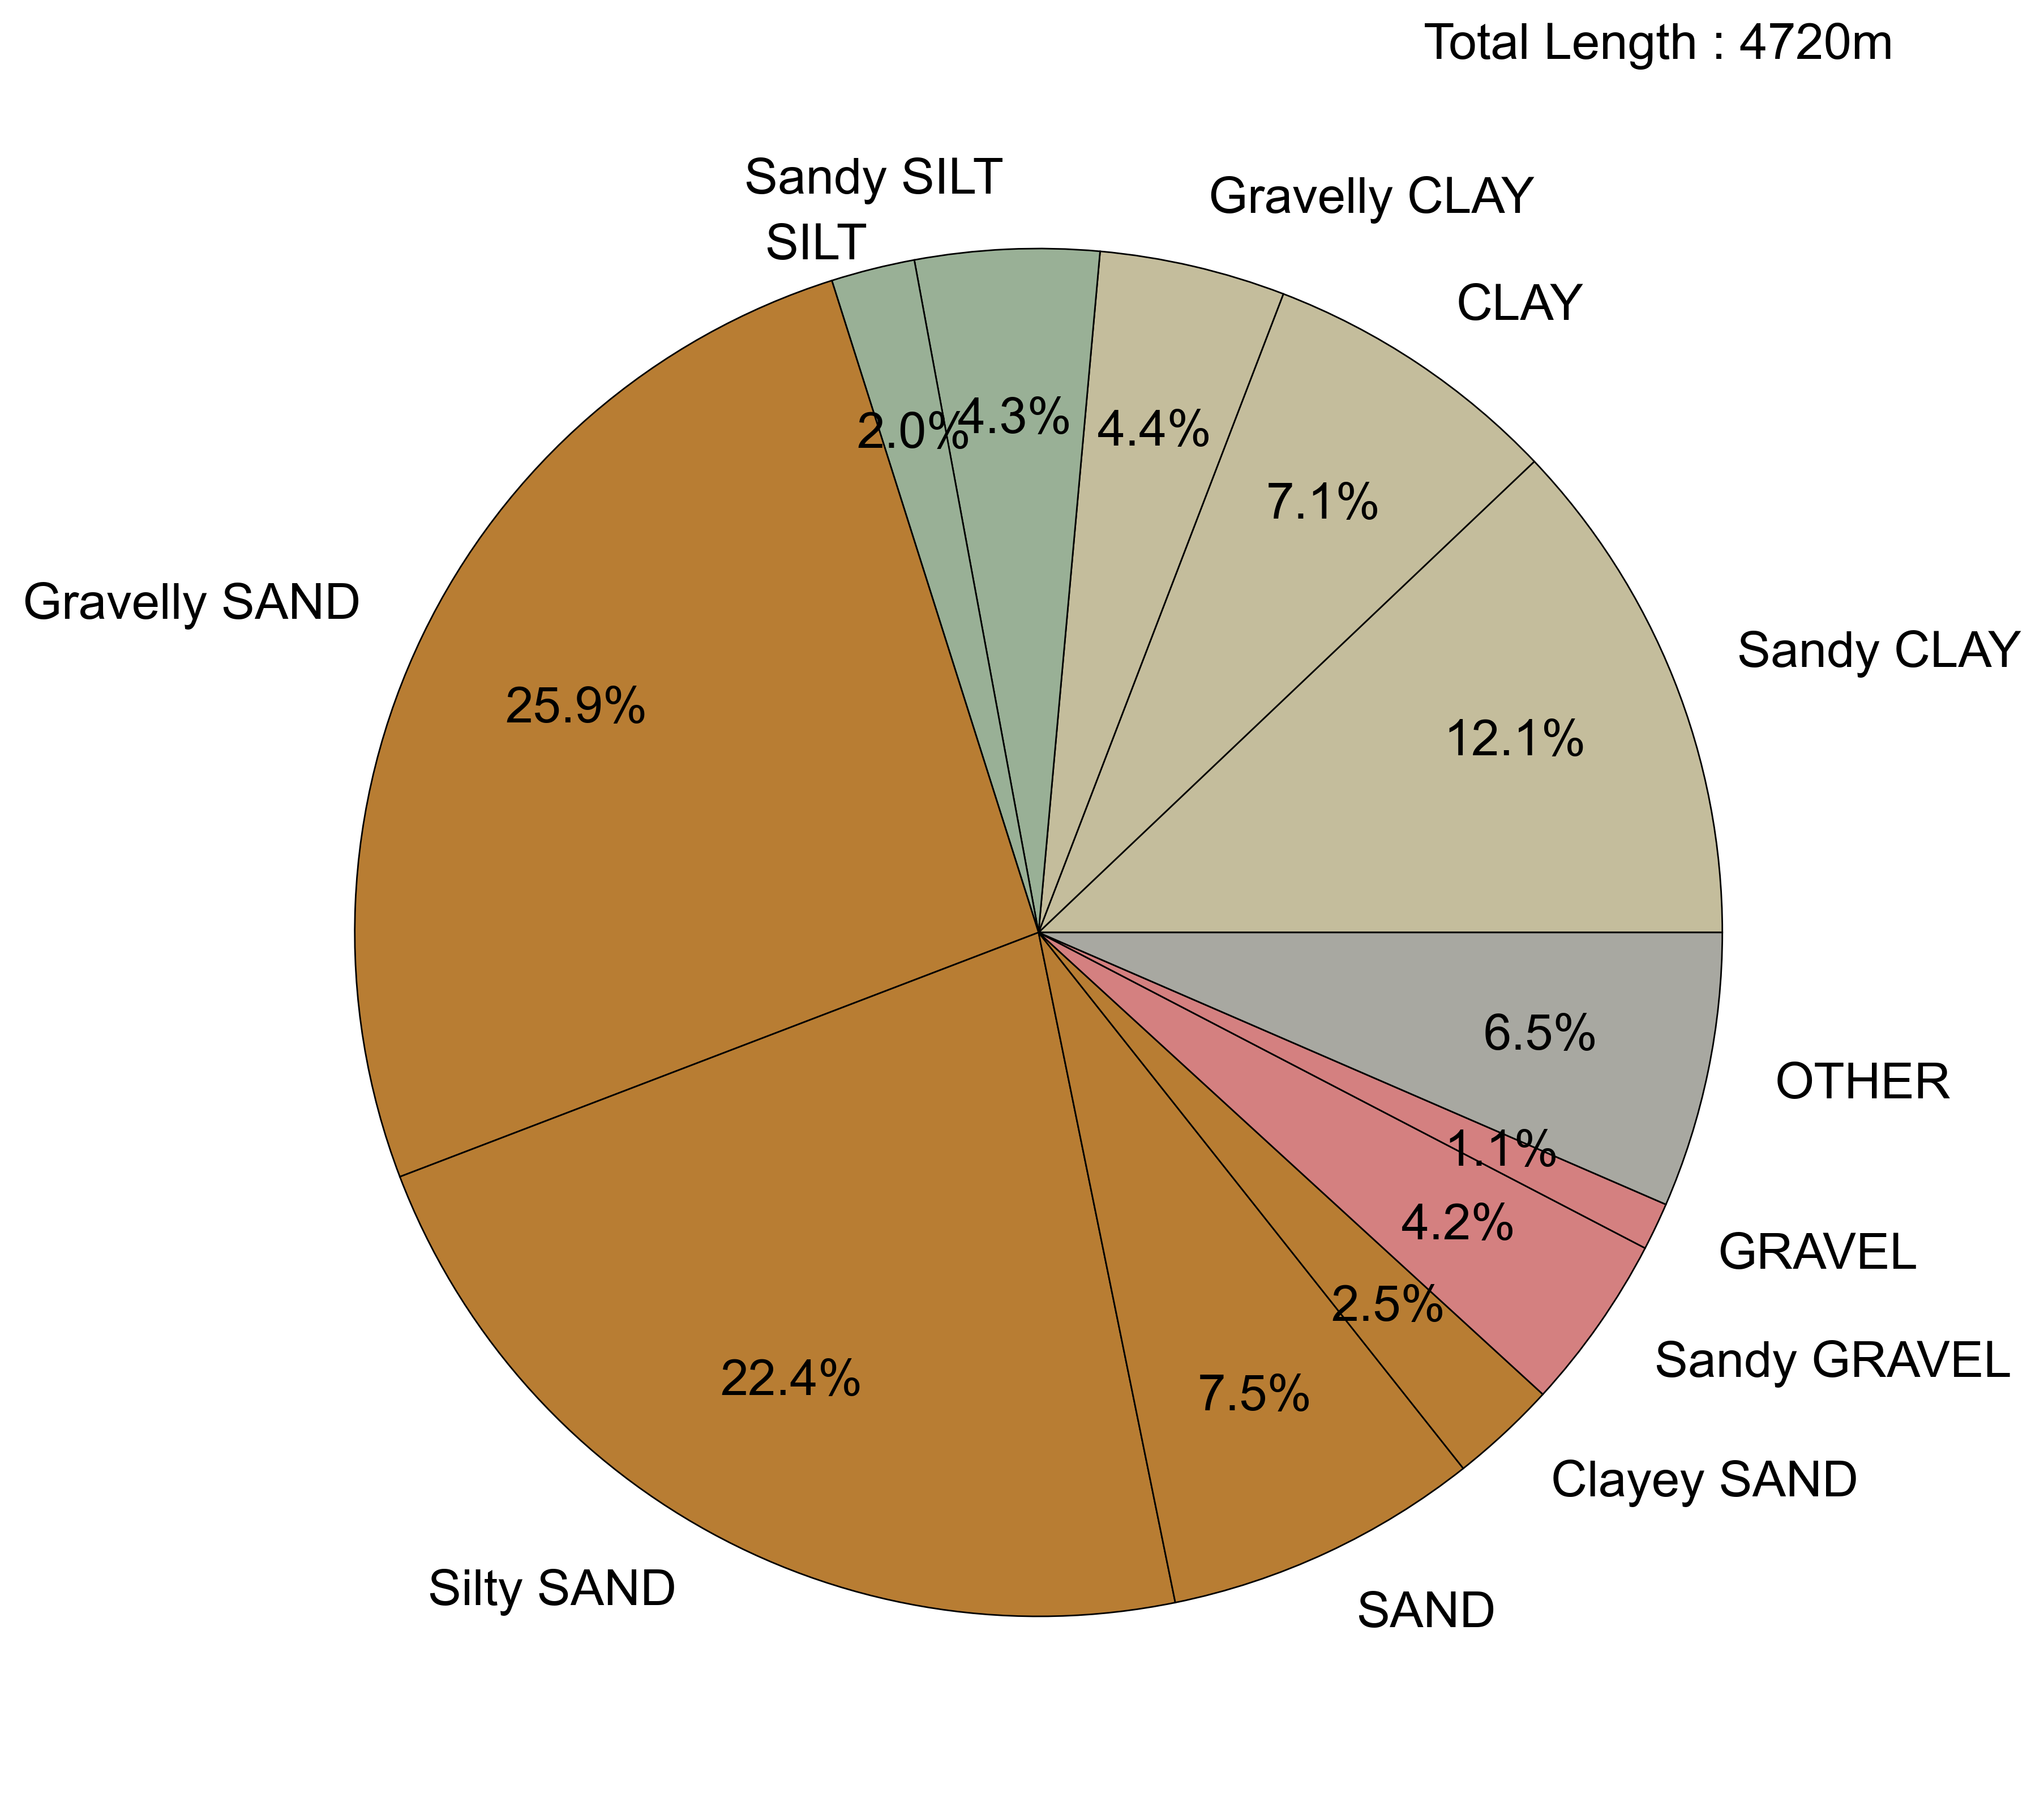
Pie chart summarising the dominant soil types (primary and secondary constituents) described in exploratory hole logs based on total metres logged. Descriptions have been simplified to remove tertiary constituents and a threshold of 1 per cent applied to aid graphical presentation. Soil types representing less than 1 per cent of the total logged are included in the ‘other’ category. BGS © URKRI.
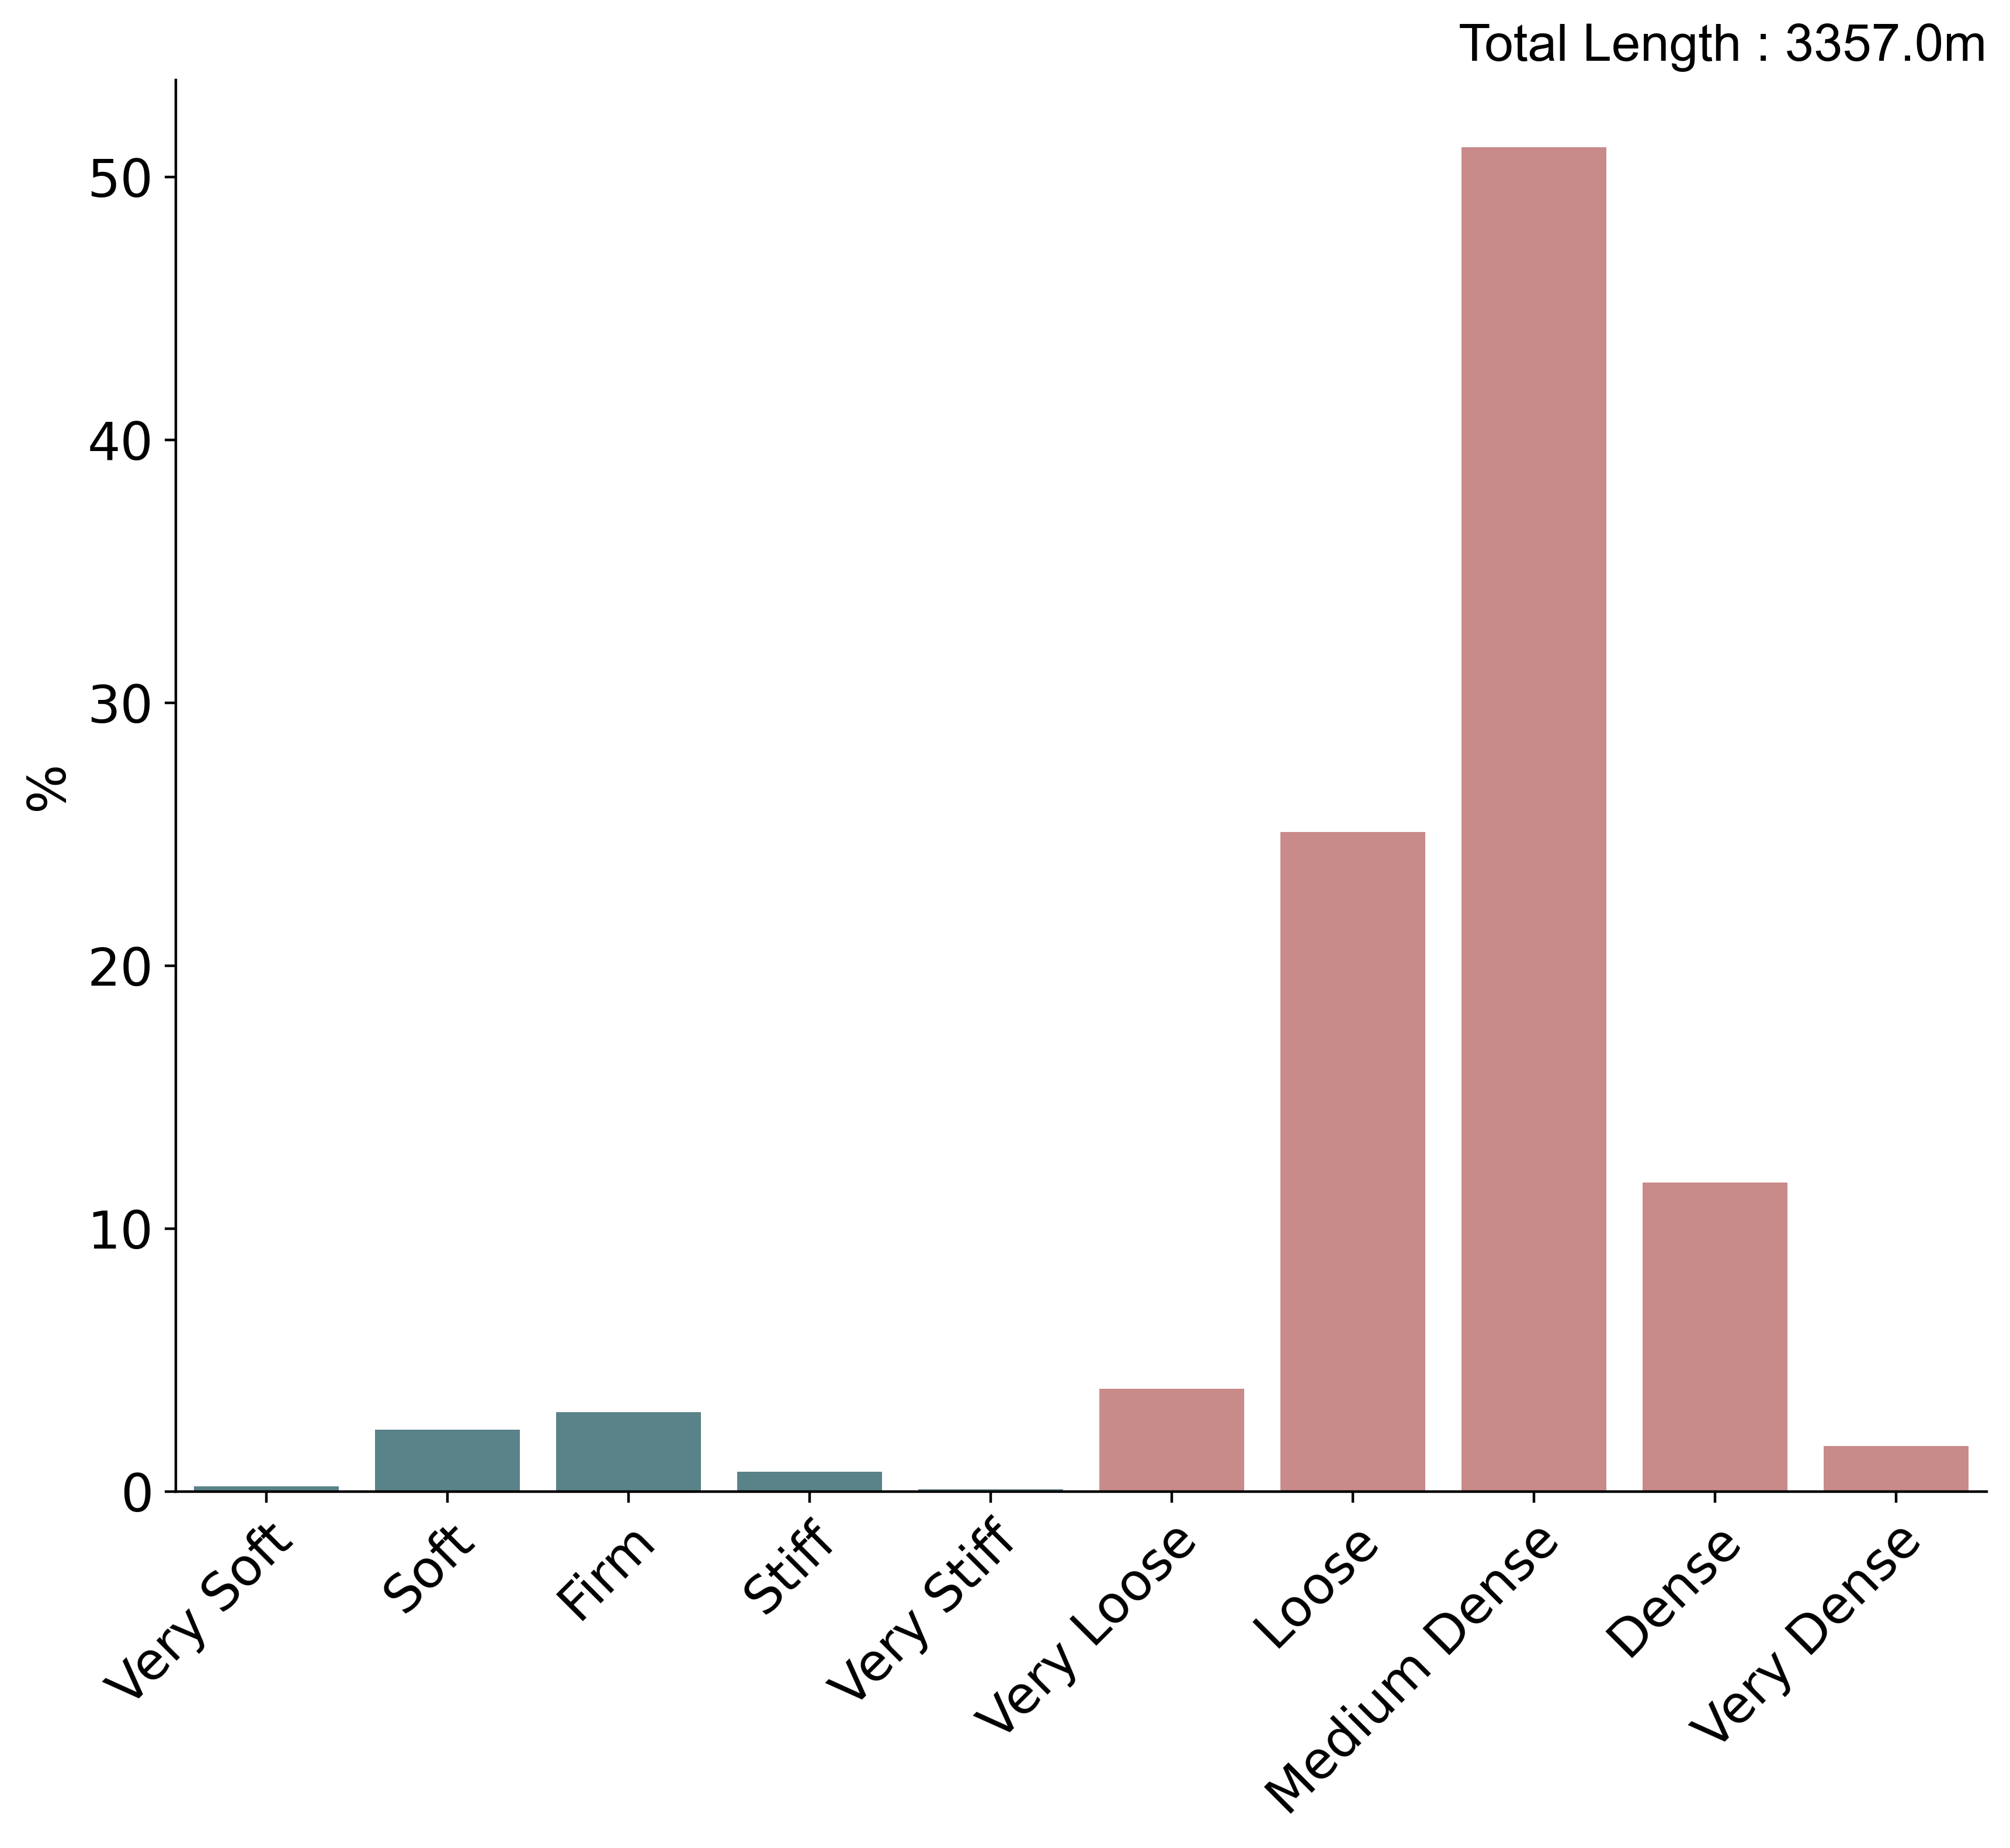
Geological descriptions
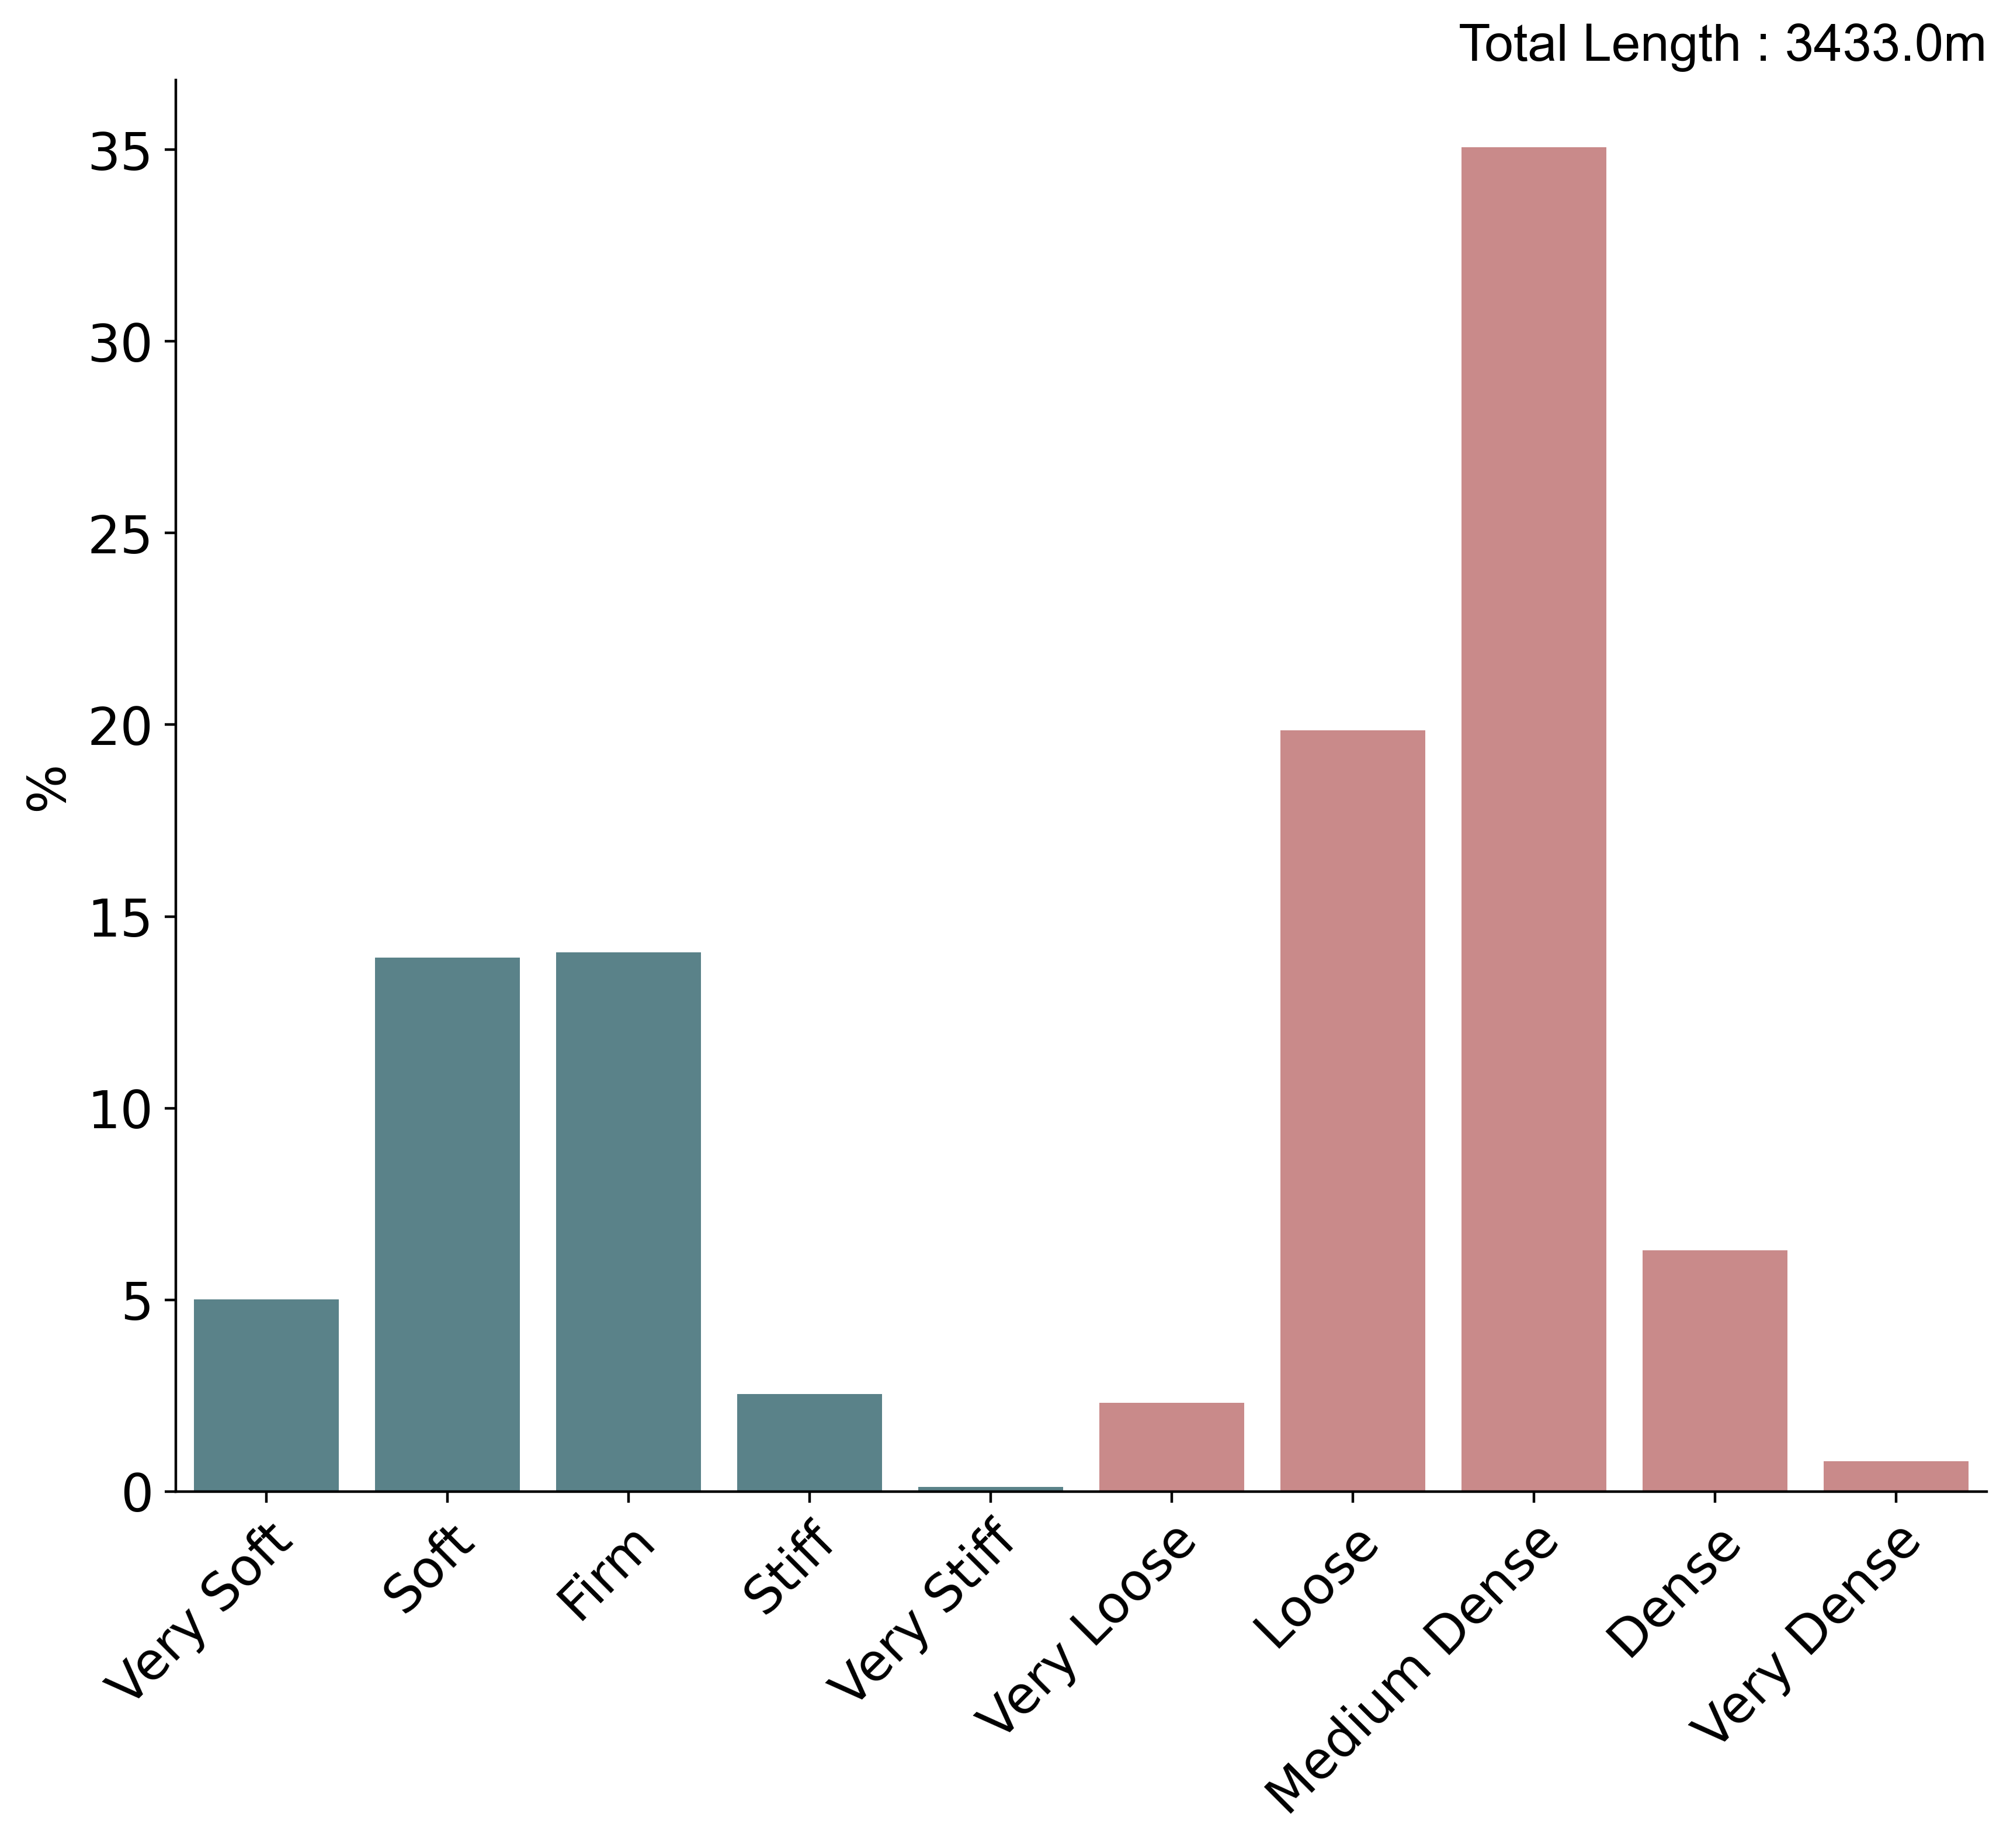
Histogram summarising the consistency and relative density described in exploratory hole logs based on total metres logged. BGS © UKRI.
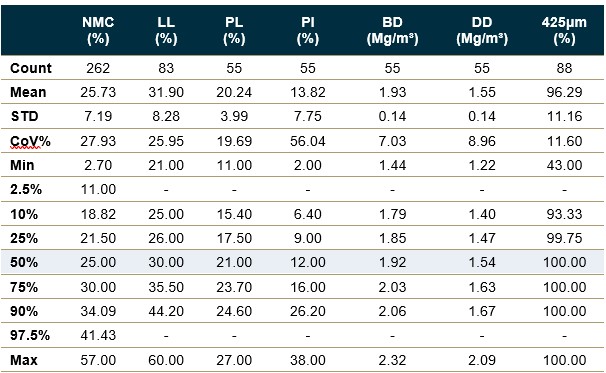
Geotechnical properties: classification tests
Statistical summaries of geotechnical index properties from laboratory tests. STD – standard deviation; CoV% – coefficient of variation; NMC – natural moisture content; LL – liquid limit; PL – plastic limit; PI – plasticity index; BD – bulk density; DD – dry density; 425 μm – percentage of sample by mass passing 425 μm sieve Percentiles reported based on sample size; no summaries are provided where there are fewer than 5 samples. BGS © UKRI
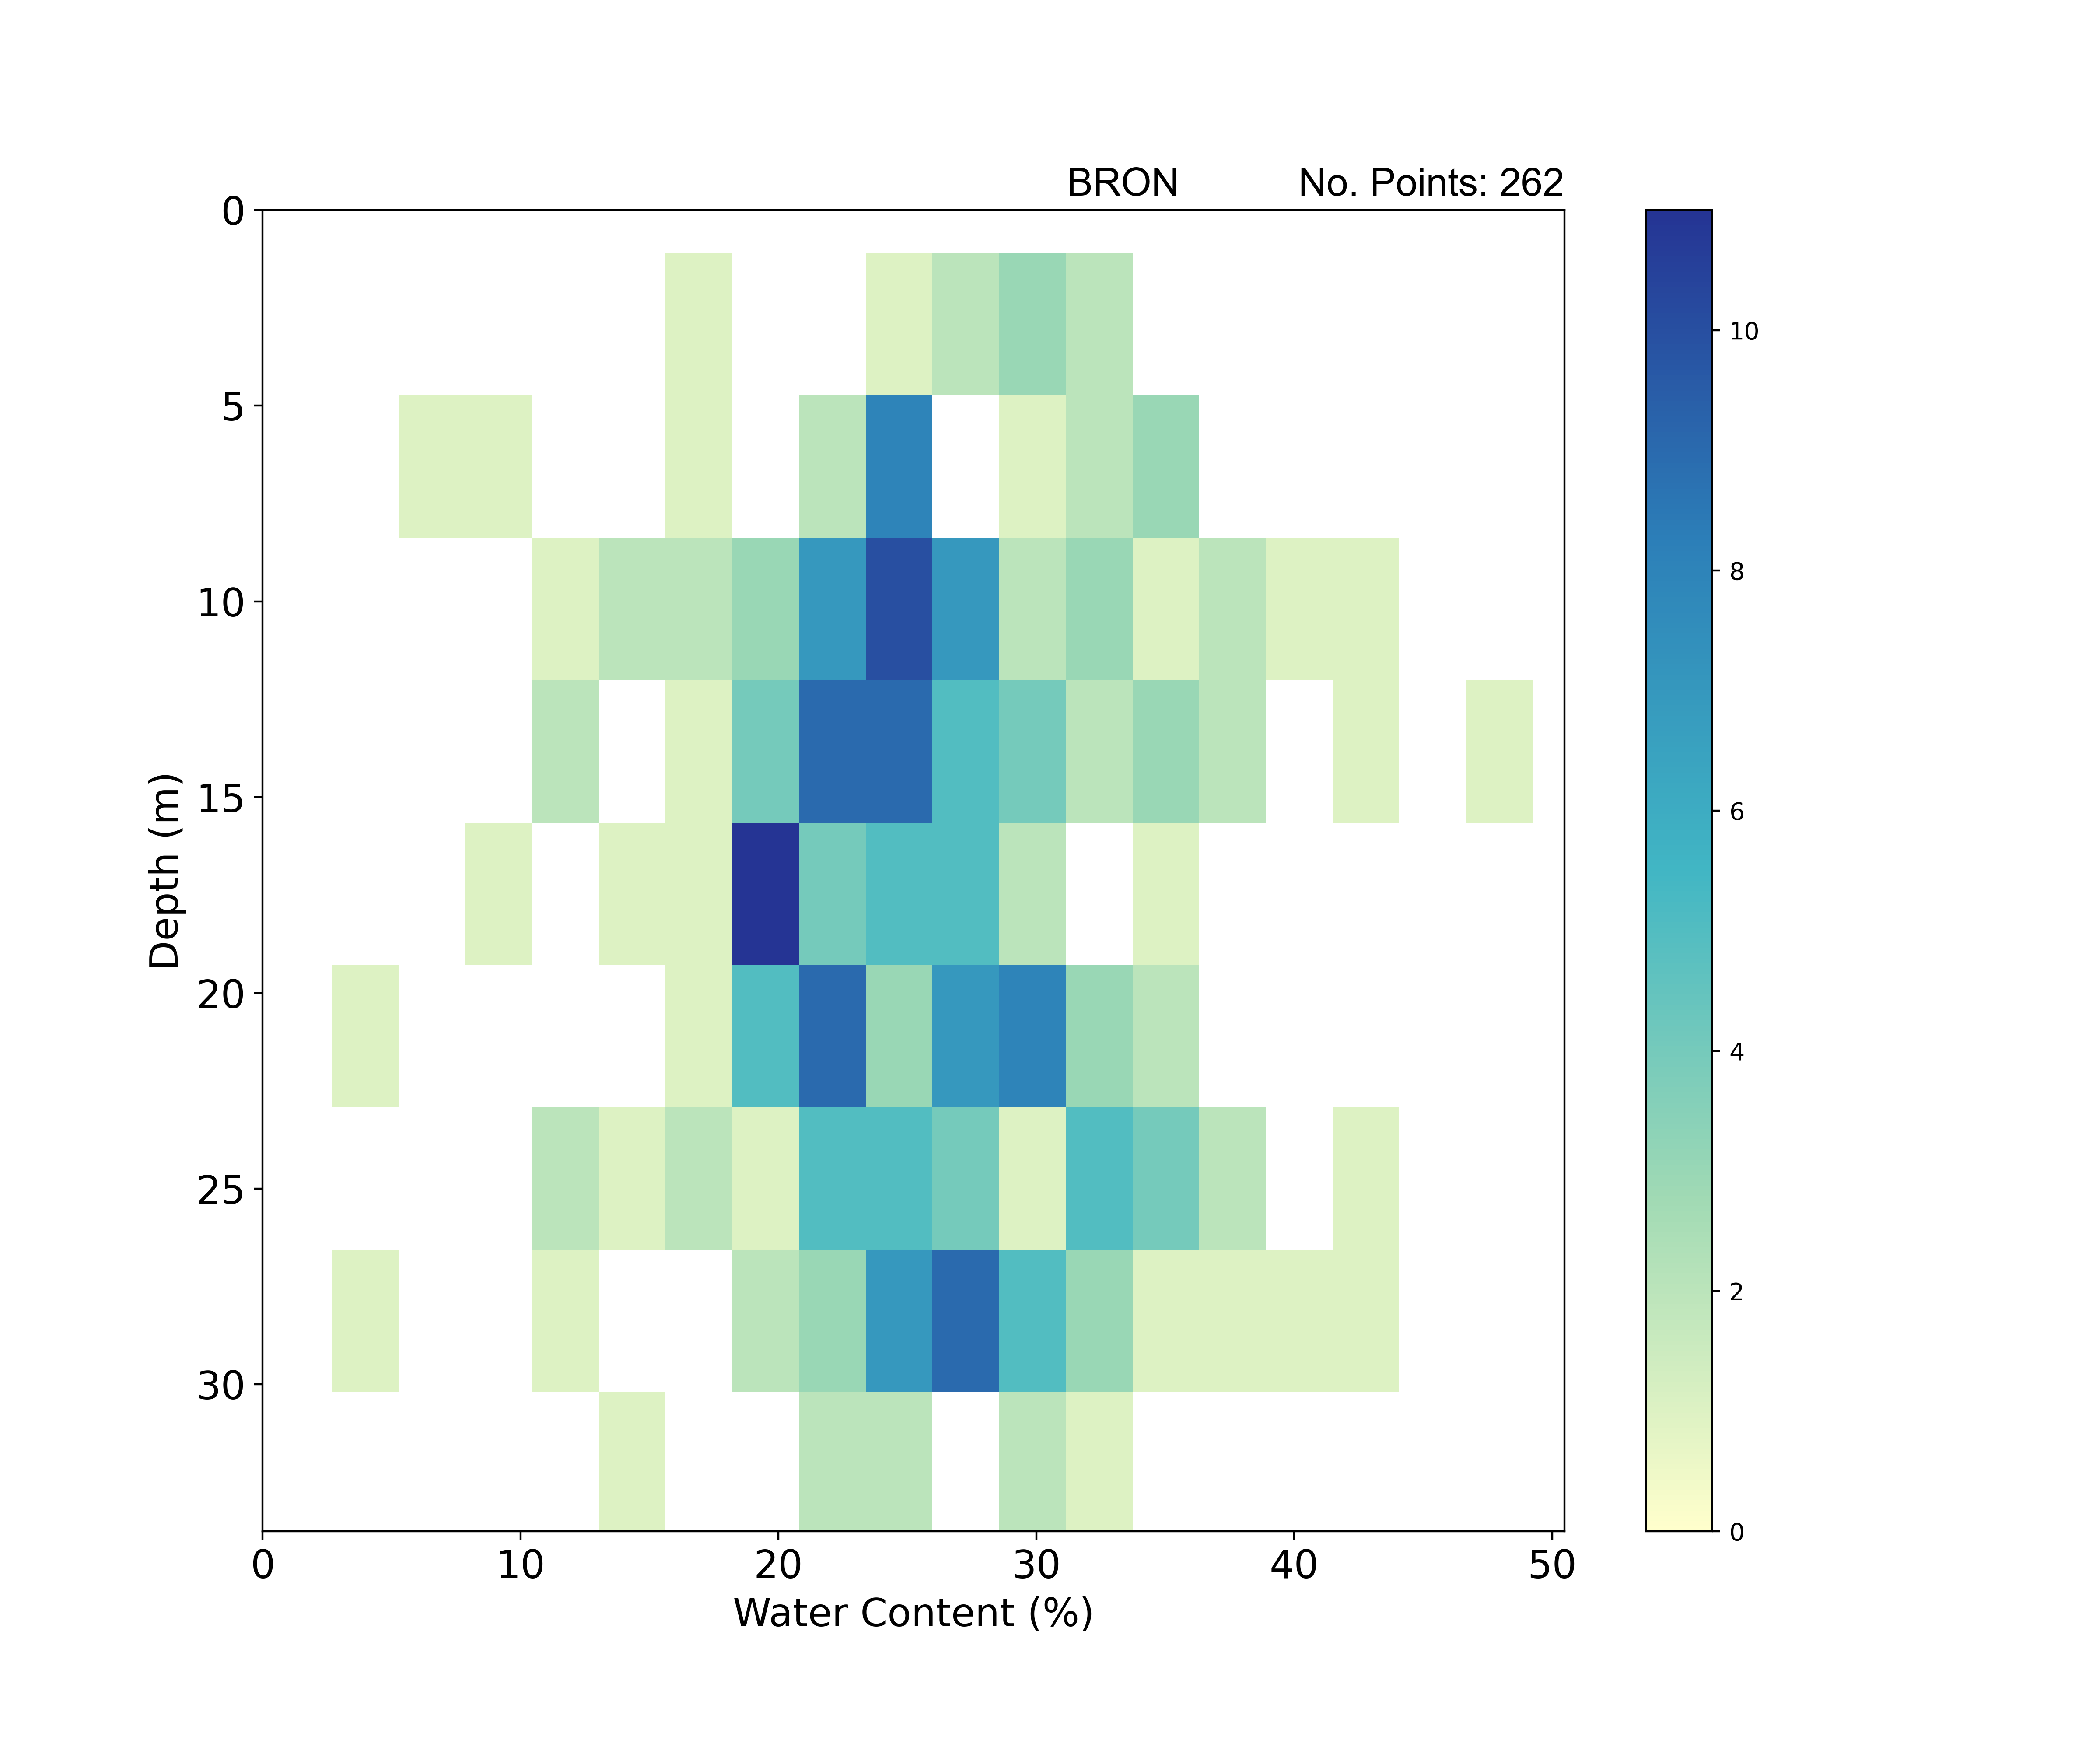
Geotechnical properties: classification tests
2D histogram summarising water content with depth. BGS © UKRI.
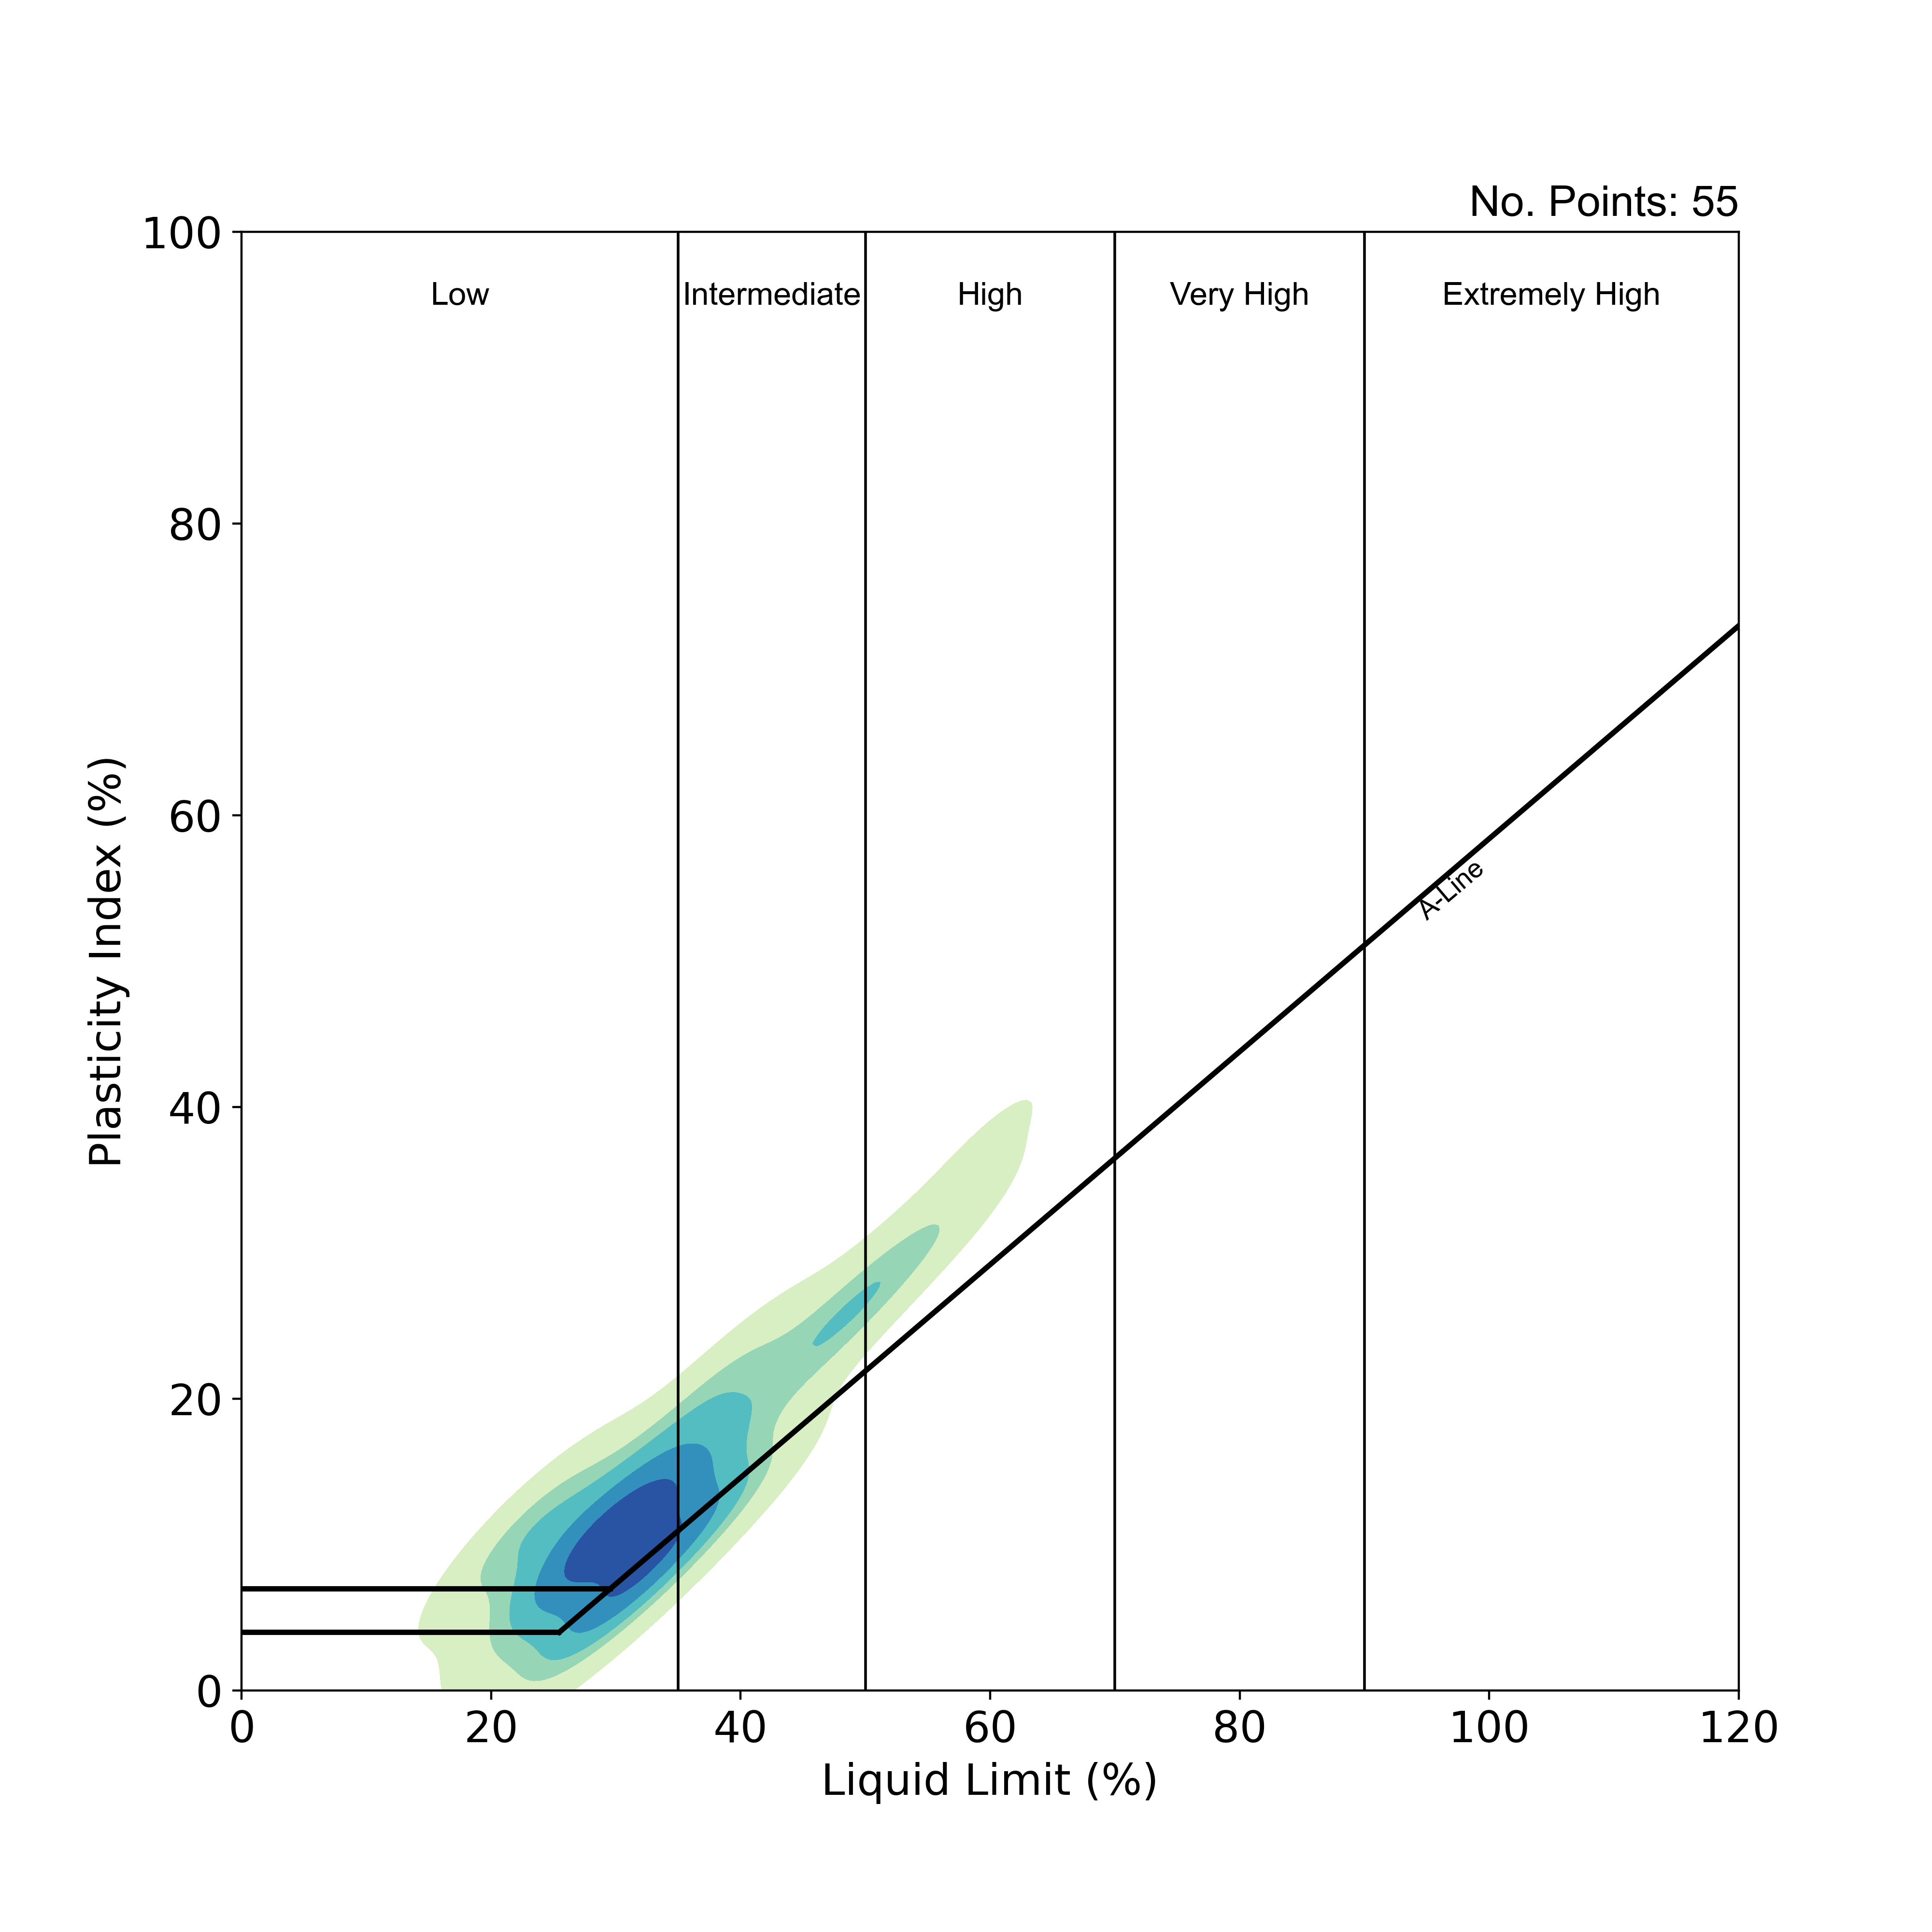
Geotechnical properties: classification tests
Casagrande plasticity plot summarising the distribution of plasticity results with a 2D kernel density estimation. Each colour represents a region of equal probability density (about 20 per cent for each area), with the darker colours representing higher values for probability density. BGS © UKRI.
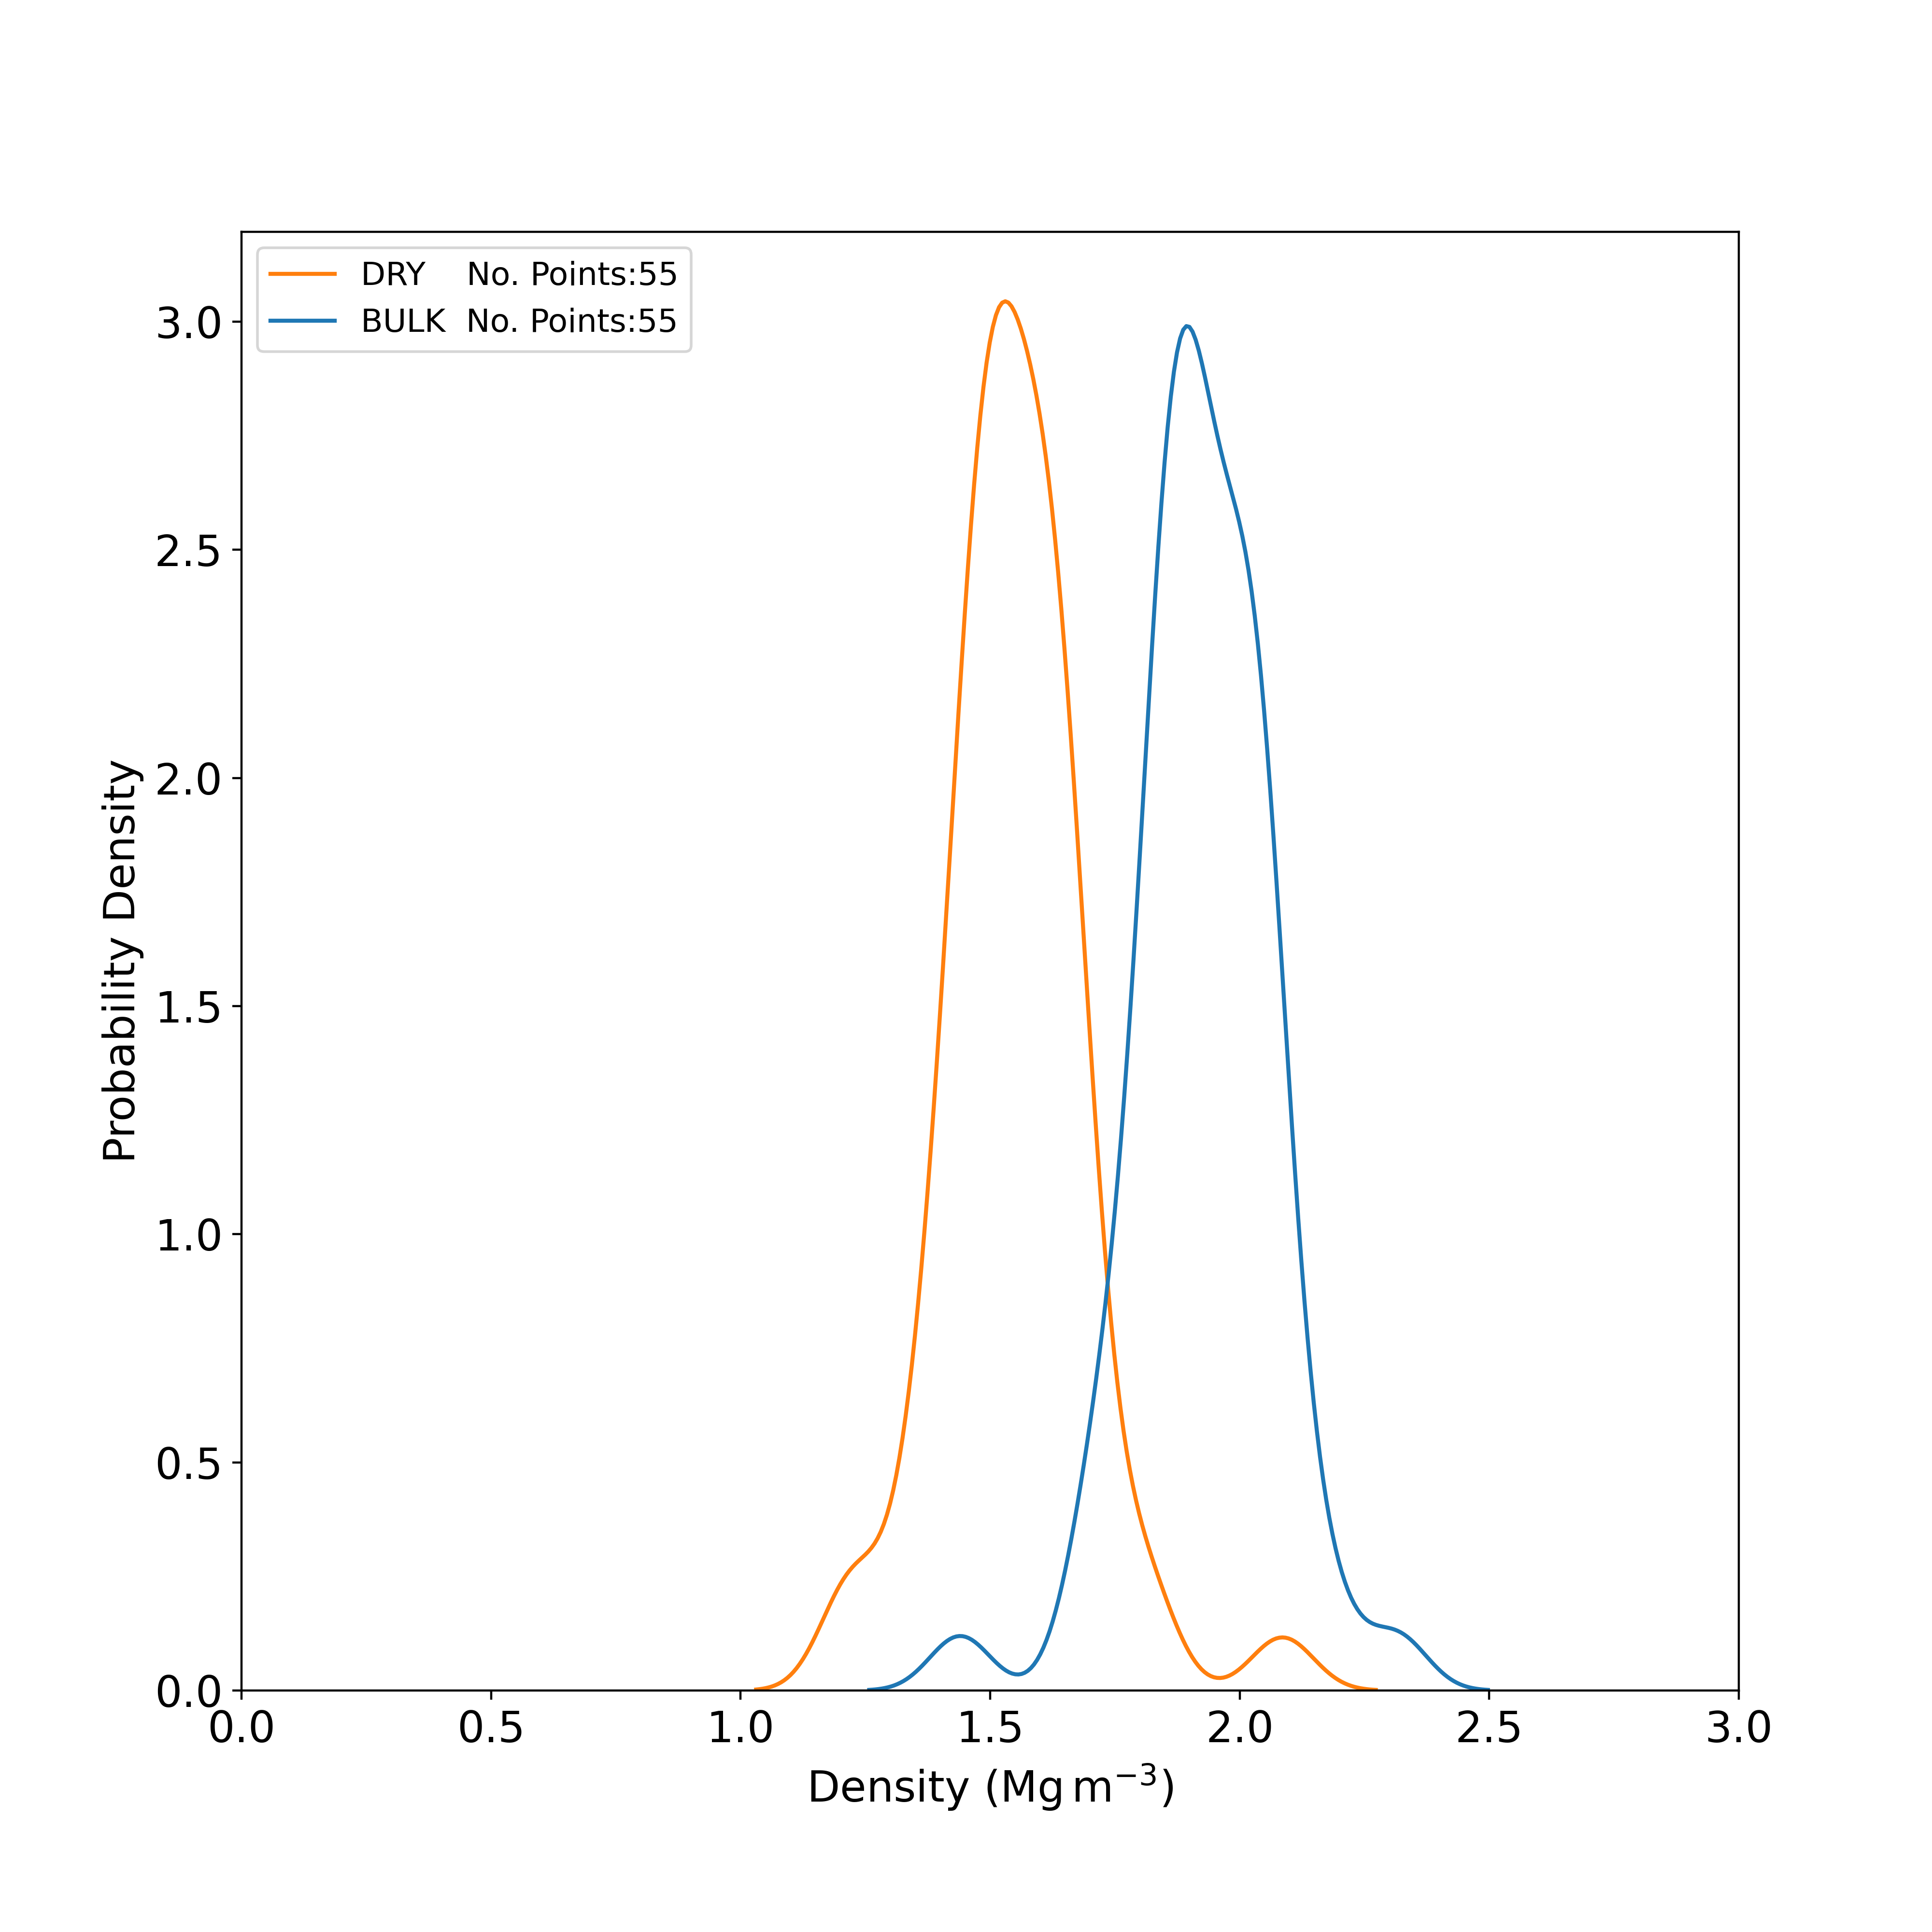
Geotechnical properties: classification tests
Kernel density plot showing the distribution of bulk density and dry density results obtained from laboratory tests. BGS © UKRI.
Geotechnical properties: strength tests
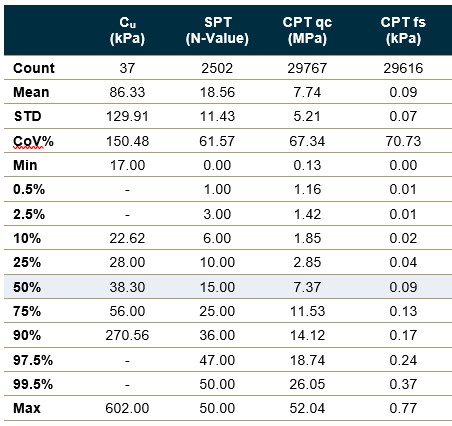
Statistical summaries of geotechnical strength properties from laboratory and in situ tests. STD – standard deviation; CoV% – coefficient of variation; Cu – undrained shear strength obtained from unconsolidated undrained triaxial tests; SPT –standard penetration test (number of tests with N-value > 50 or with no N-value = 231); CPT qc – cone penetration test resistance; CPT fs – cone penetration test friction (negative friction values removed for statistical analysis). Percentiles reported based on sample size; no summaries are provided where there are fewer than 5 samples. BGS © UKRI
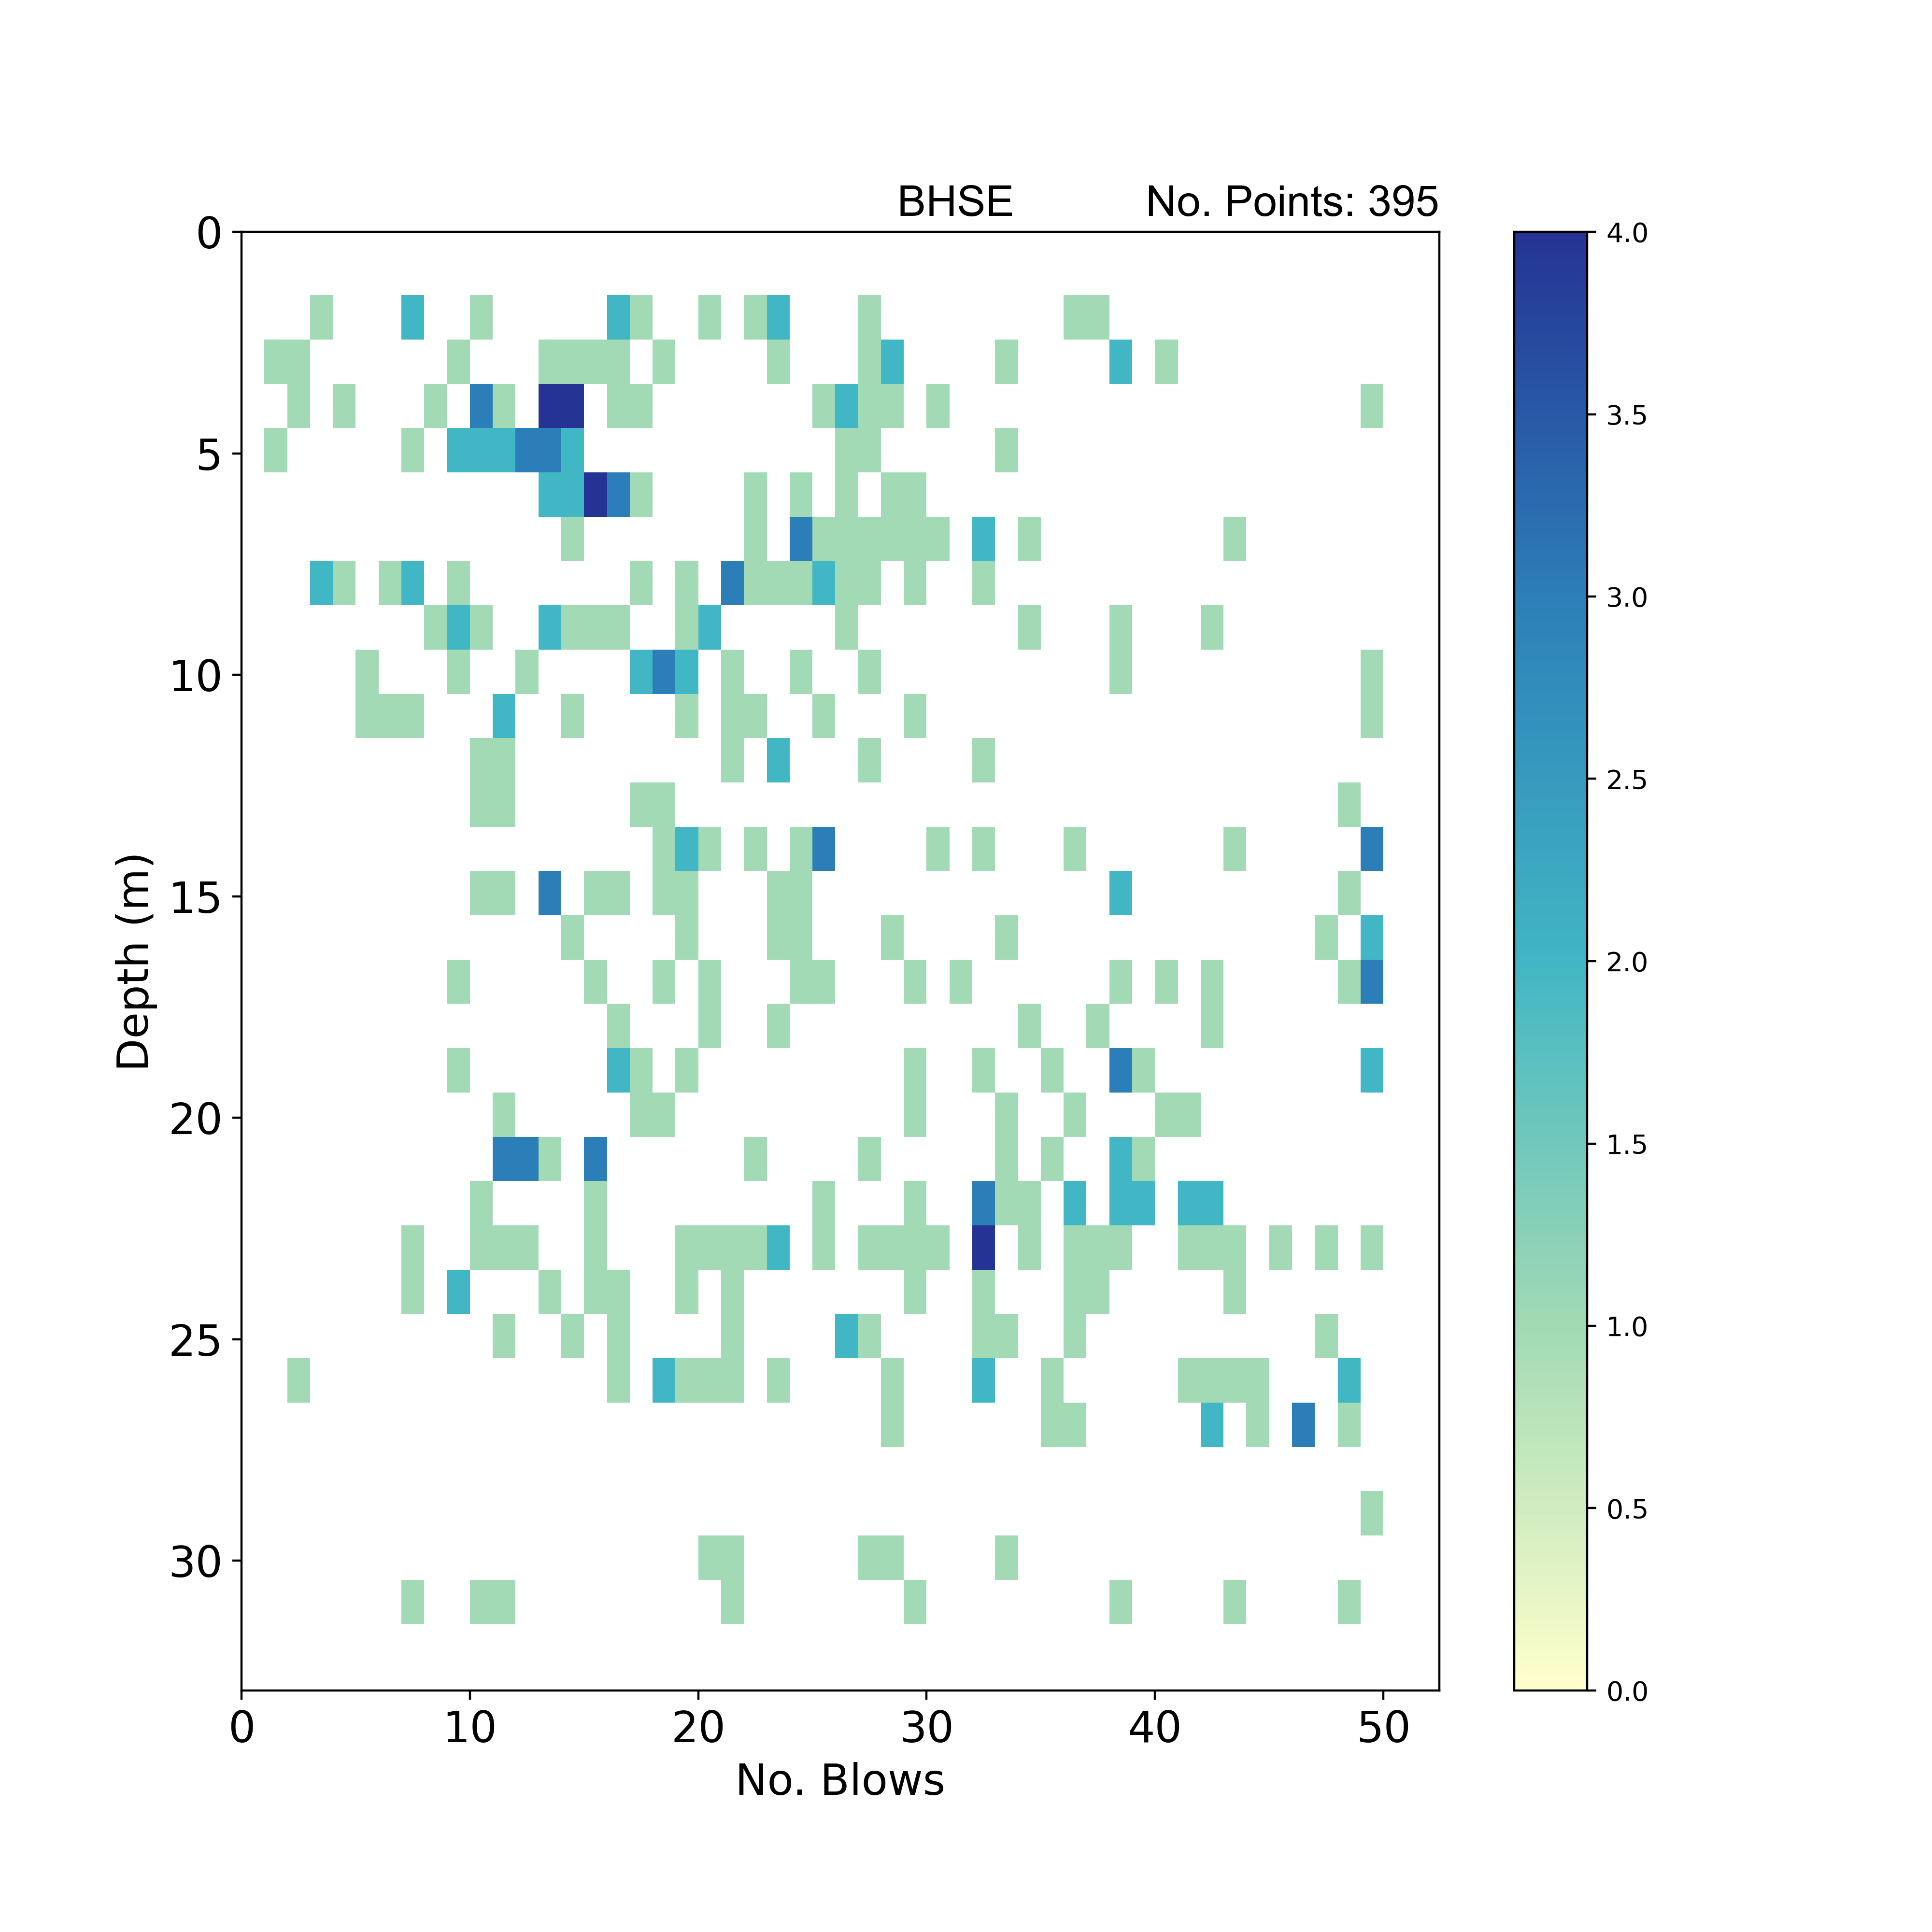
Geotechnical properties: strength tests
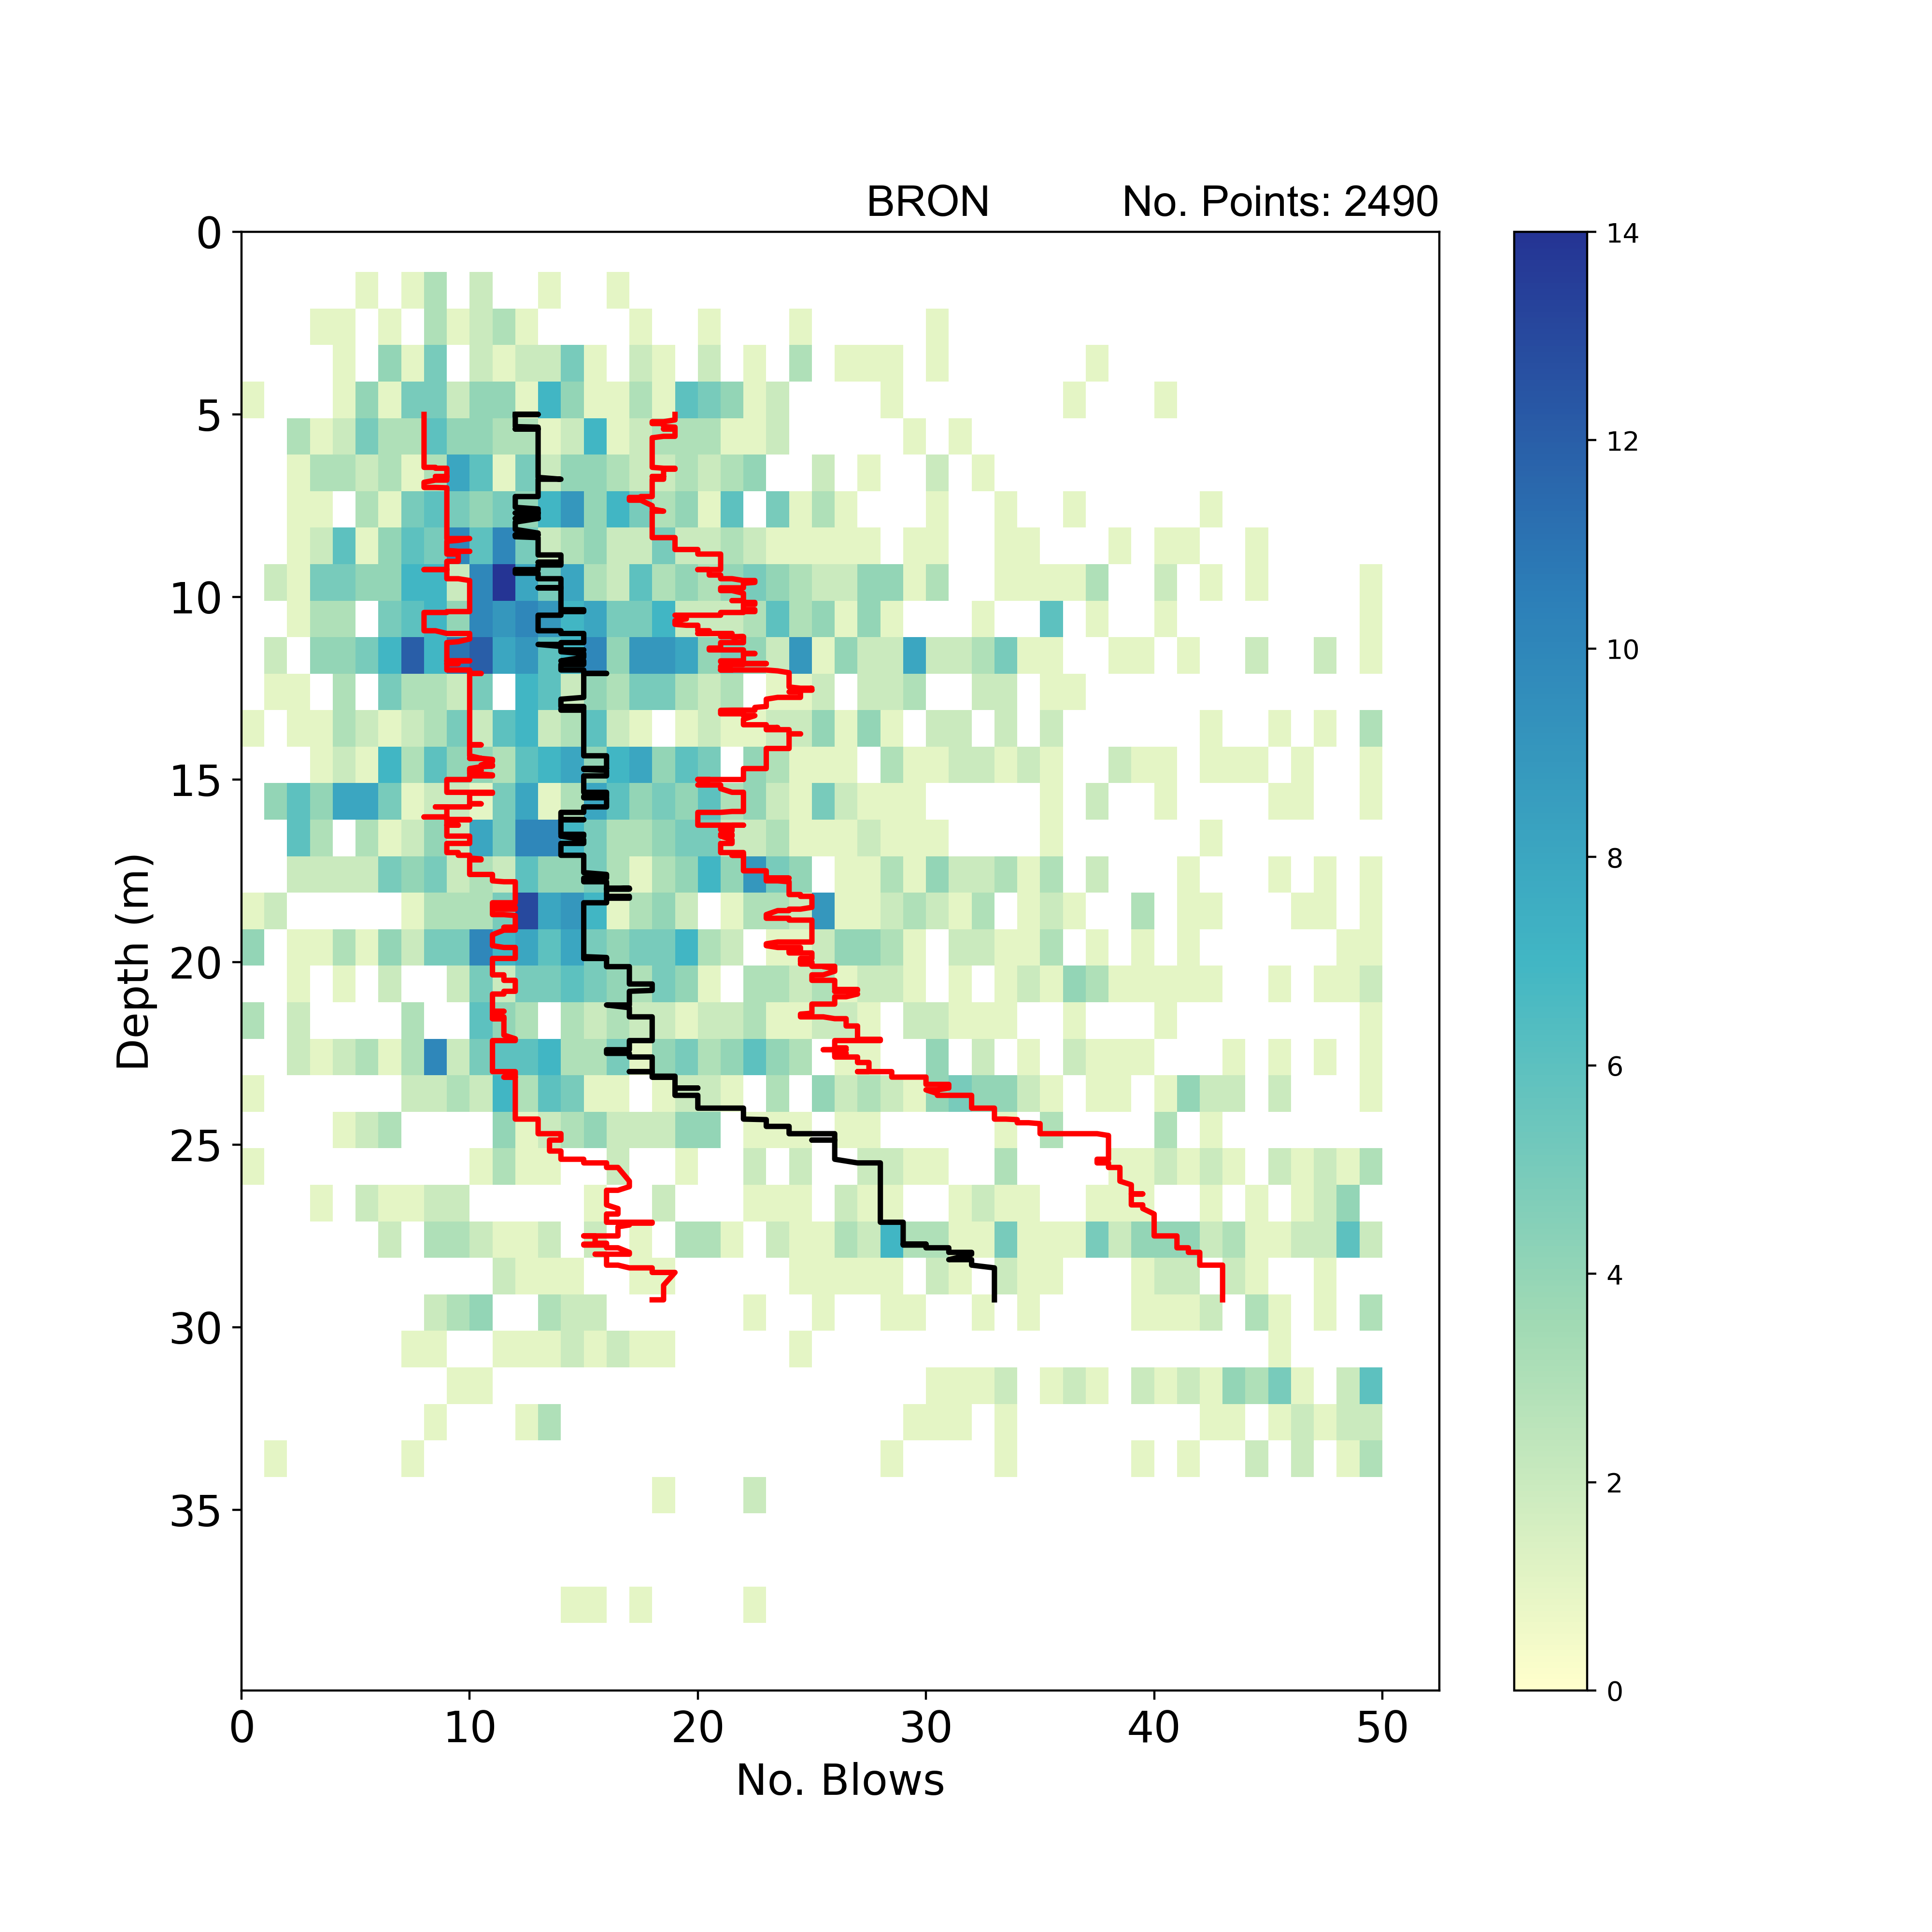
2D histogram summarising SPT N-value results with depth. Black line – SPT N-Value with depth trend using a rolling window median (window width = 10% sample number); red lines – SPT N-Value with depth trend using a rolling window of 25th and 75th percentile (window width = 10% sample number). Number of tests with N-value > 50 or with no N-value = 231. BGS © UKRI.
Geotechnical properties: strength tests
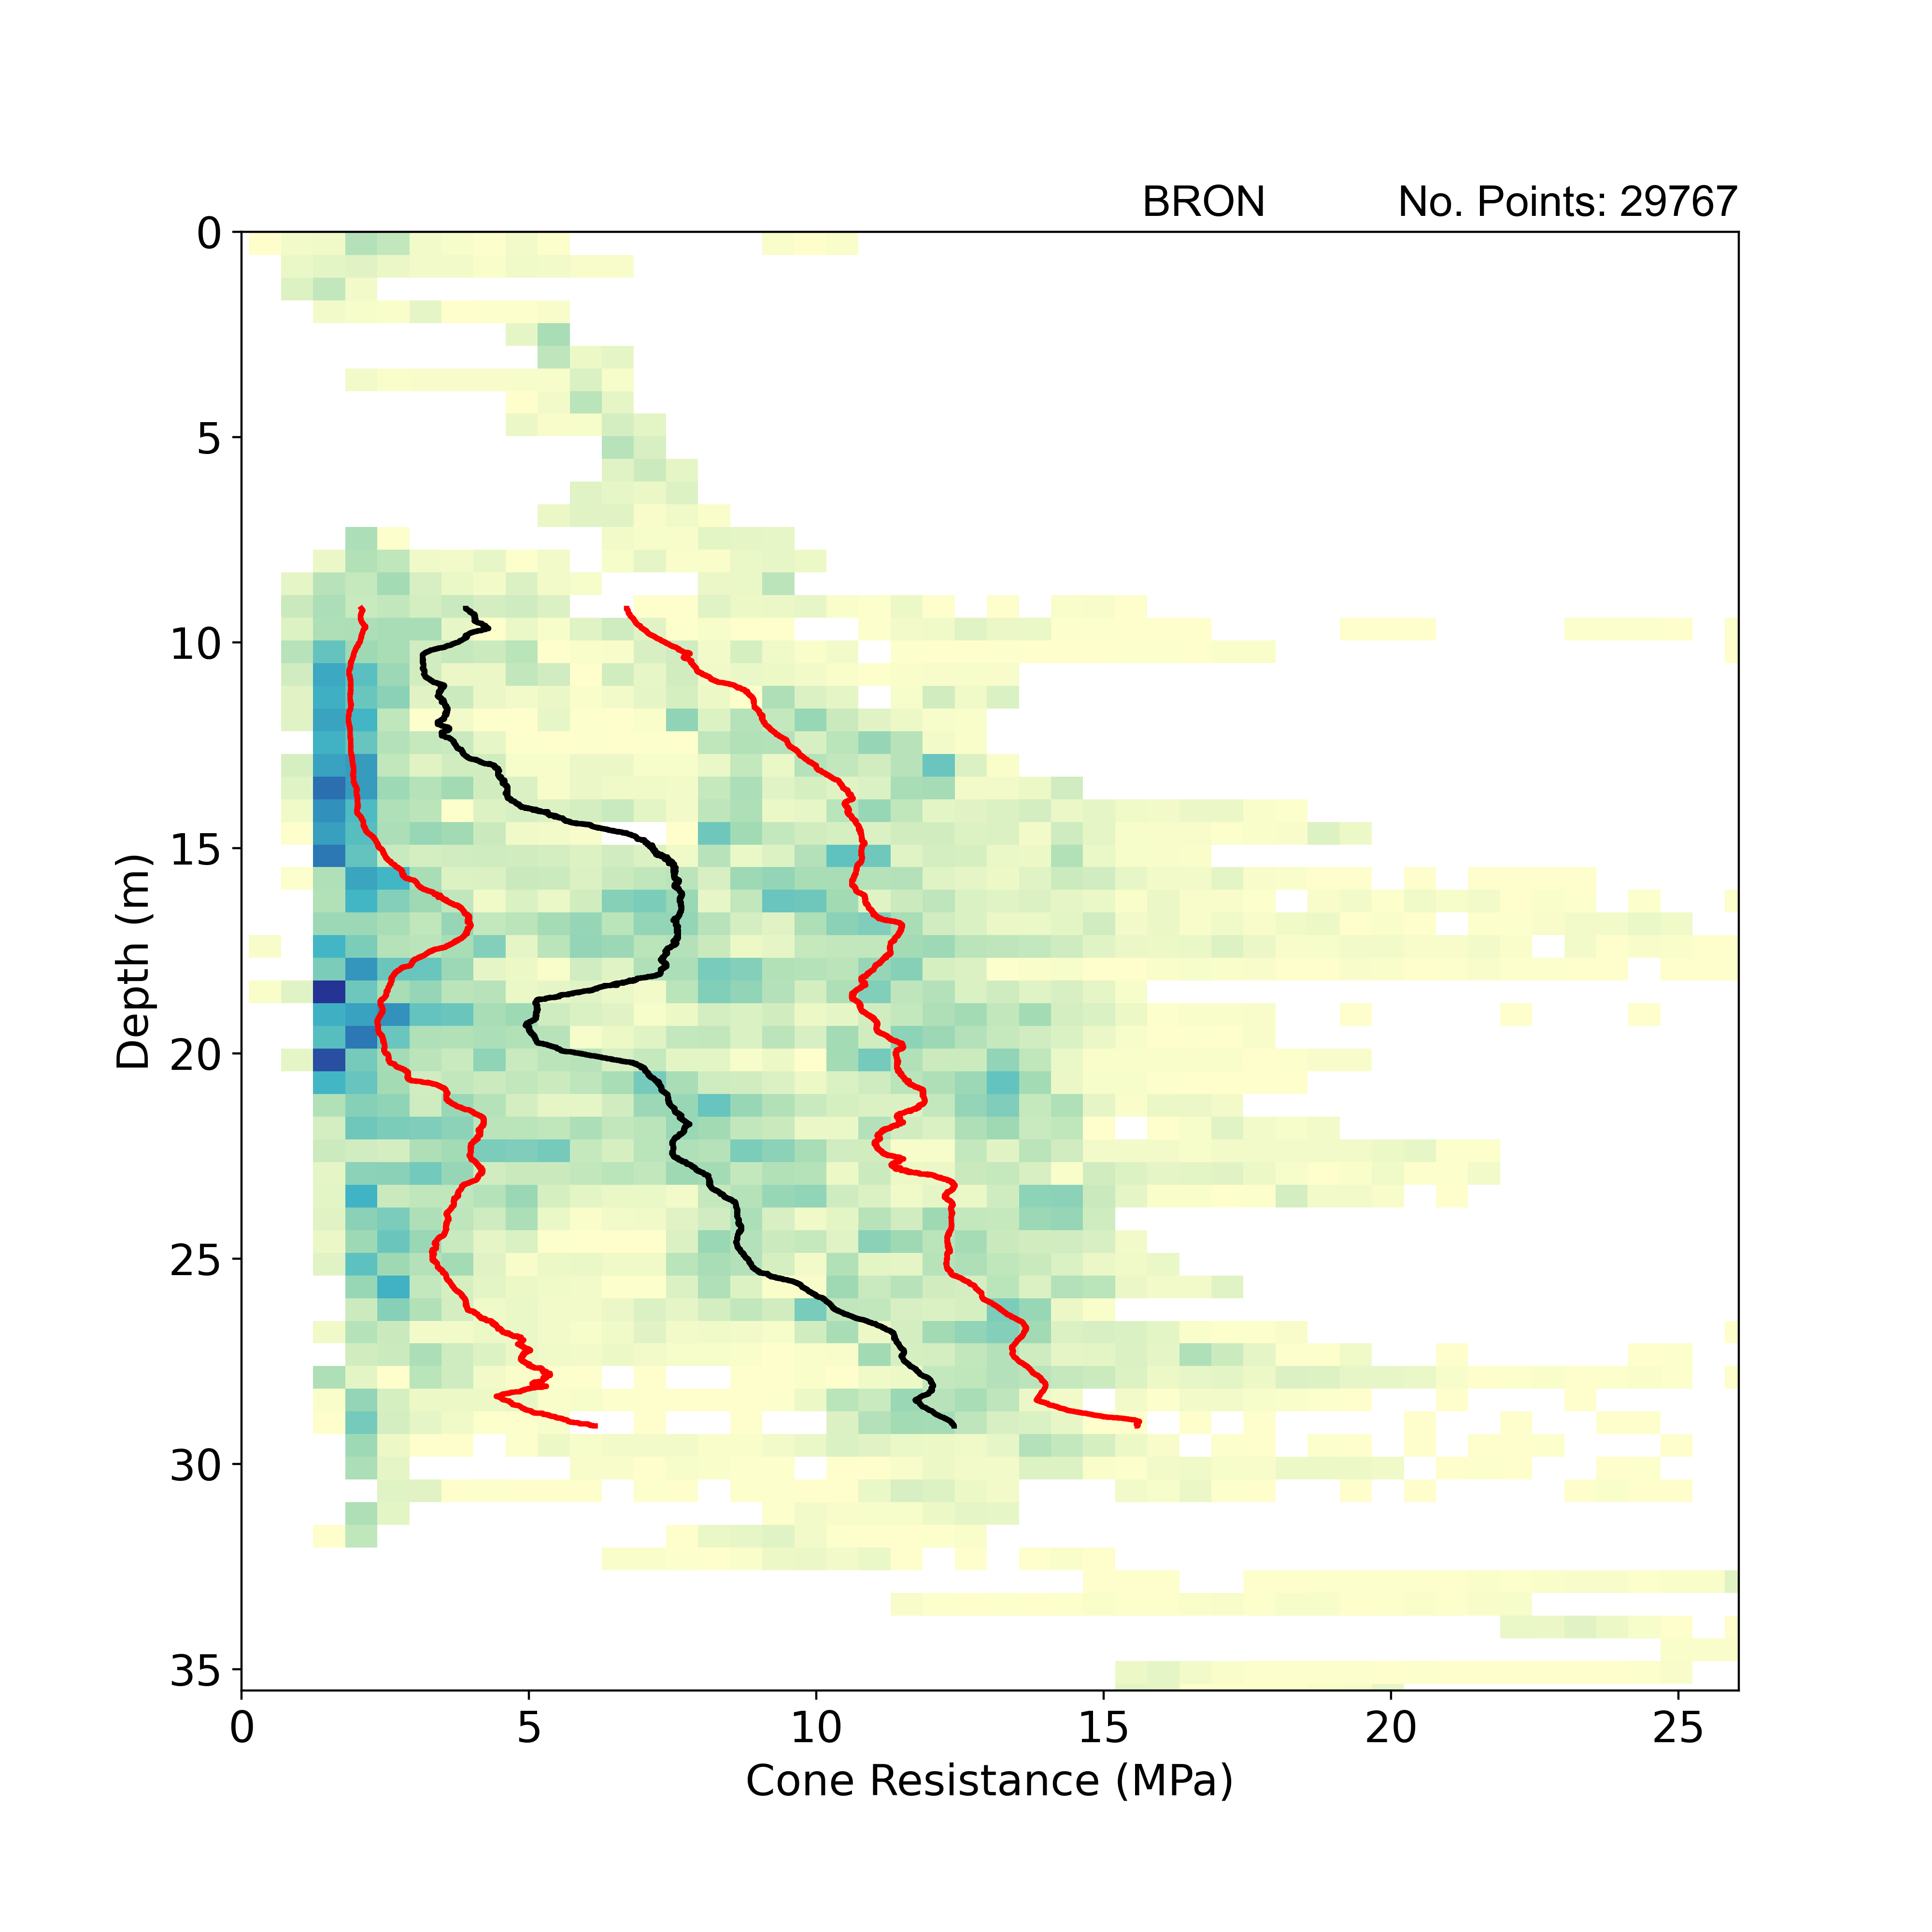
2D histogram summarising cone resistance with depth obtained from static cone penetration tests. Black line: cone resistance with depth trend using a rolling window median (window width = 10 per cent sample number); red lines: cone resistance with depth trend using a rolling window of 25th and 75th percentile (window width = 10 per cent sample number). BGS © UKRI.
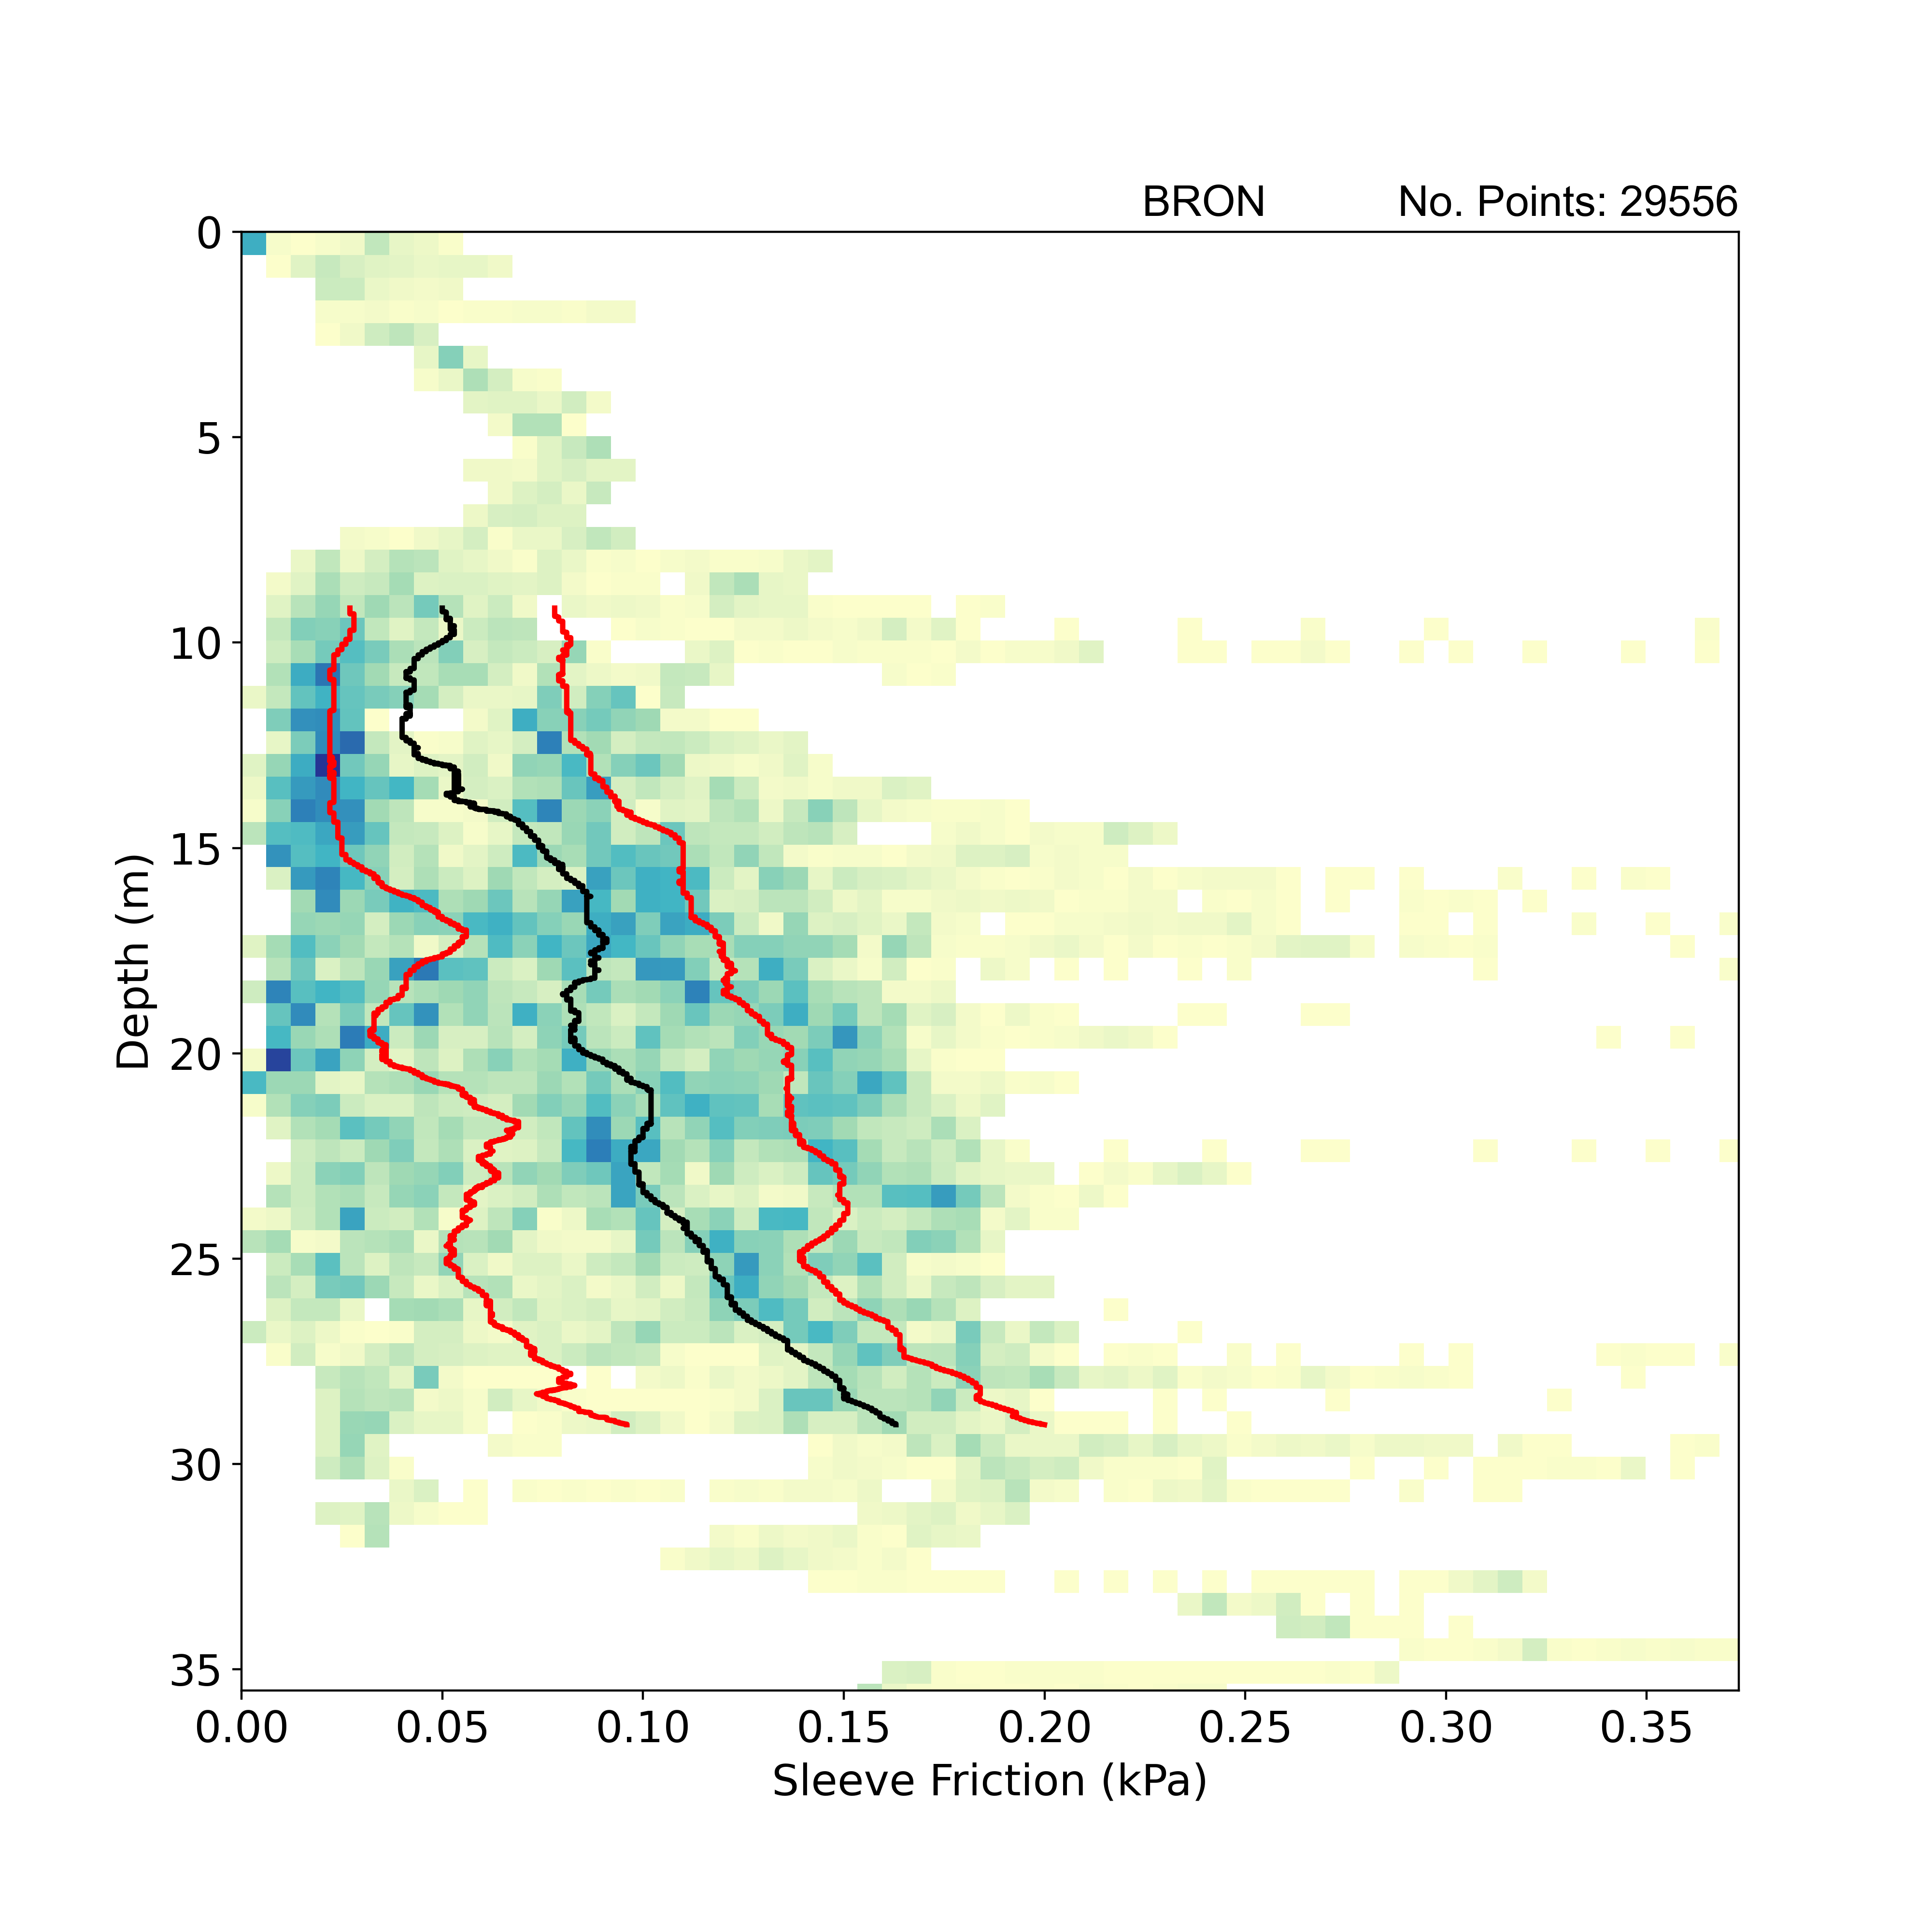
Geotechnical properties: strength tests
2D histogram summarising sleeve friction with depth obtained from static cone penetration tests. Black line: sleeve friction with depth trend using a rolling window median (window width = 10 per cent sample number); red lines: sleeve friction with depth trend using a rolling window of 25th and 75th percentile (window width = 10 per cent sample number). BGS © UKRI.
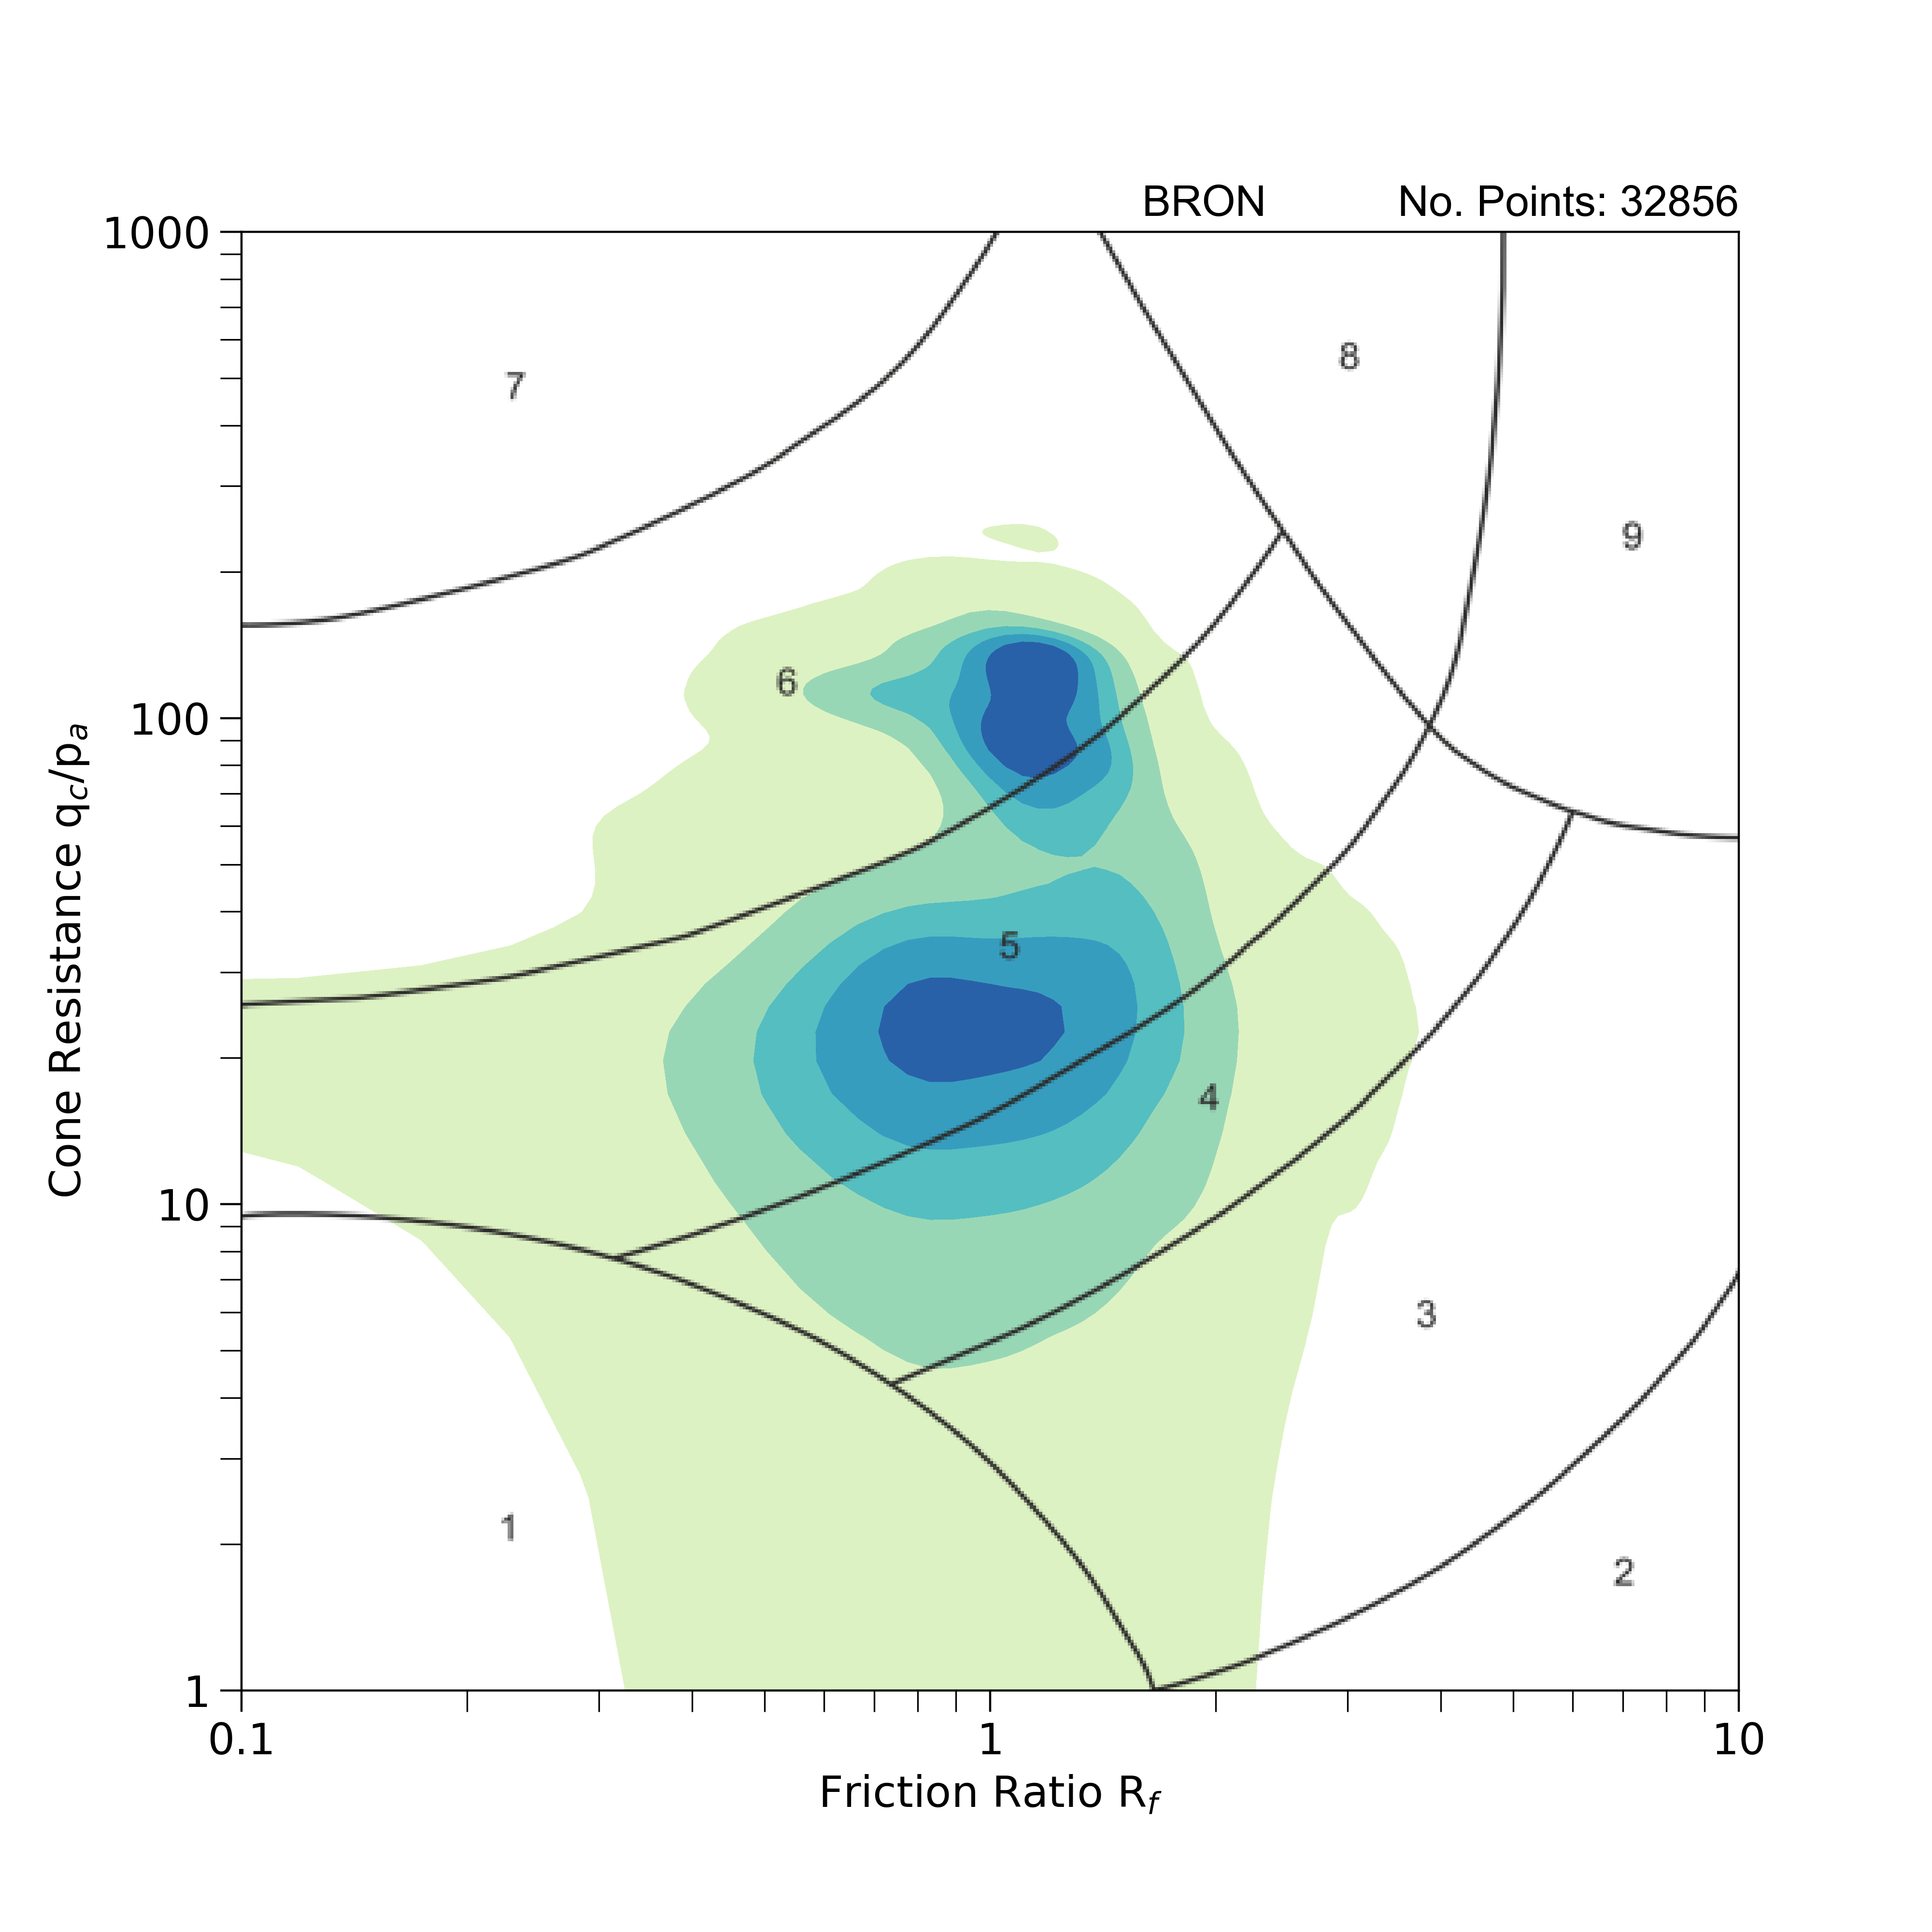
Geotechnical properties: strength tests
Non-normalised soil behaviour type chart after Robertson (2010) with 2D kernel density estimation of dimensionless cone resistance and friction ratio obtained from cone penetration tests. 1: sensitive fine-grained; 2: clay — organic soil; 3: clays — clay to silty clay; 4: silt mixtures — clayey silt and silty clay; 5: sand mixtures — silty sand to sandy silt; 6: sands — clean sands to silty sands; 7: dense sand to gravelly sand; 8: stiff sand to clayey sand (overconsolidated or cemented); 9: stiff fine-grained sand (overconsolidated or cemented). BGS © UKRI.
Gourock Sand Member (GOSA)
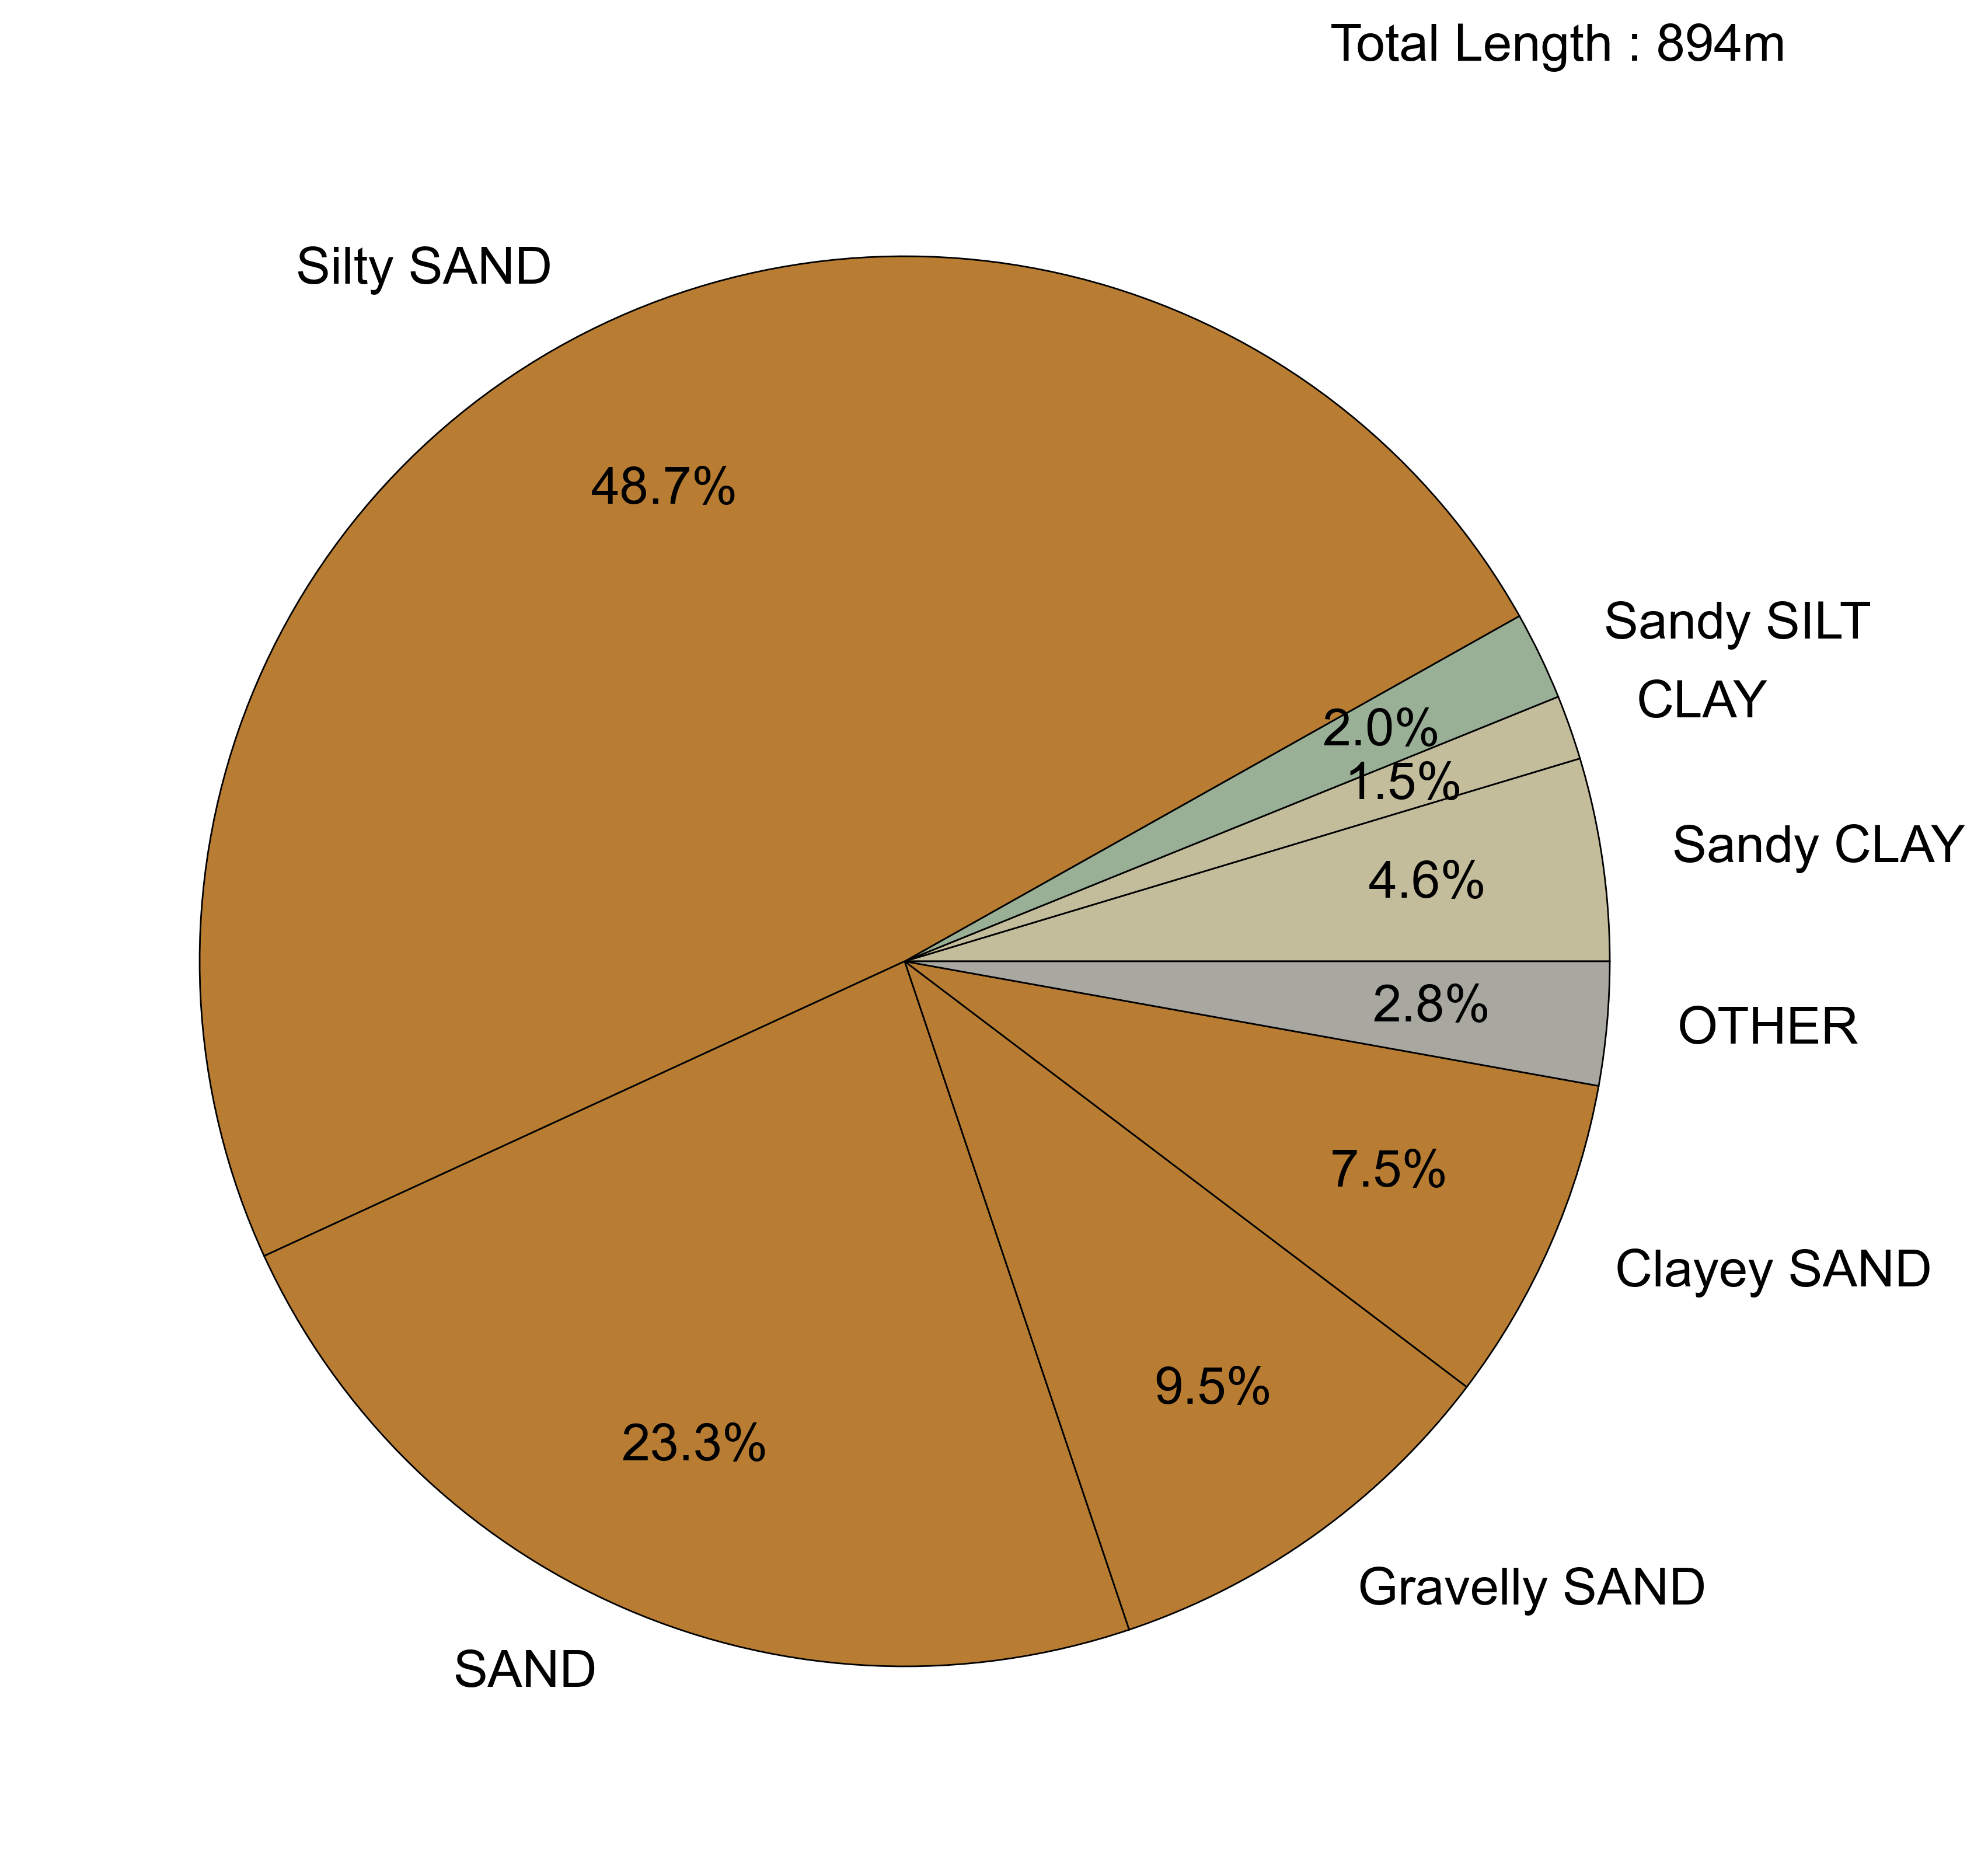
Geological descriptions
Pie chart summarising the dominant soil types (primary and secondary constituents) described in exploratory hole logs based on total metres logged. Descriptions have been simplified to remove tertiary constituents and a threshold of 1 per cent applied to aid graphical presentation. Soil types representing less than 1 per cent of the total logged are included in the ‘other’ category. BGS © UKRI.
Geological descriptions
Histogram summarising the consistency and relative density described in exploratory hole logs based on total metres logged. BGS © UKRI.
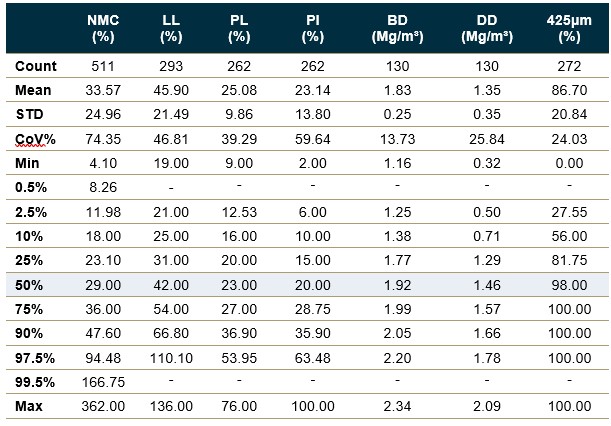
Geotechnical properties: classification tests
Statistical summaries of geotechnical index properties from laboratory tests. STD – standard deviation; CoV% – coefficient of variation; NMC – natural moisture content; LL – liquid limit; PL – plastic limit; PI – plasticity index; BD – bulk density; DD – dry density; 425 μm – percentage of sample by mass passing 425 μm sieve. Percentiles reported based on sample size; no summaries are provided where there are fewer than 5 samples. BGS © UKRI
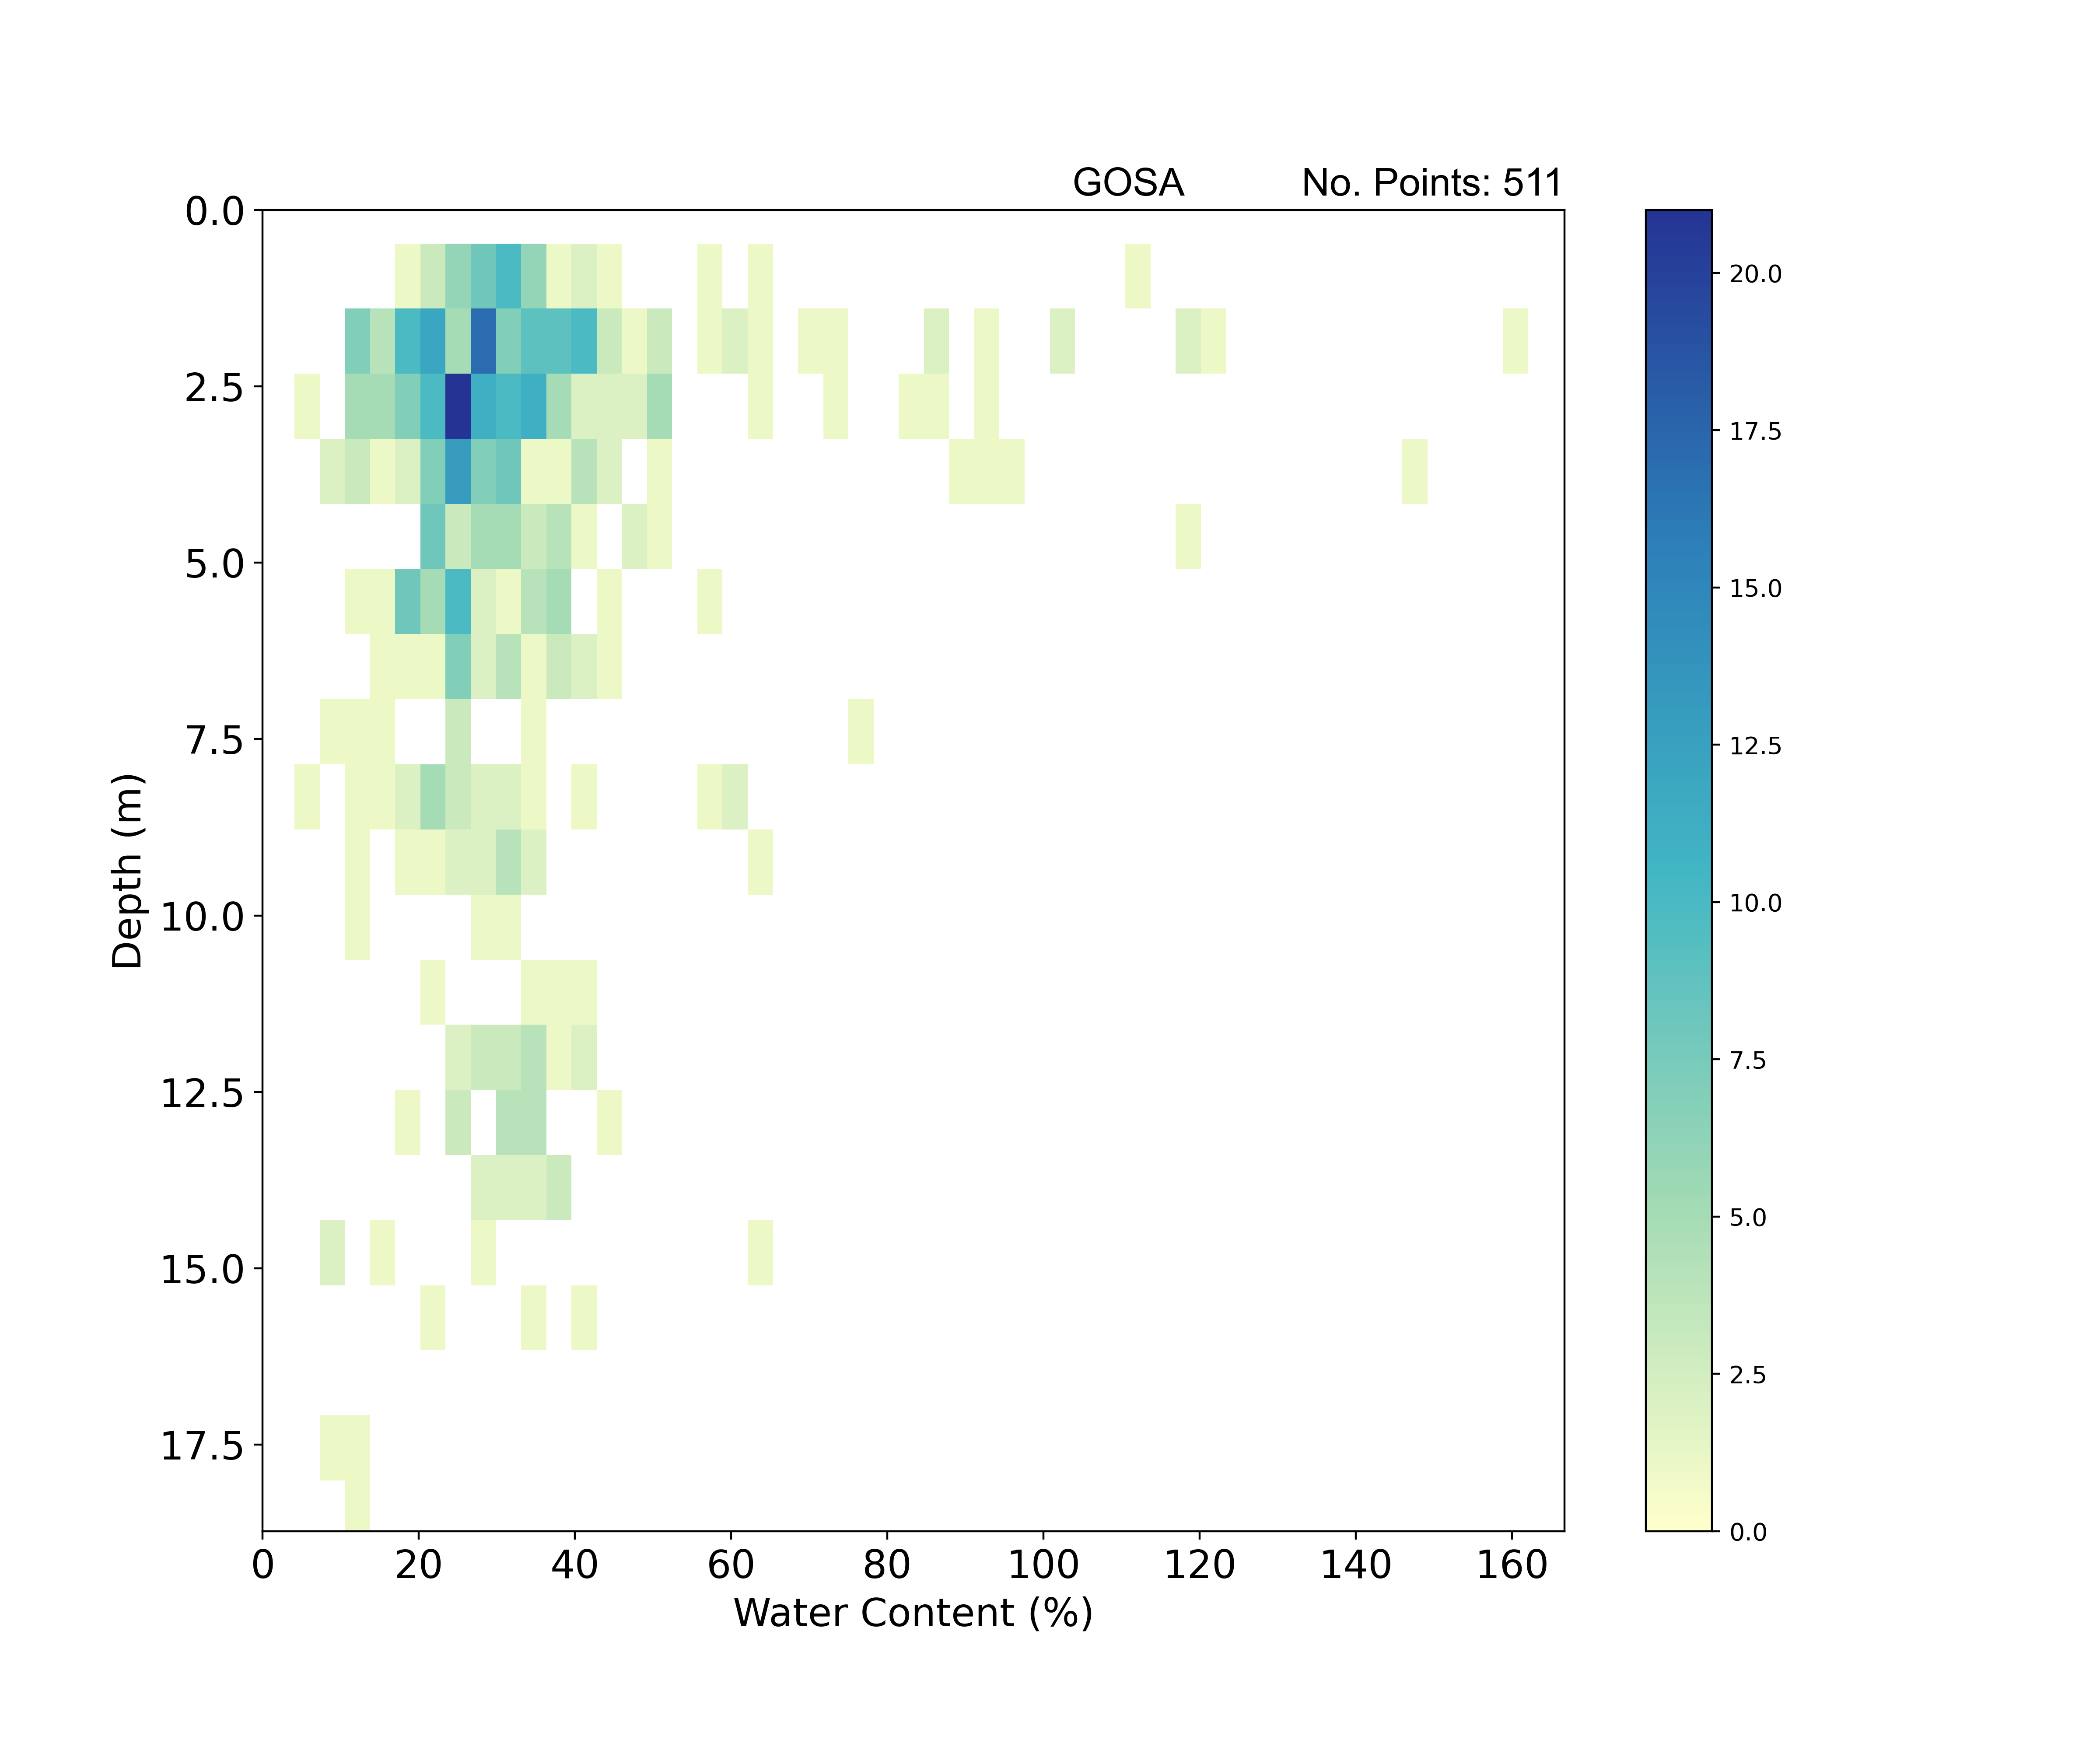
Geotechnical properties: classification tests
2D histogram plot summarising water content with depth. BGS © UKRI.
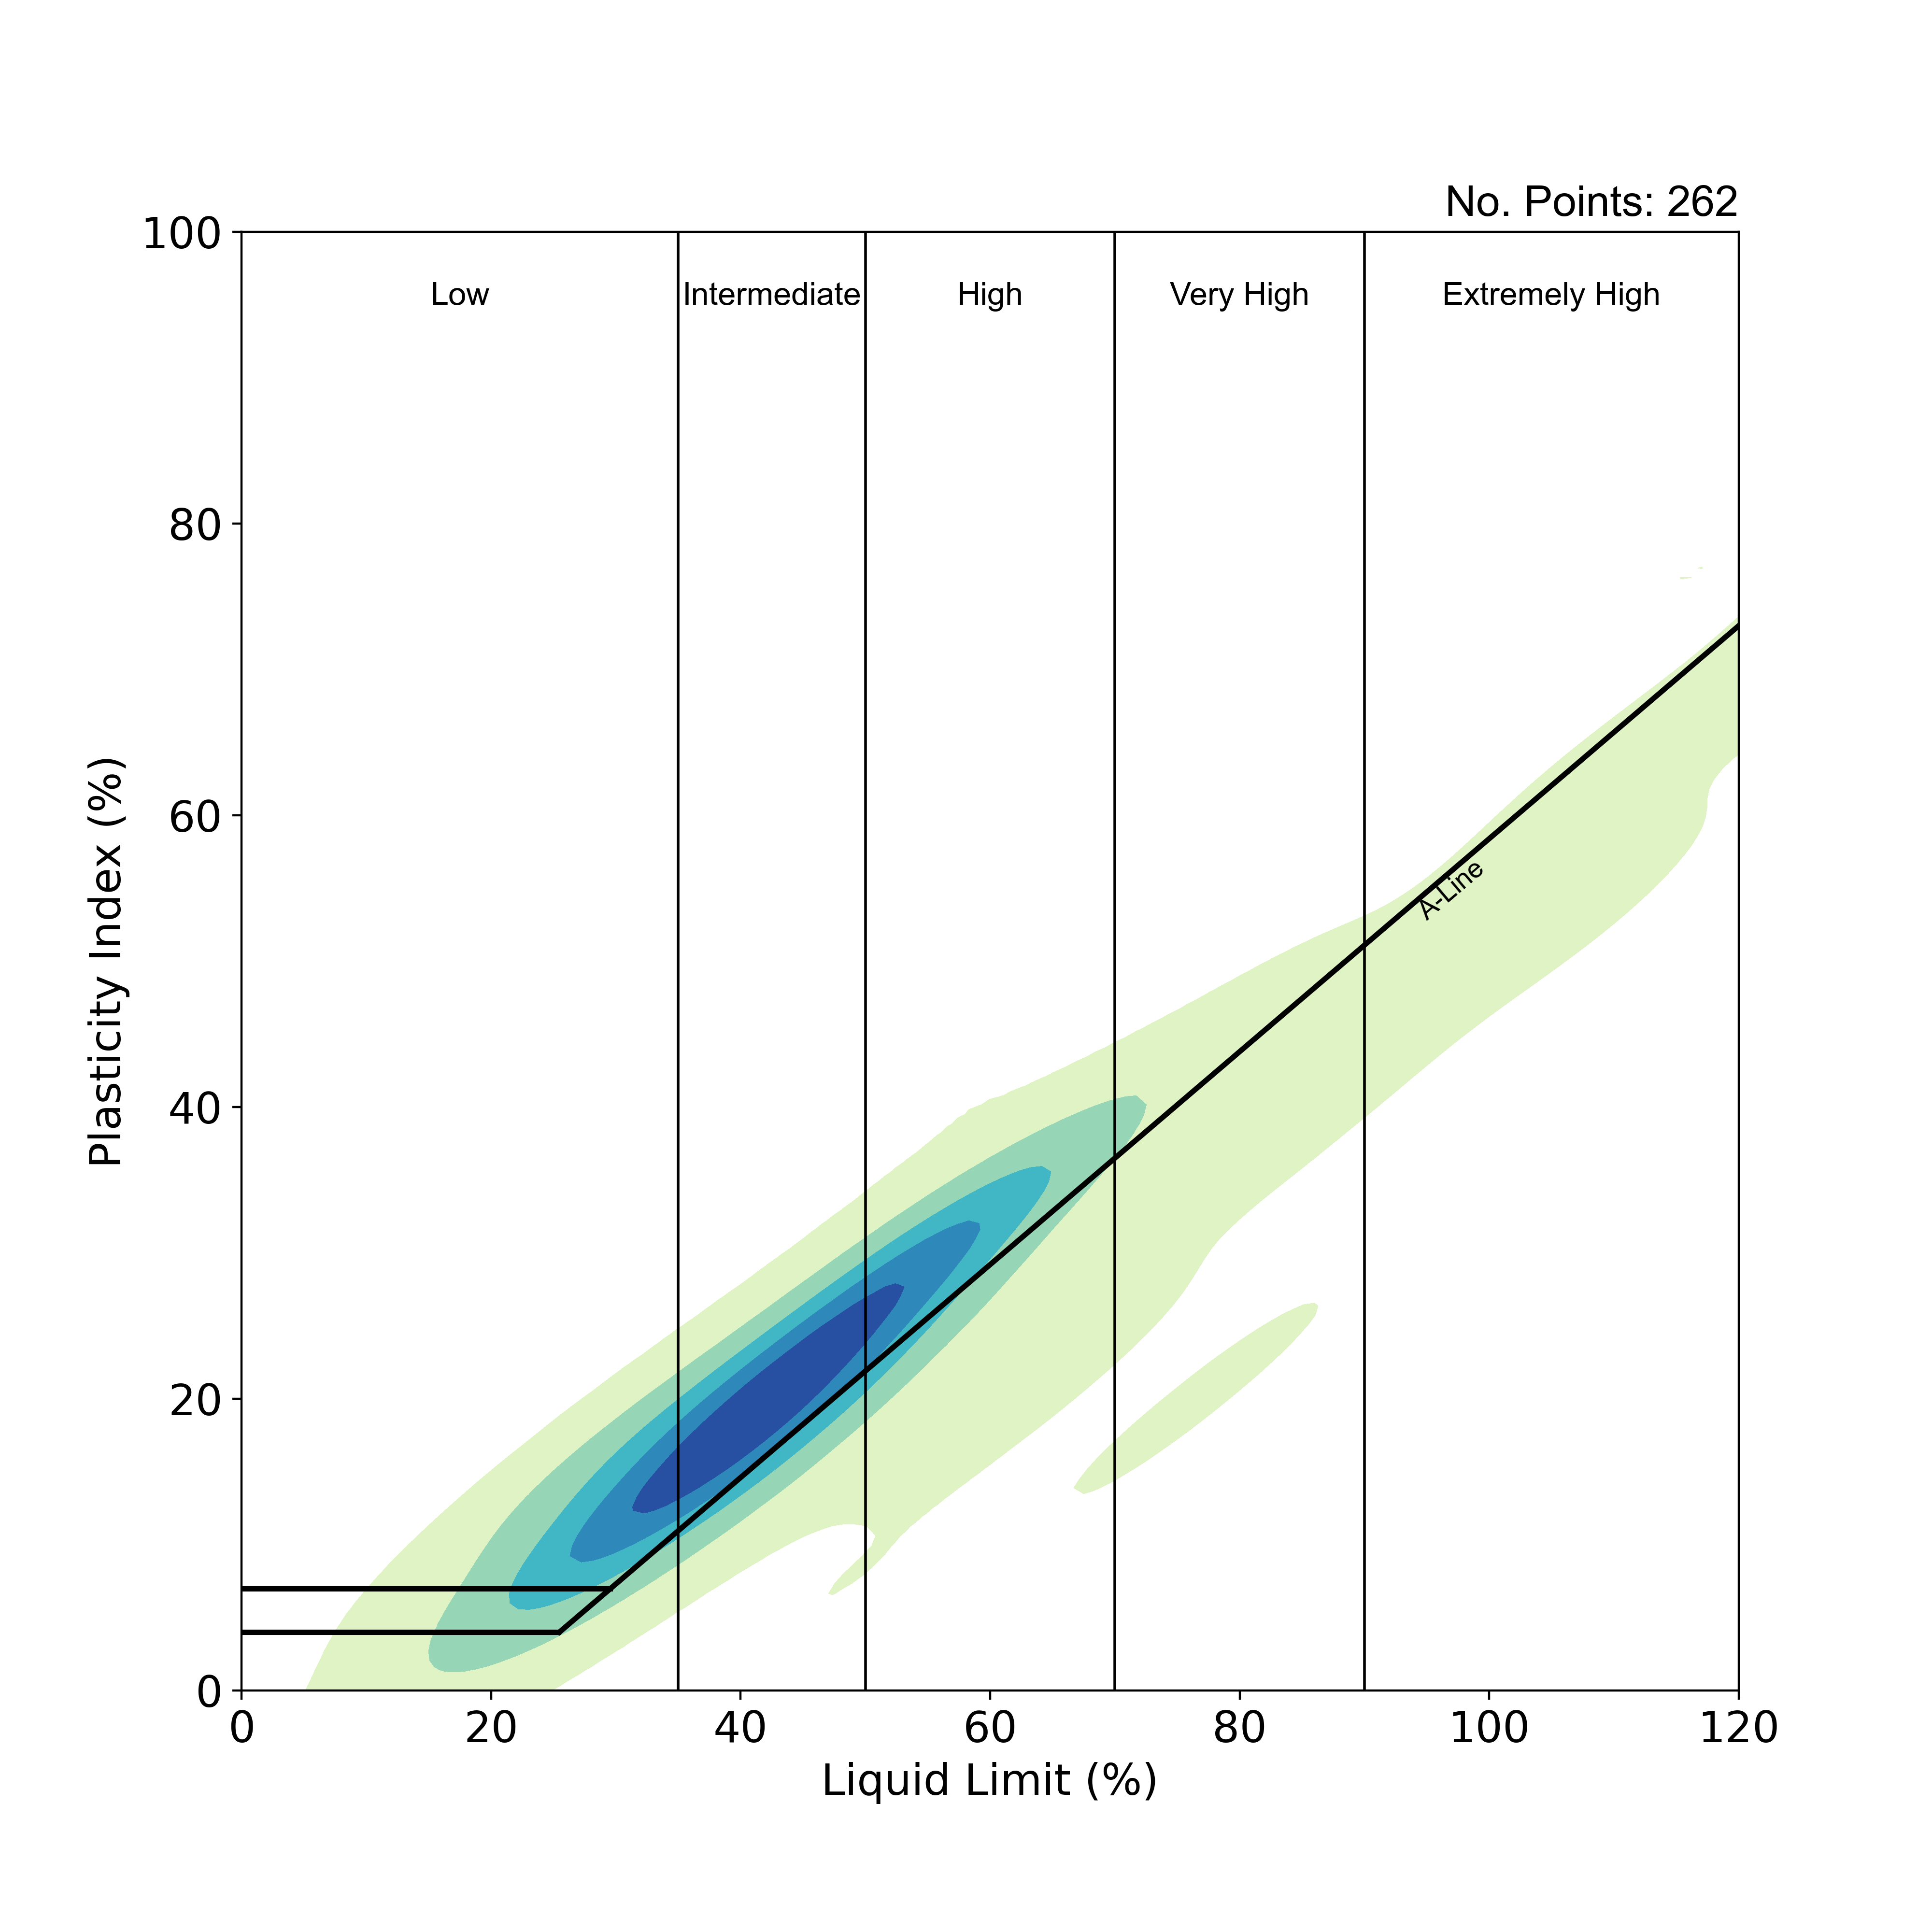
Geotechnical properties: classification tests
Casagrande plasticity plot summarising the distribution of plasticity results with a 2D kernel density estimation. Each colour represents a region of equal probability density (about 20 per cent for each area), with the darker colours representing higher values for probability density. BGS © UKRI.
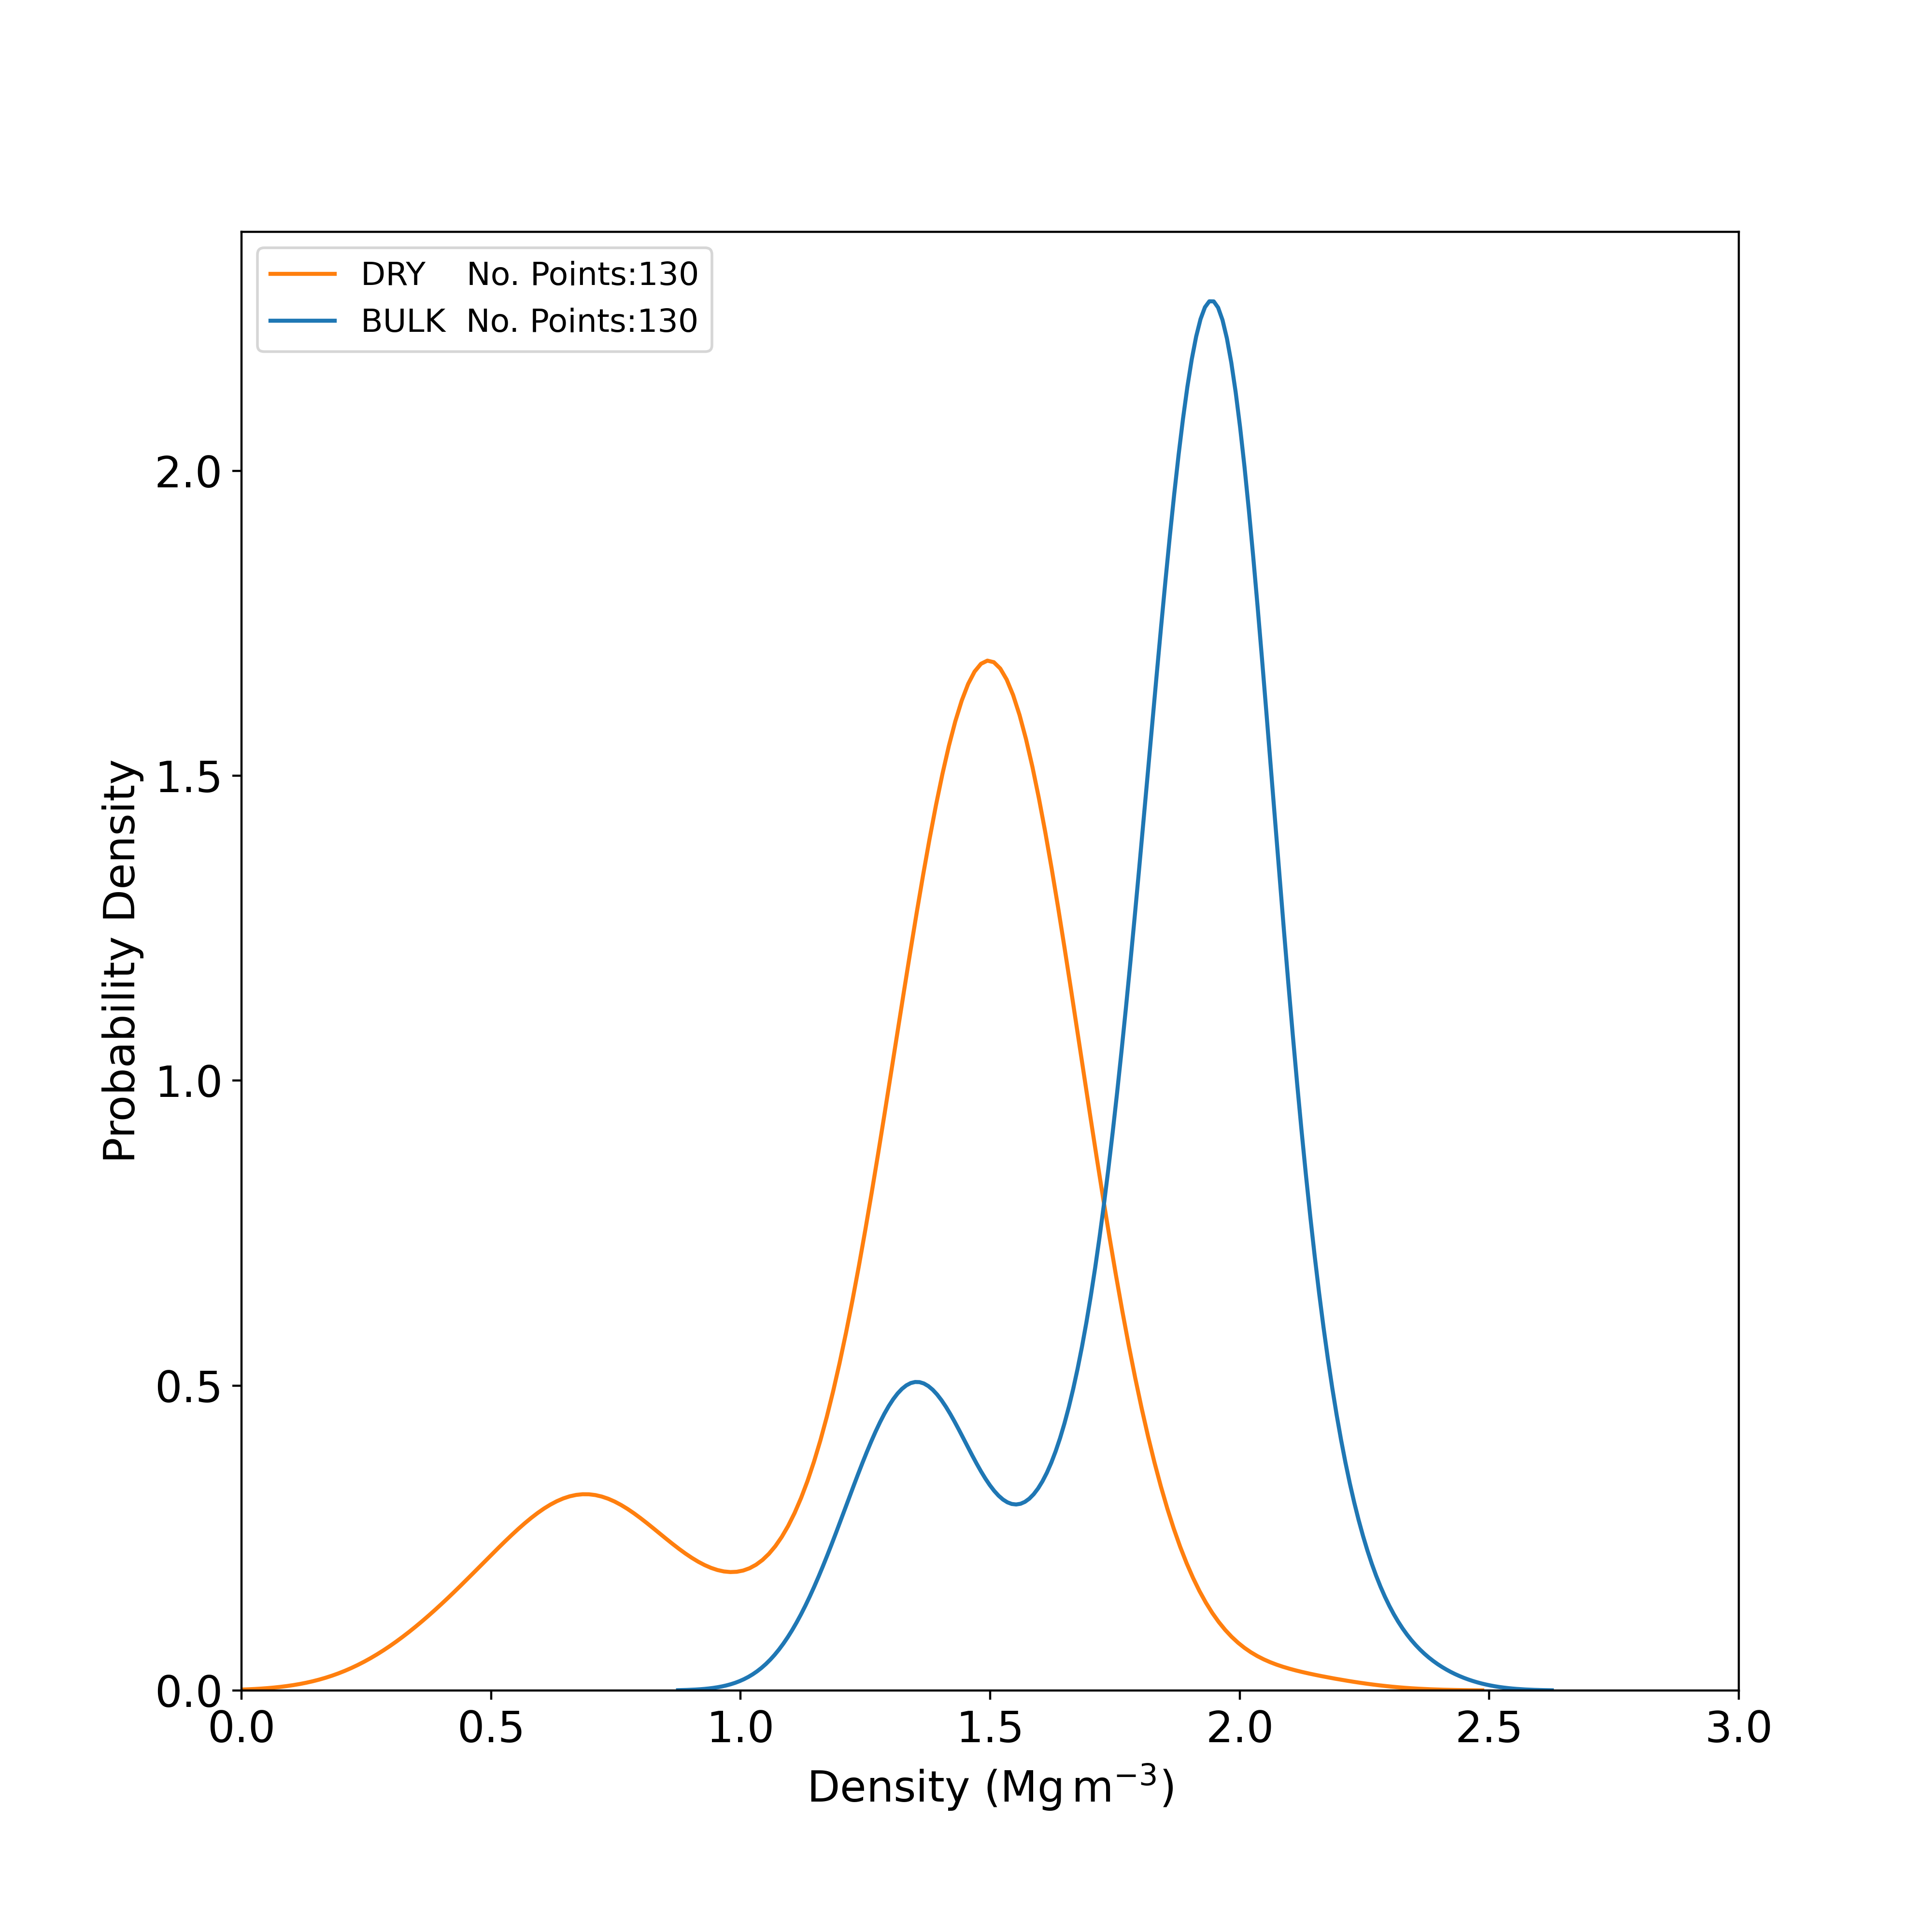
Geotechnical properties: classification tests
Kernel density plot showing the distribution of bulk density and dry density results obtained from laboratory tests. BGS © UKRI.
Geotechnical properties: strength tests
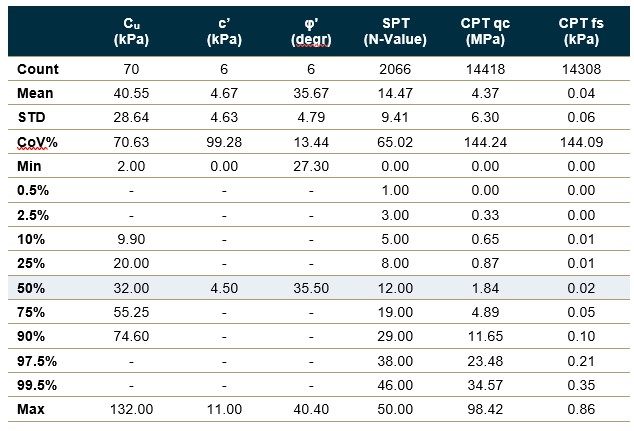
Statistical summaries of geotechnical strength properties from laboratory and in situ tests. STD – standard deviation; CoV% – coefficient of variation; Cu – undrained shear strength obtained from unconsolidated undrained triaxial tests; c’ – effective cohesion obtained from consolidated undrained triaxial tests with pore pressure measurements and consolidated drained triaxial tests; φ’ – effective internal friction angle obtained from consolidated undrained triaxial tests with pore pressure measurements and consolidated drained triaxial tests ; SPT – standard penetration test (number of tests with N-value > 50 or with no N-value = 85); CPT qc – cone penetration test resistance; CPT fs – cone penetration test friction (negative friction values removed for statistical analysis) . Percentiles reported based on sample size; no summaries are provided where there are fewer than 5 samples. BGS © UKRI
Geotechnical properties: strength tests
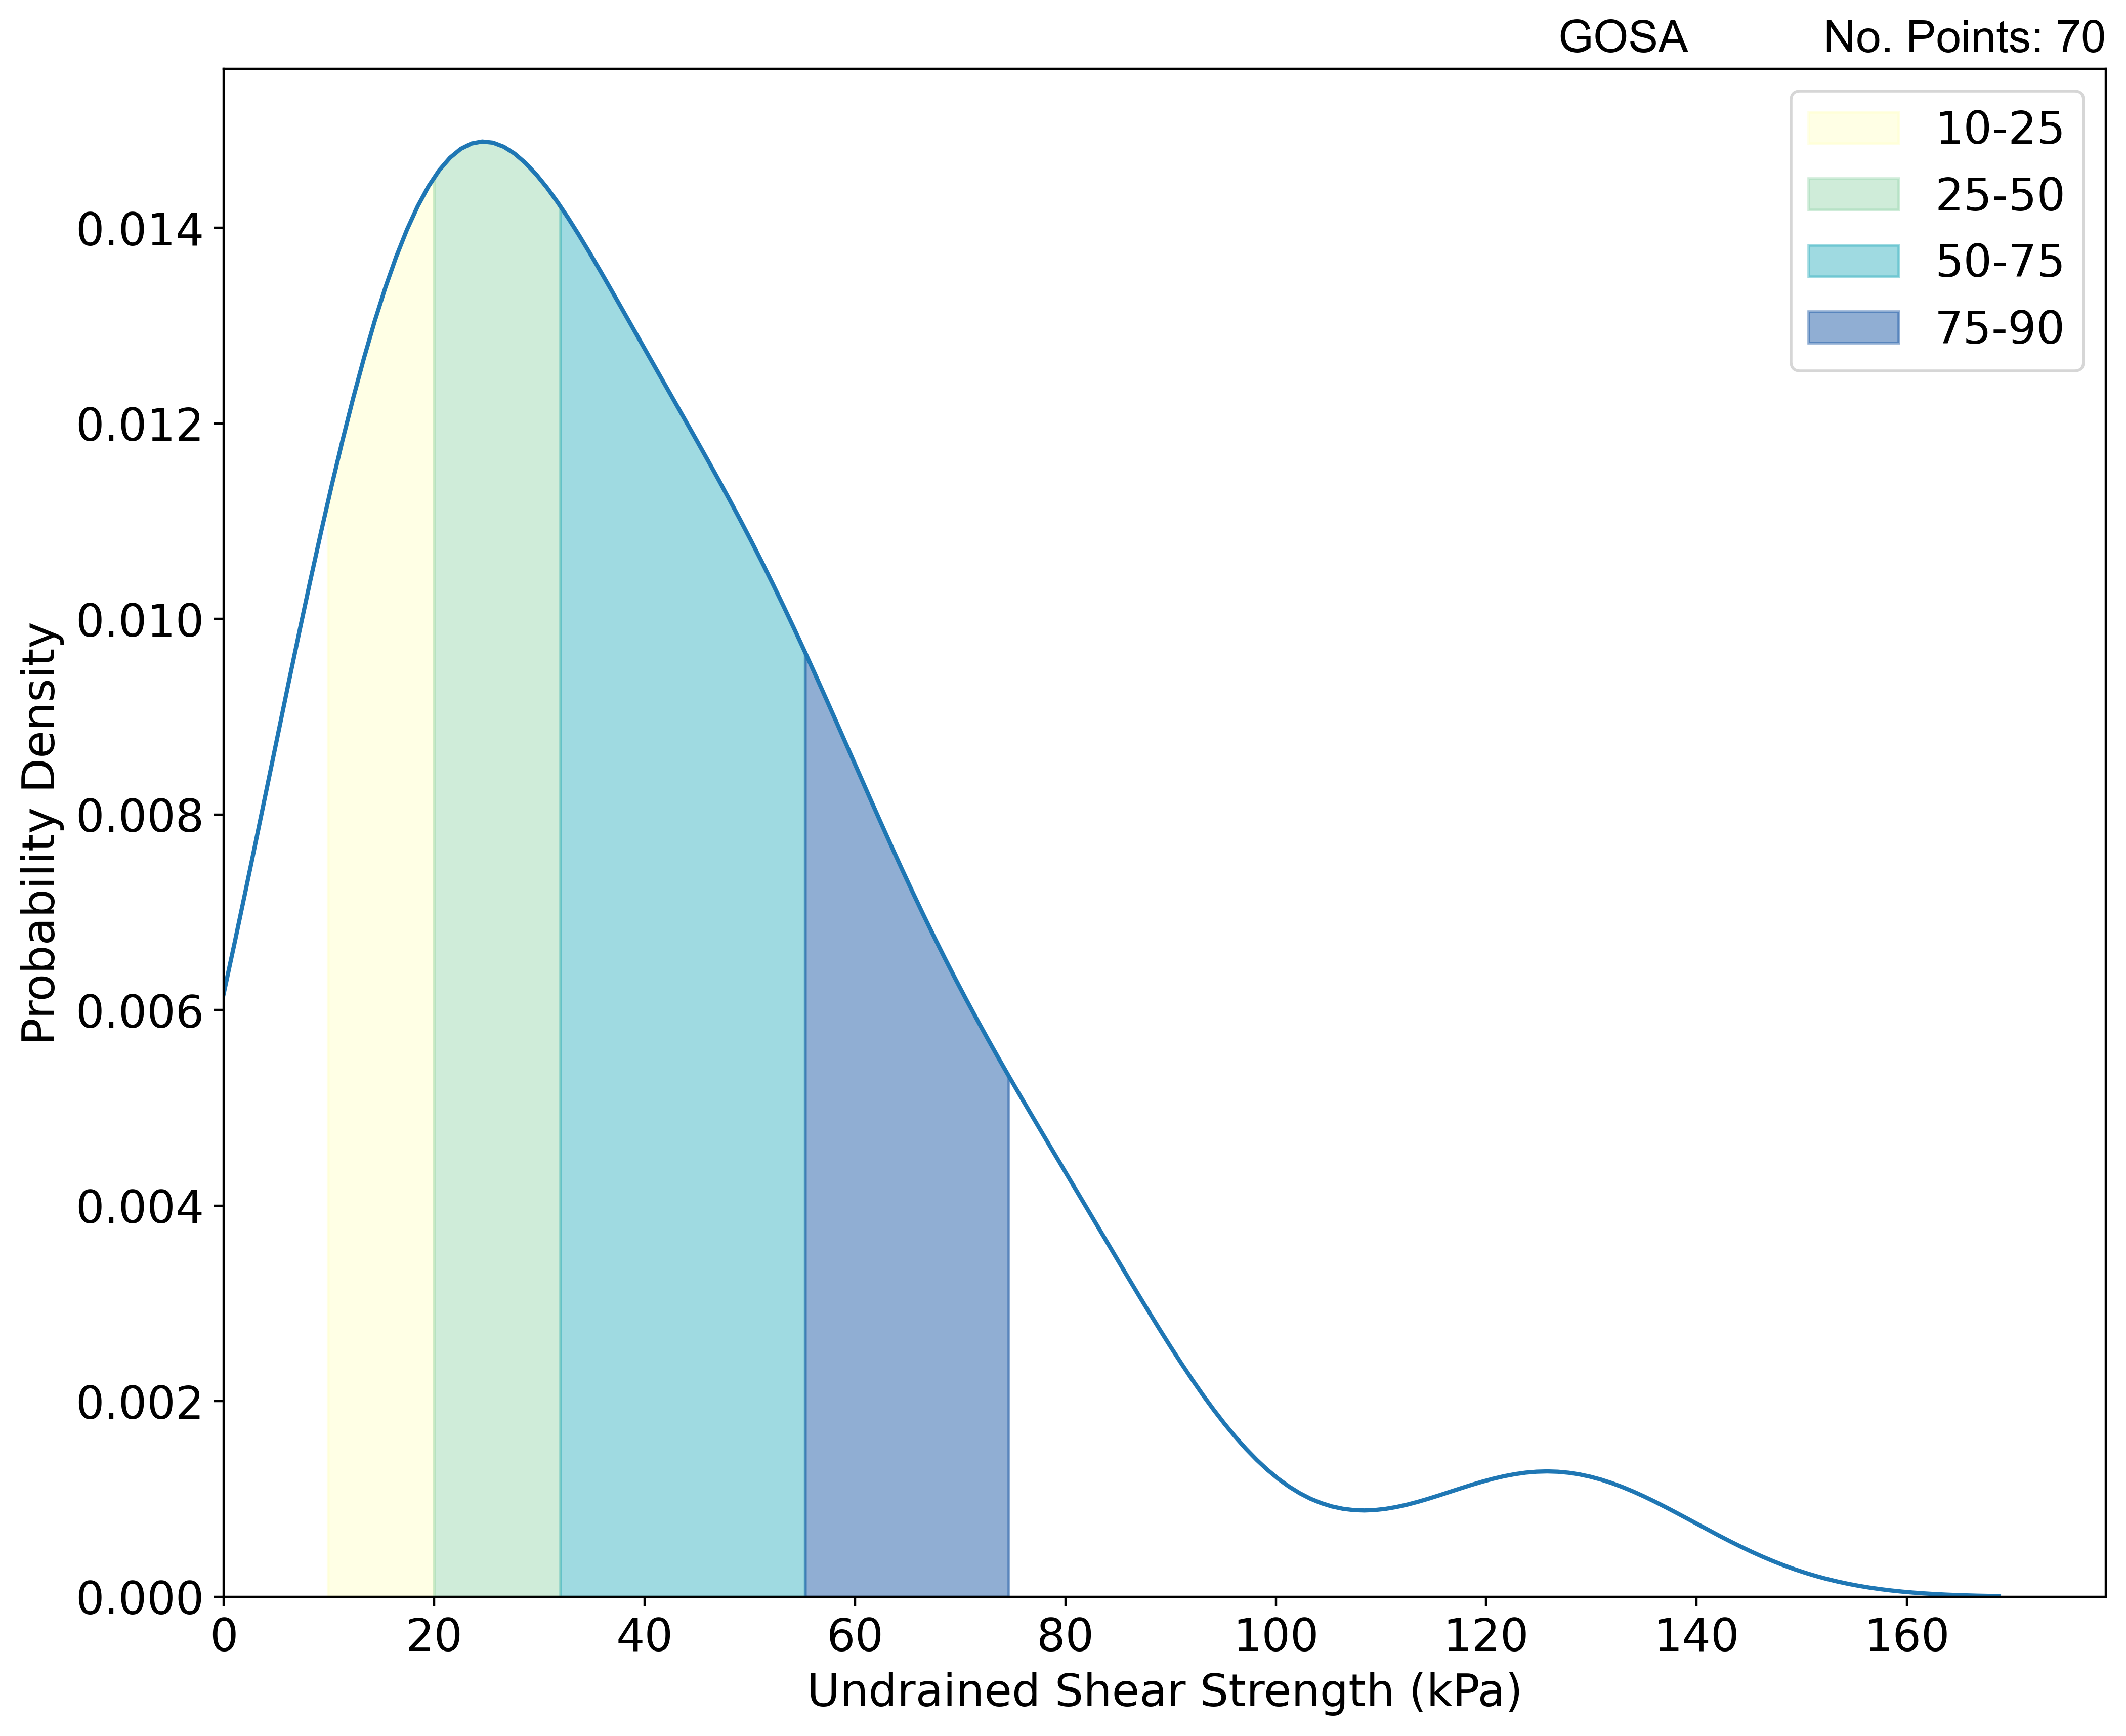
Kernel density plot showing the distribution of undrained shear strength results obtained from unconsolidated undrained triaxial laboratory tests with percentile ranges from statistical analysis superimposed as coloured segments for reference. BGS © UKRI.
Geotechnical properties: strength tests
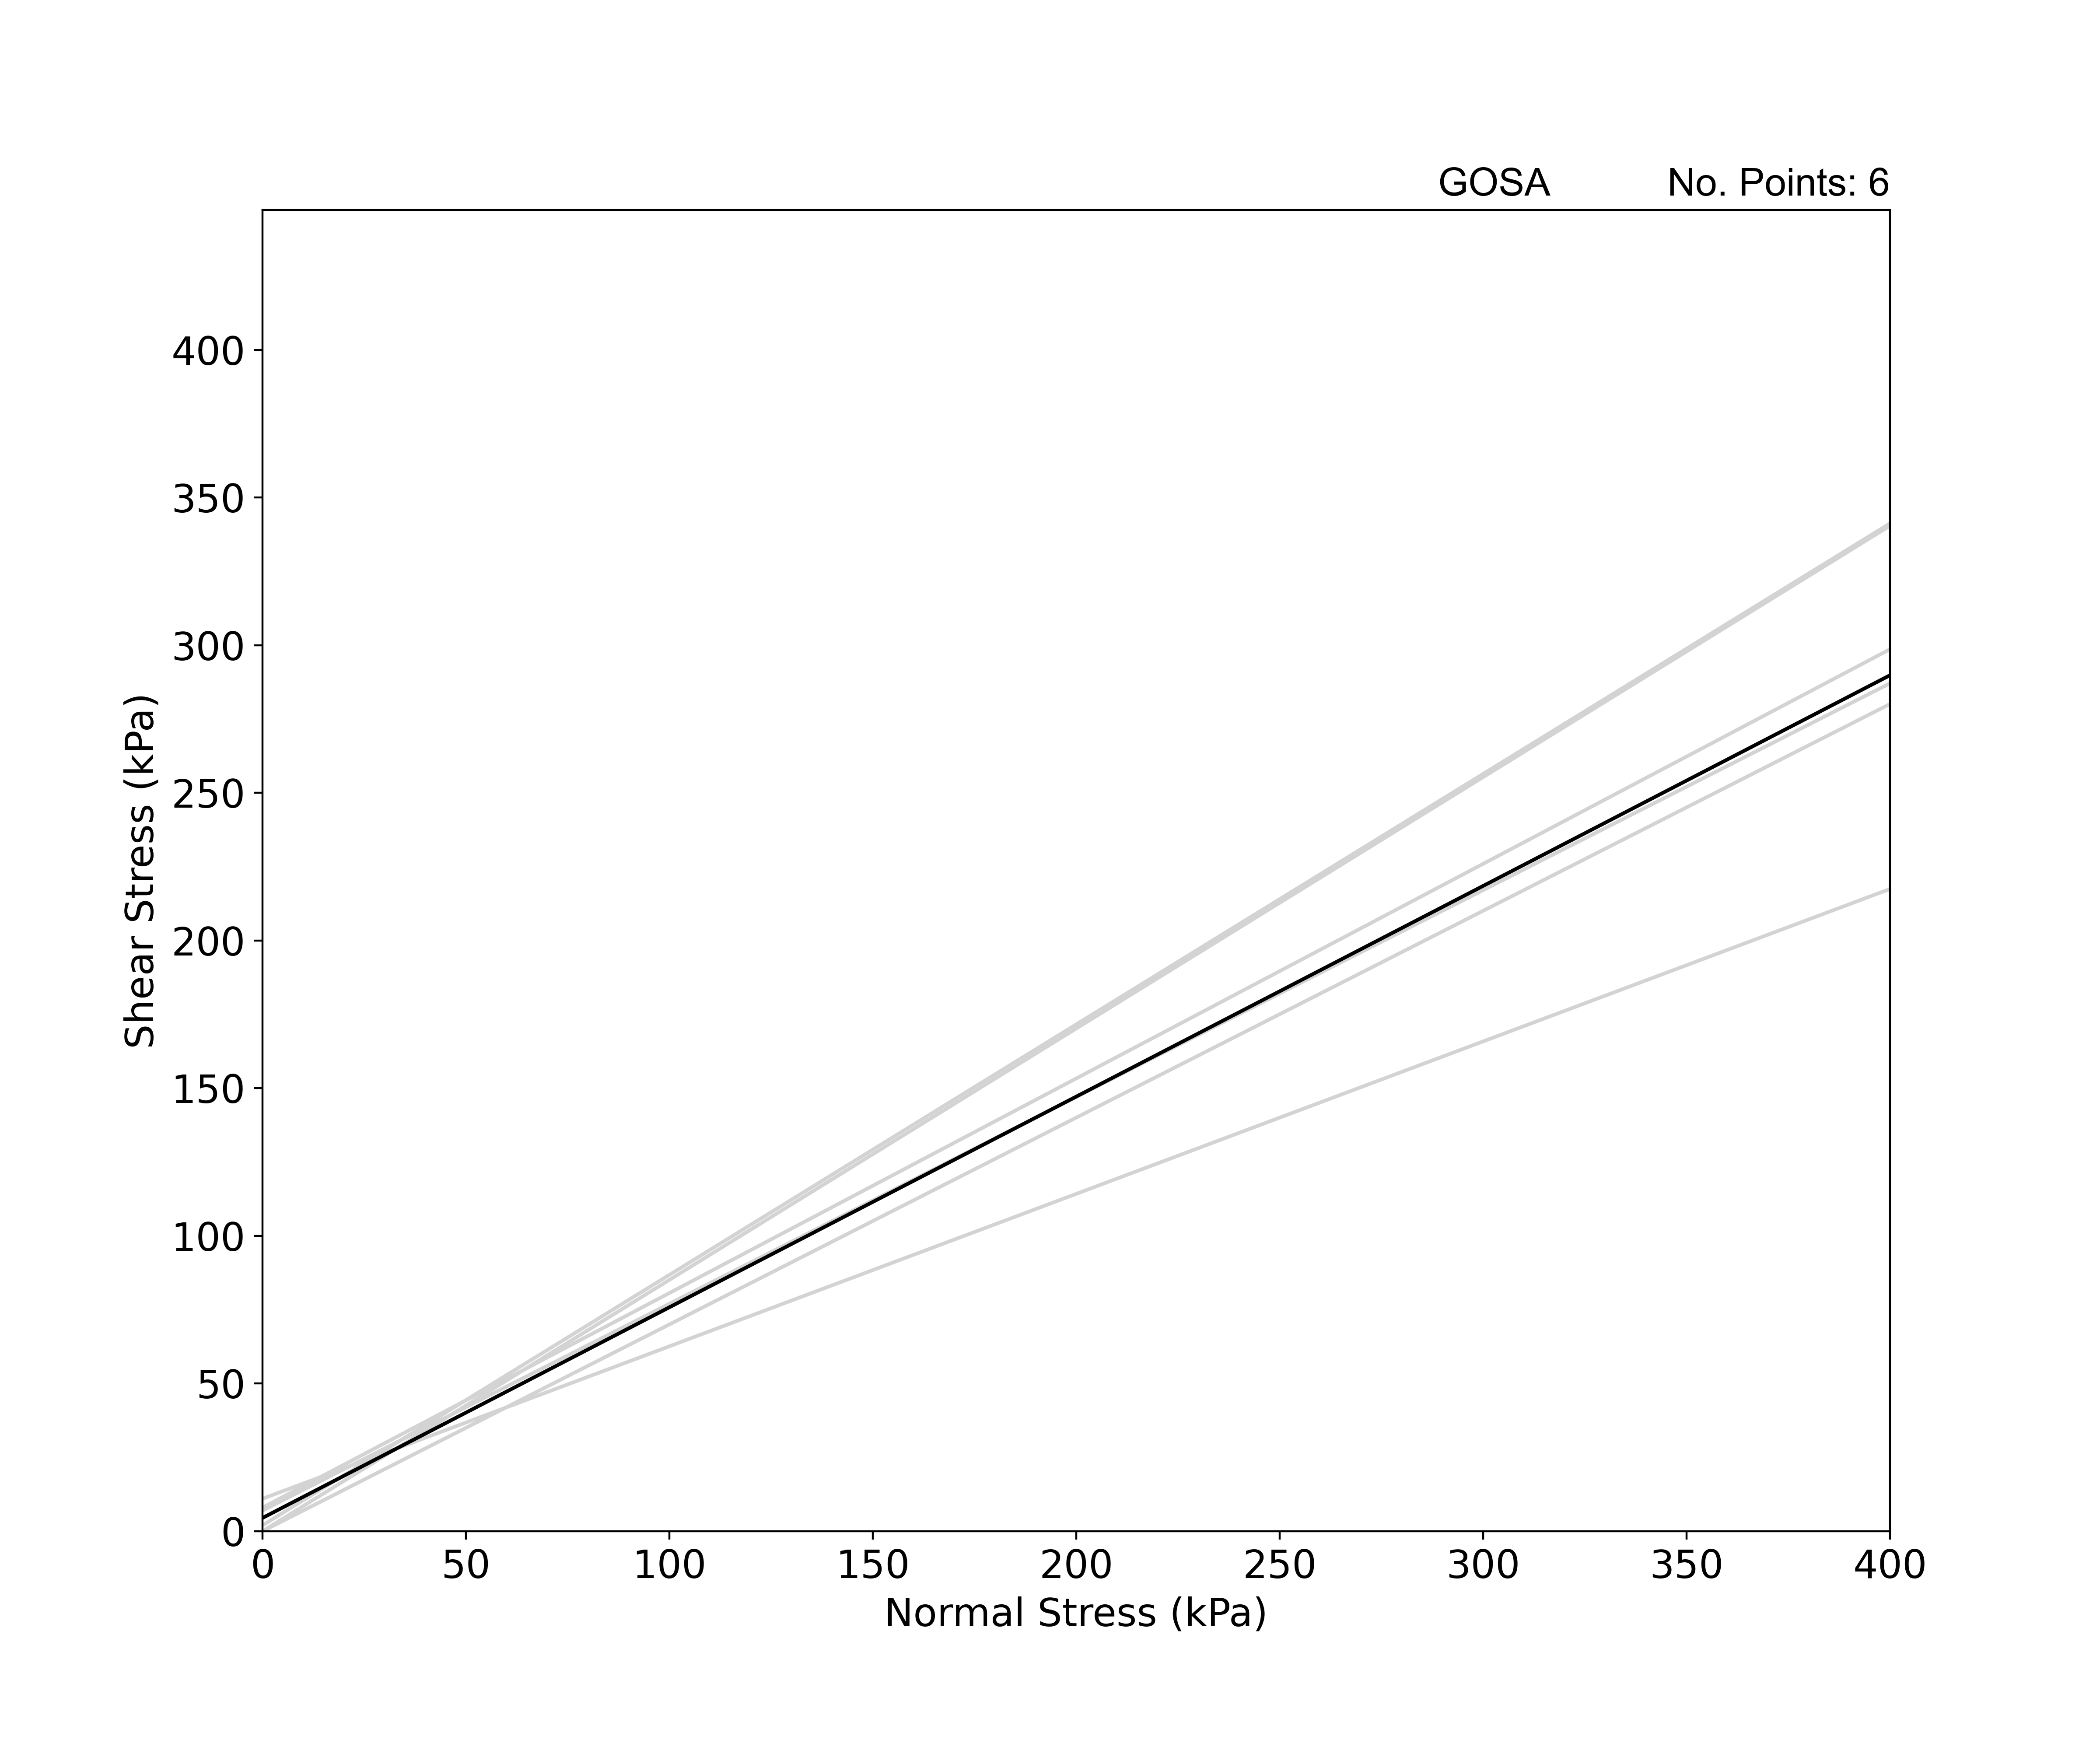
Mohr-Coulomb failure plot showing individual failure envelopes (light grey) and median failure envelop (black) based on effective cohesion and phi values obtained from consolidated drained triaxial tests and consolidated undrained triaxial tests with pore pressure measurements. BGS © UKRI.
Geotechnical properties: strength tests
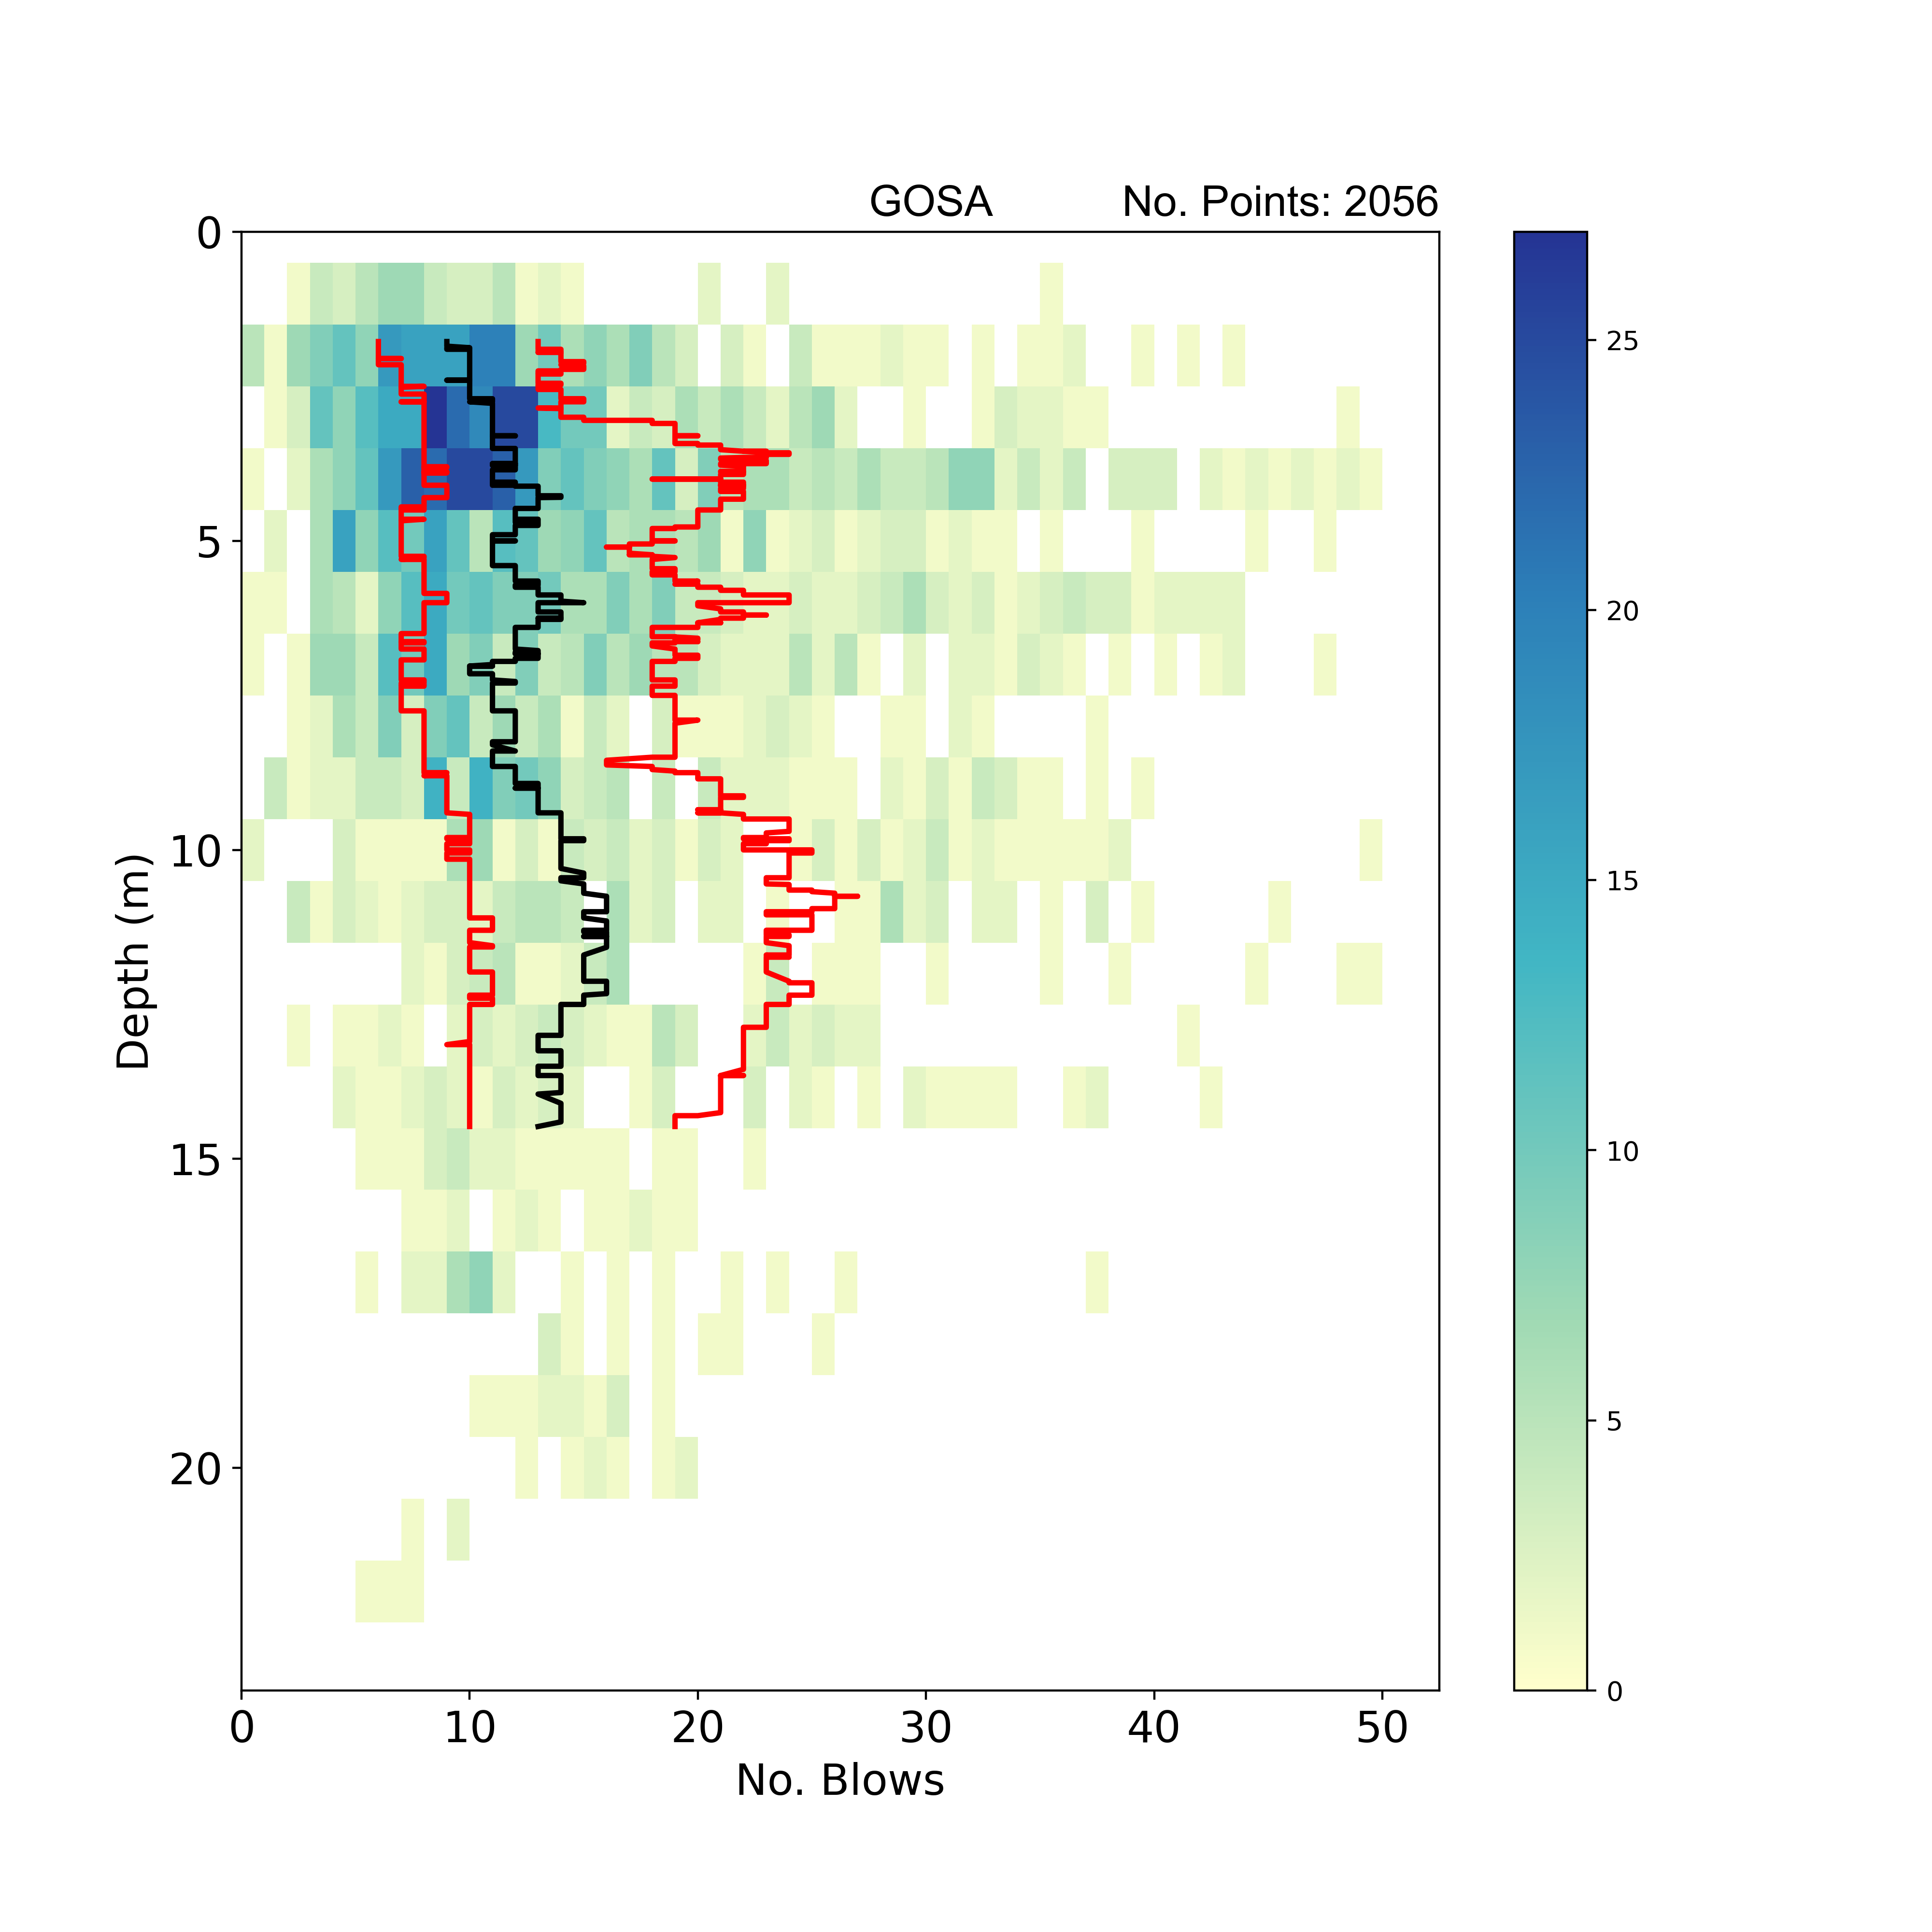
2D histogram summarising SPT N-value results with depth. Black line: SPT N-value with depth trend using a rolling window median (window width = 10 per cent sample number); red lines: SPT N-value with depth trend using a rolling window of 25th and 75th percentile (window width = 10 per cent sample number). Number of tests with N-value > 50 or with no N-value = 85. BGS © UKRI.
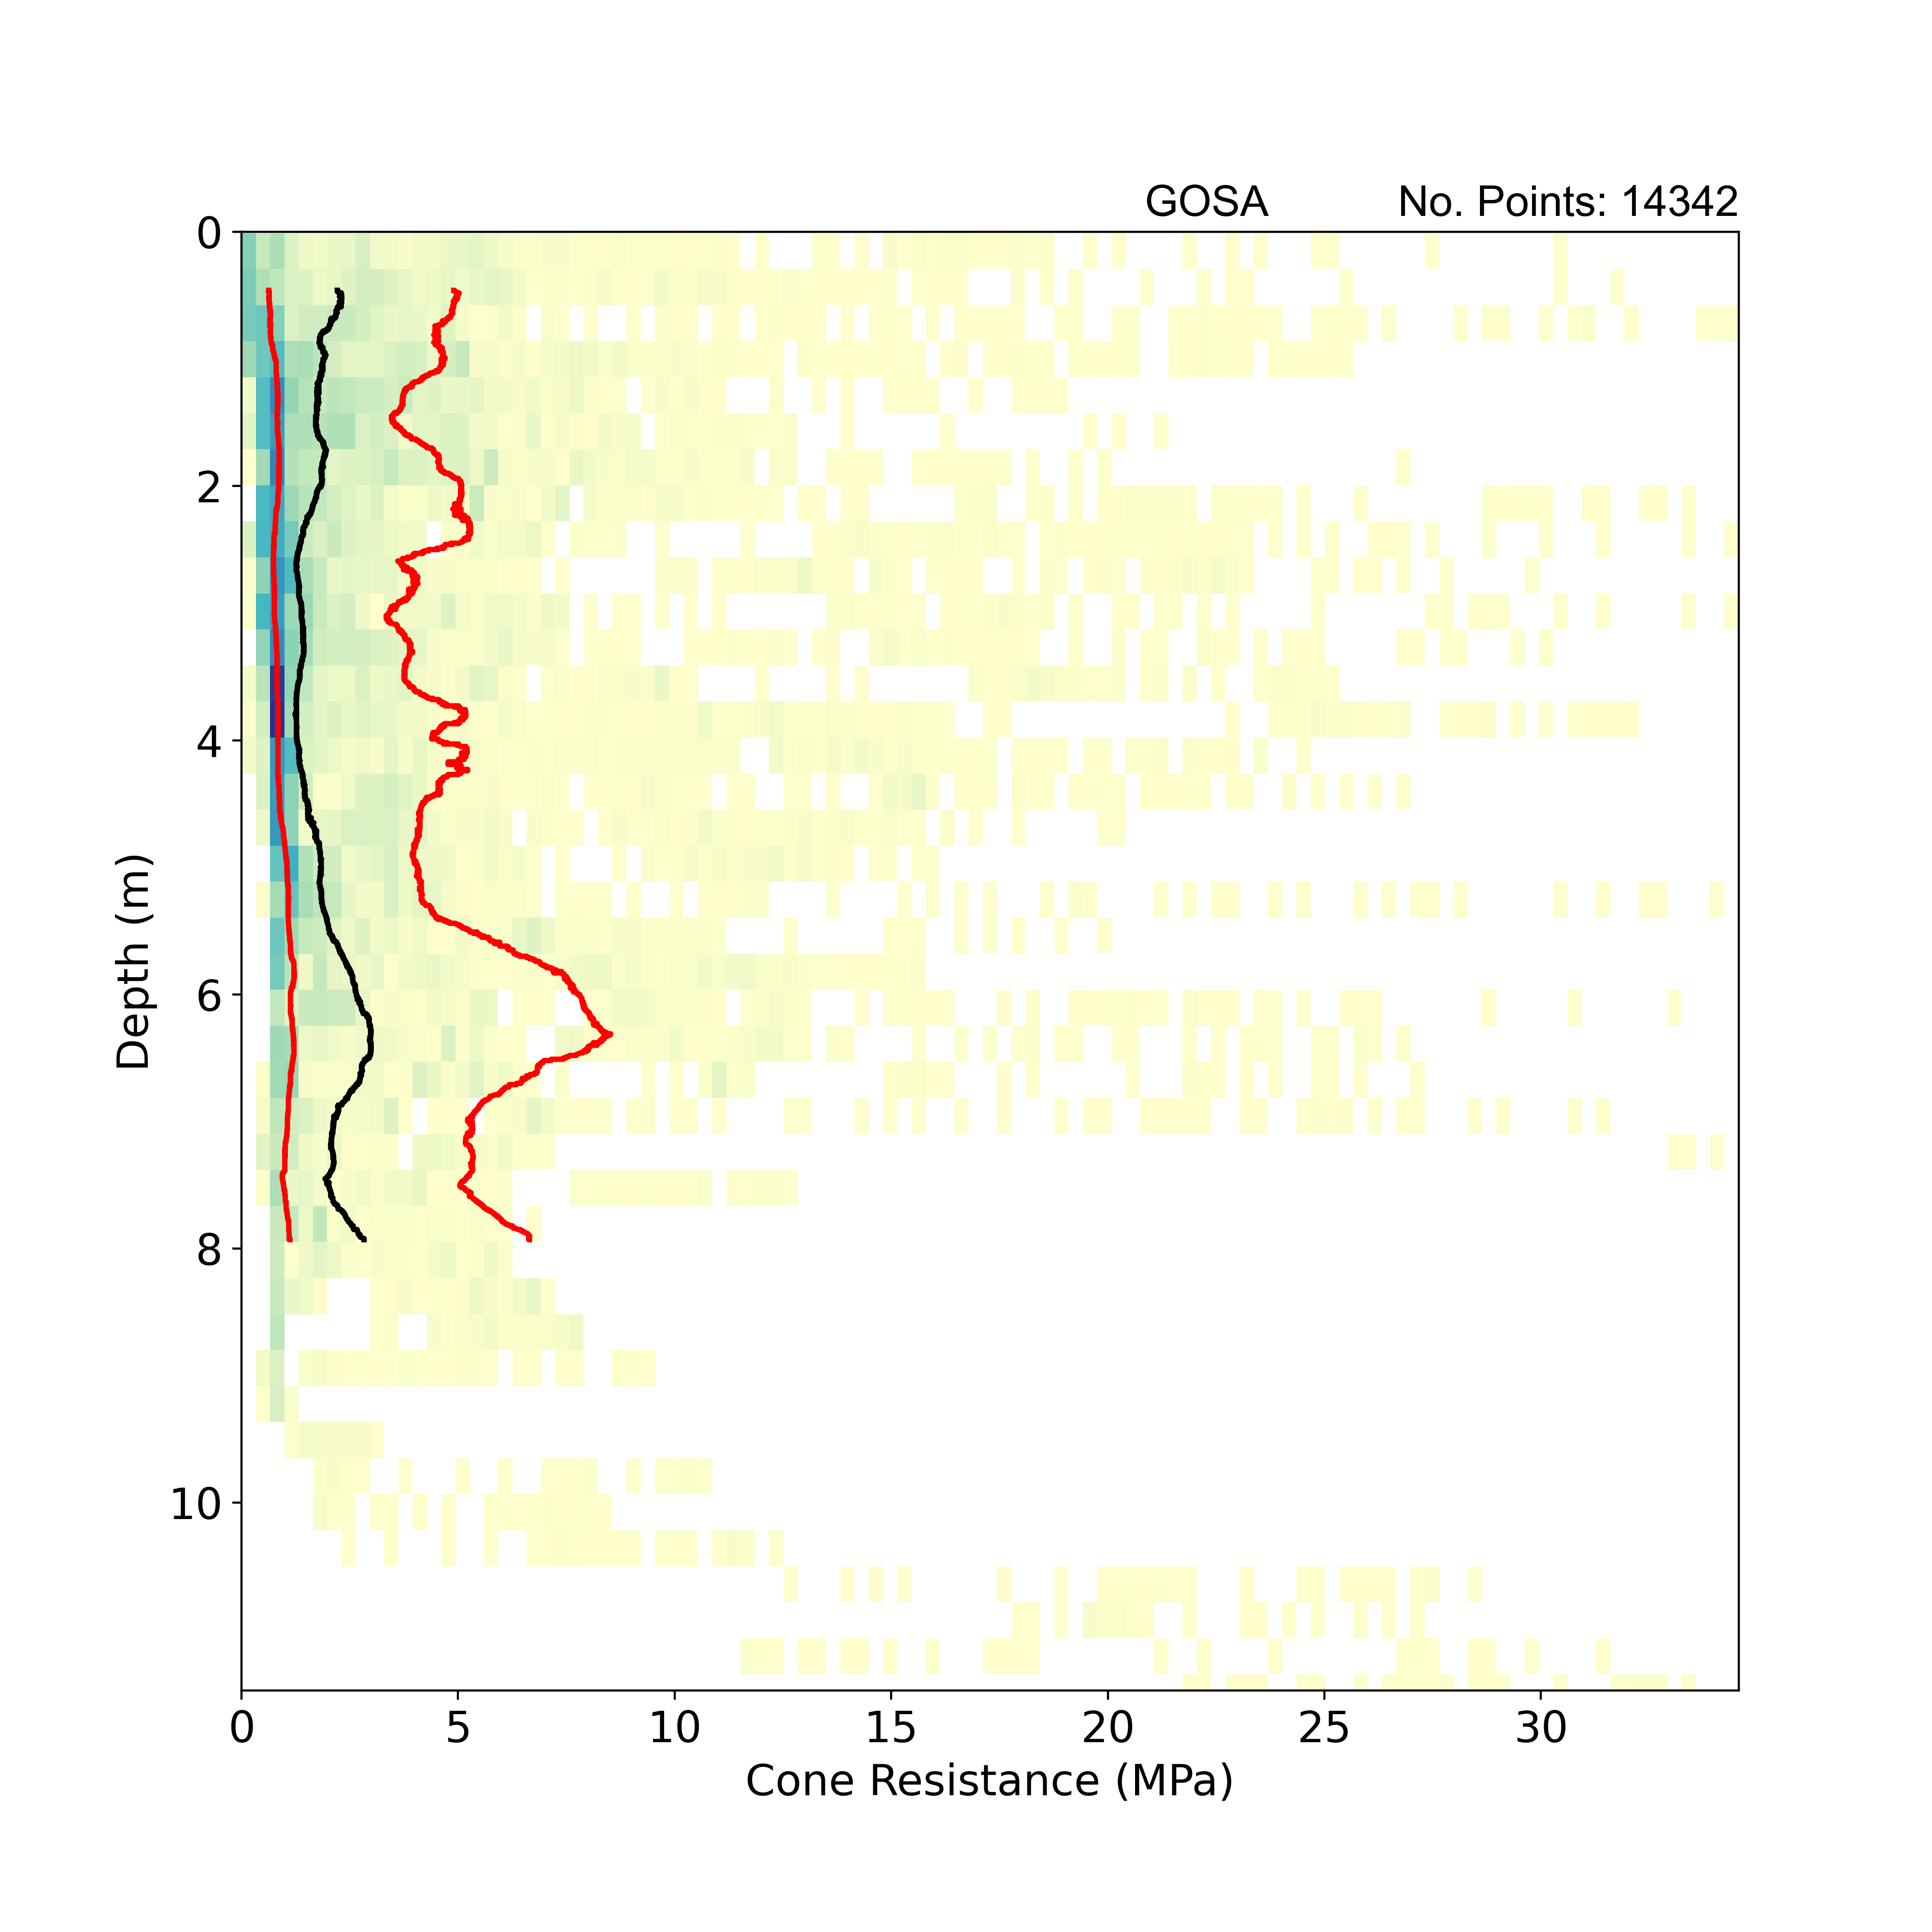
Geotechnical properties: strength tests
2D histogram summarising cone resistance with depth obtained from static cone penetration tests. Black line: cone resistance with depth trend using a rolling window median (window width = 10 per cent sample number); red lines: cone resistance with depth trend using a rolling window of 25th and 75th percentile (window width = 10 per cent sample number). BGS © UKRI.
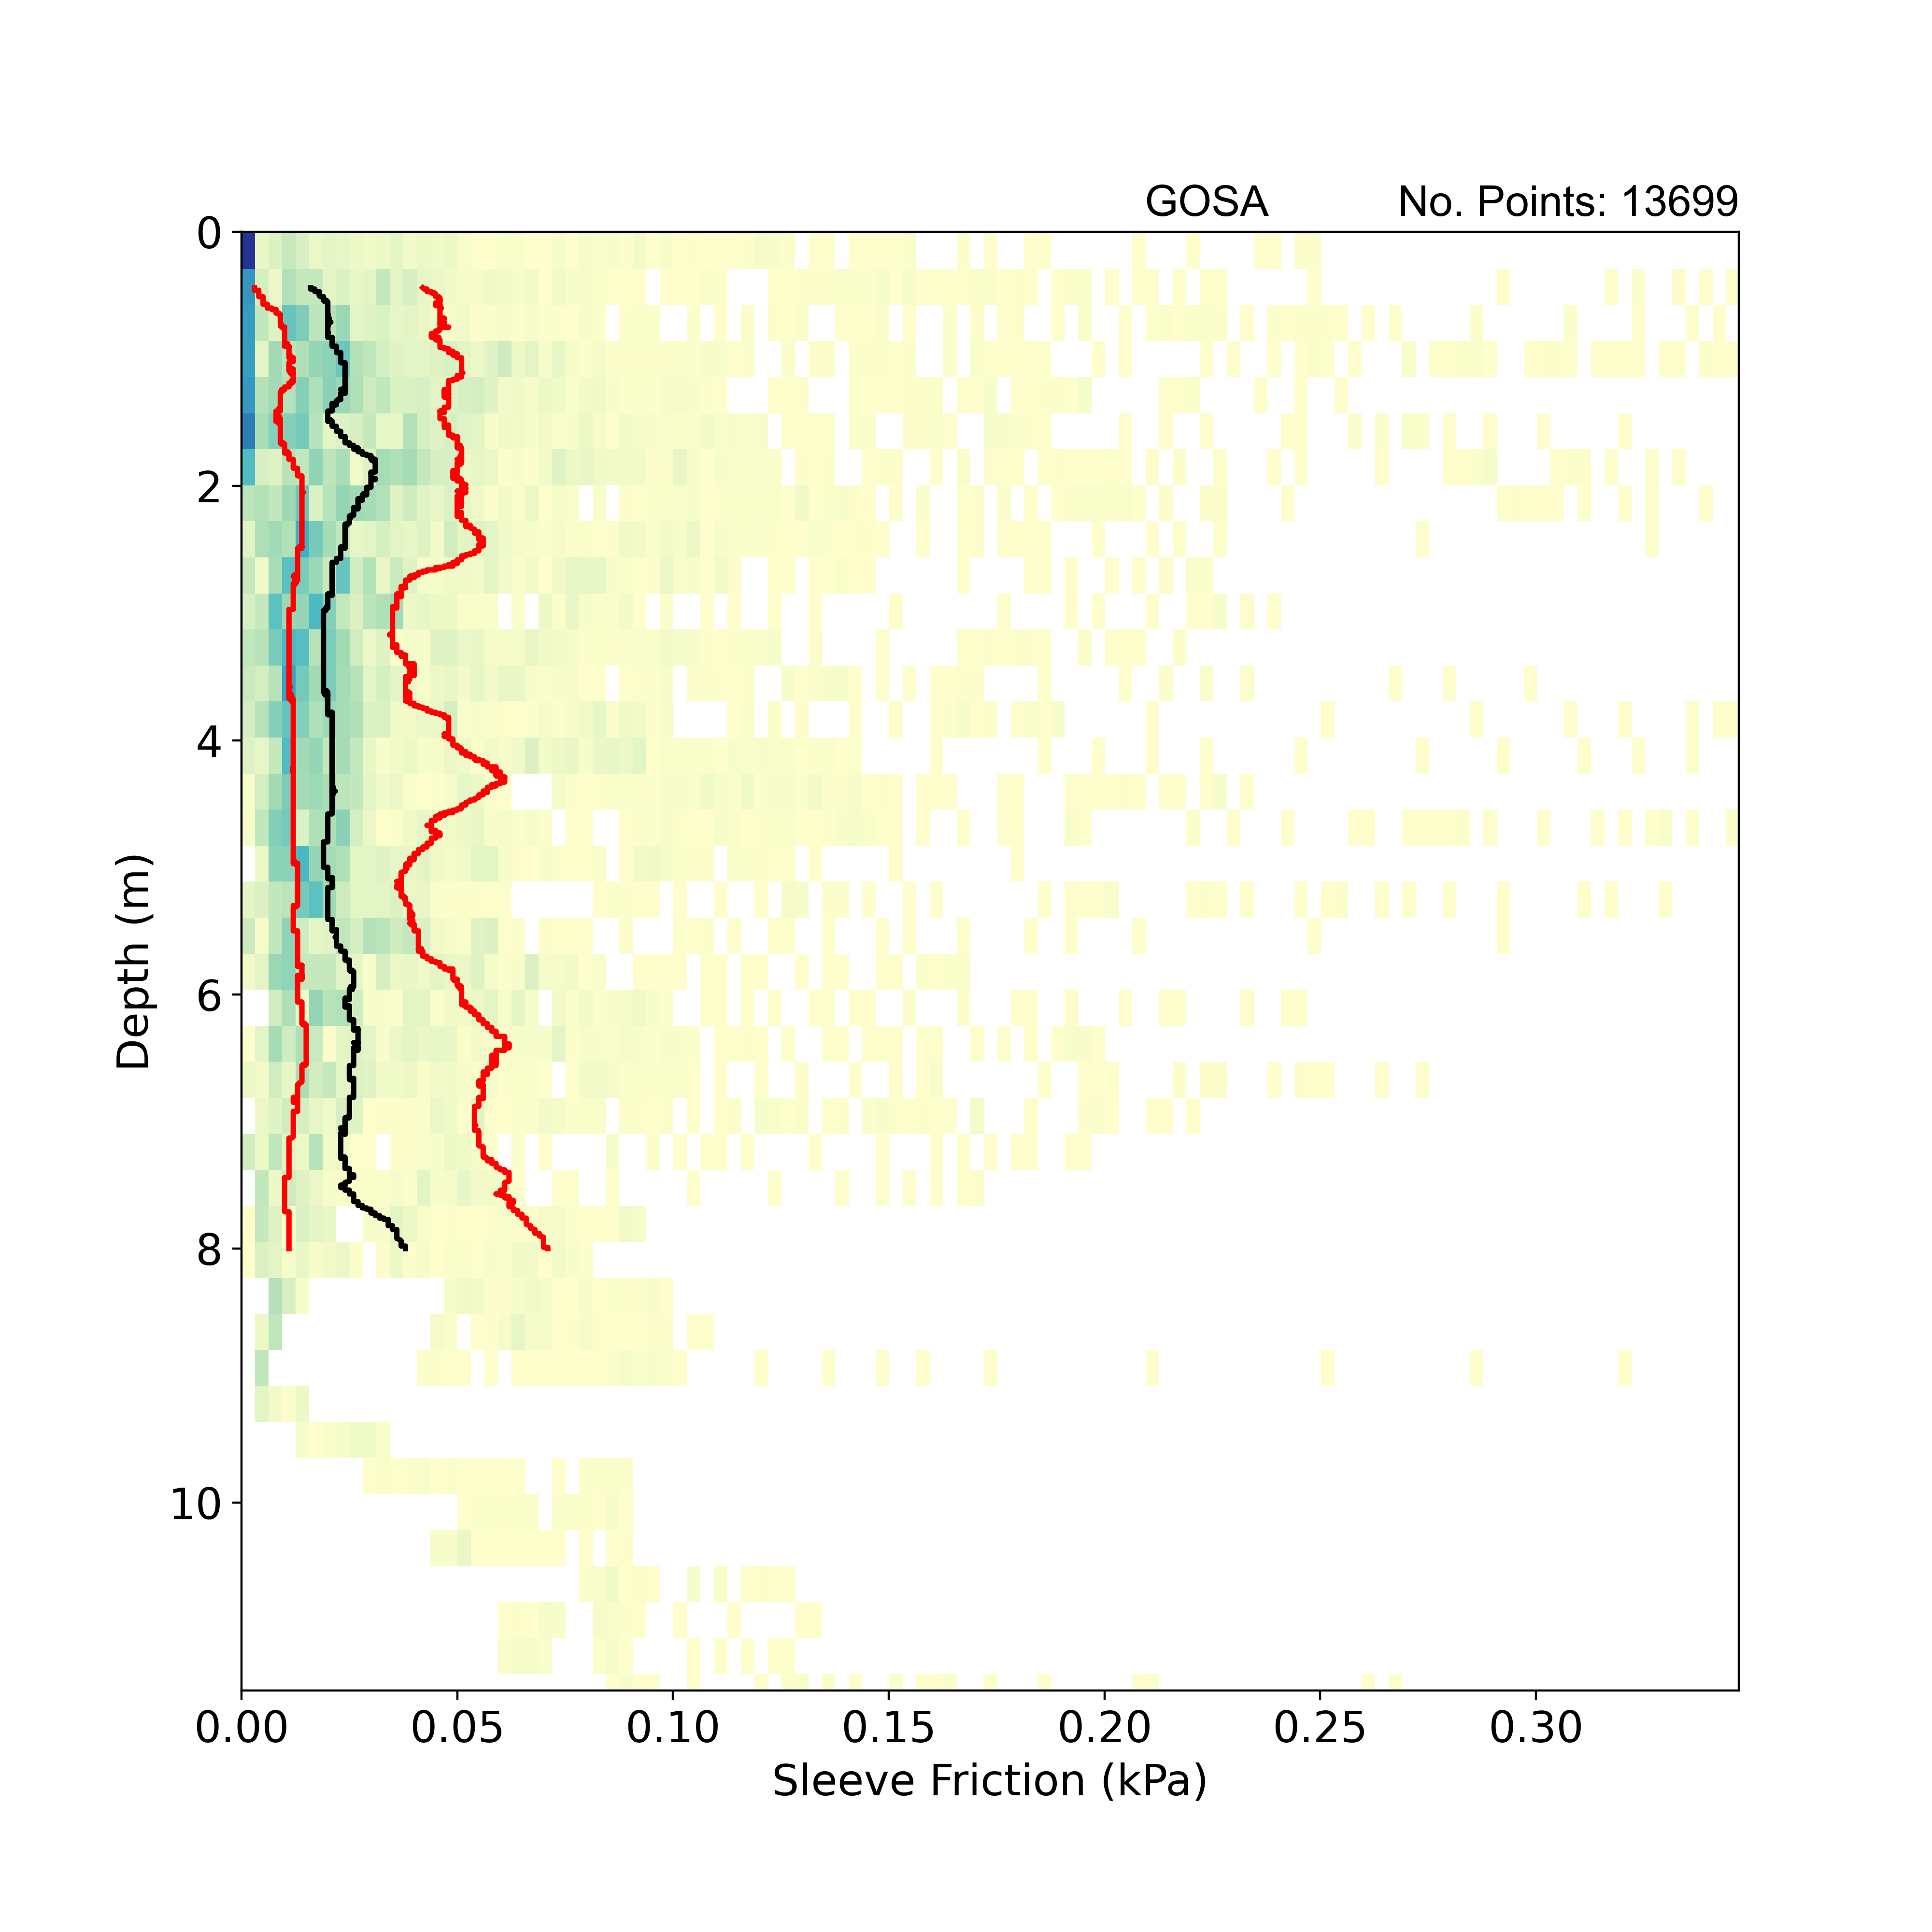
Geotechnical properties: strength tests
2D histogram summarising sleeve friction with depth obtained from static cone penetration tests. Black line: sleeve friction with depth trend using a rolling window median (window width = 10 per cent sample number); red lines: sleeve friction with depth trend using a rolling window of 25th and 75th percentile (window width = 10 per cent sample number). BGS © UKRI.
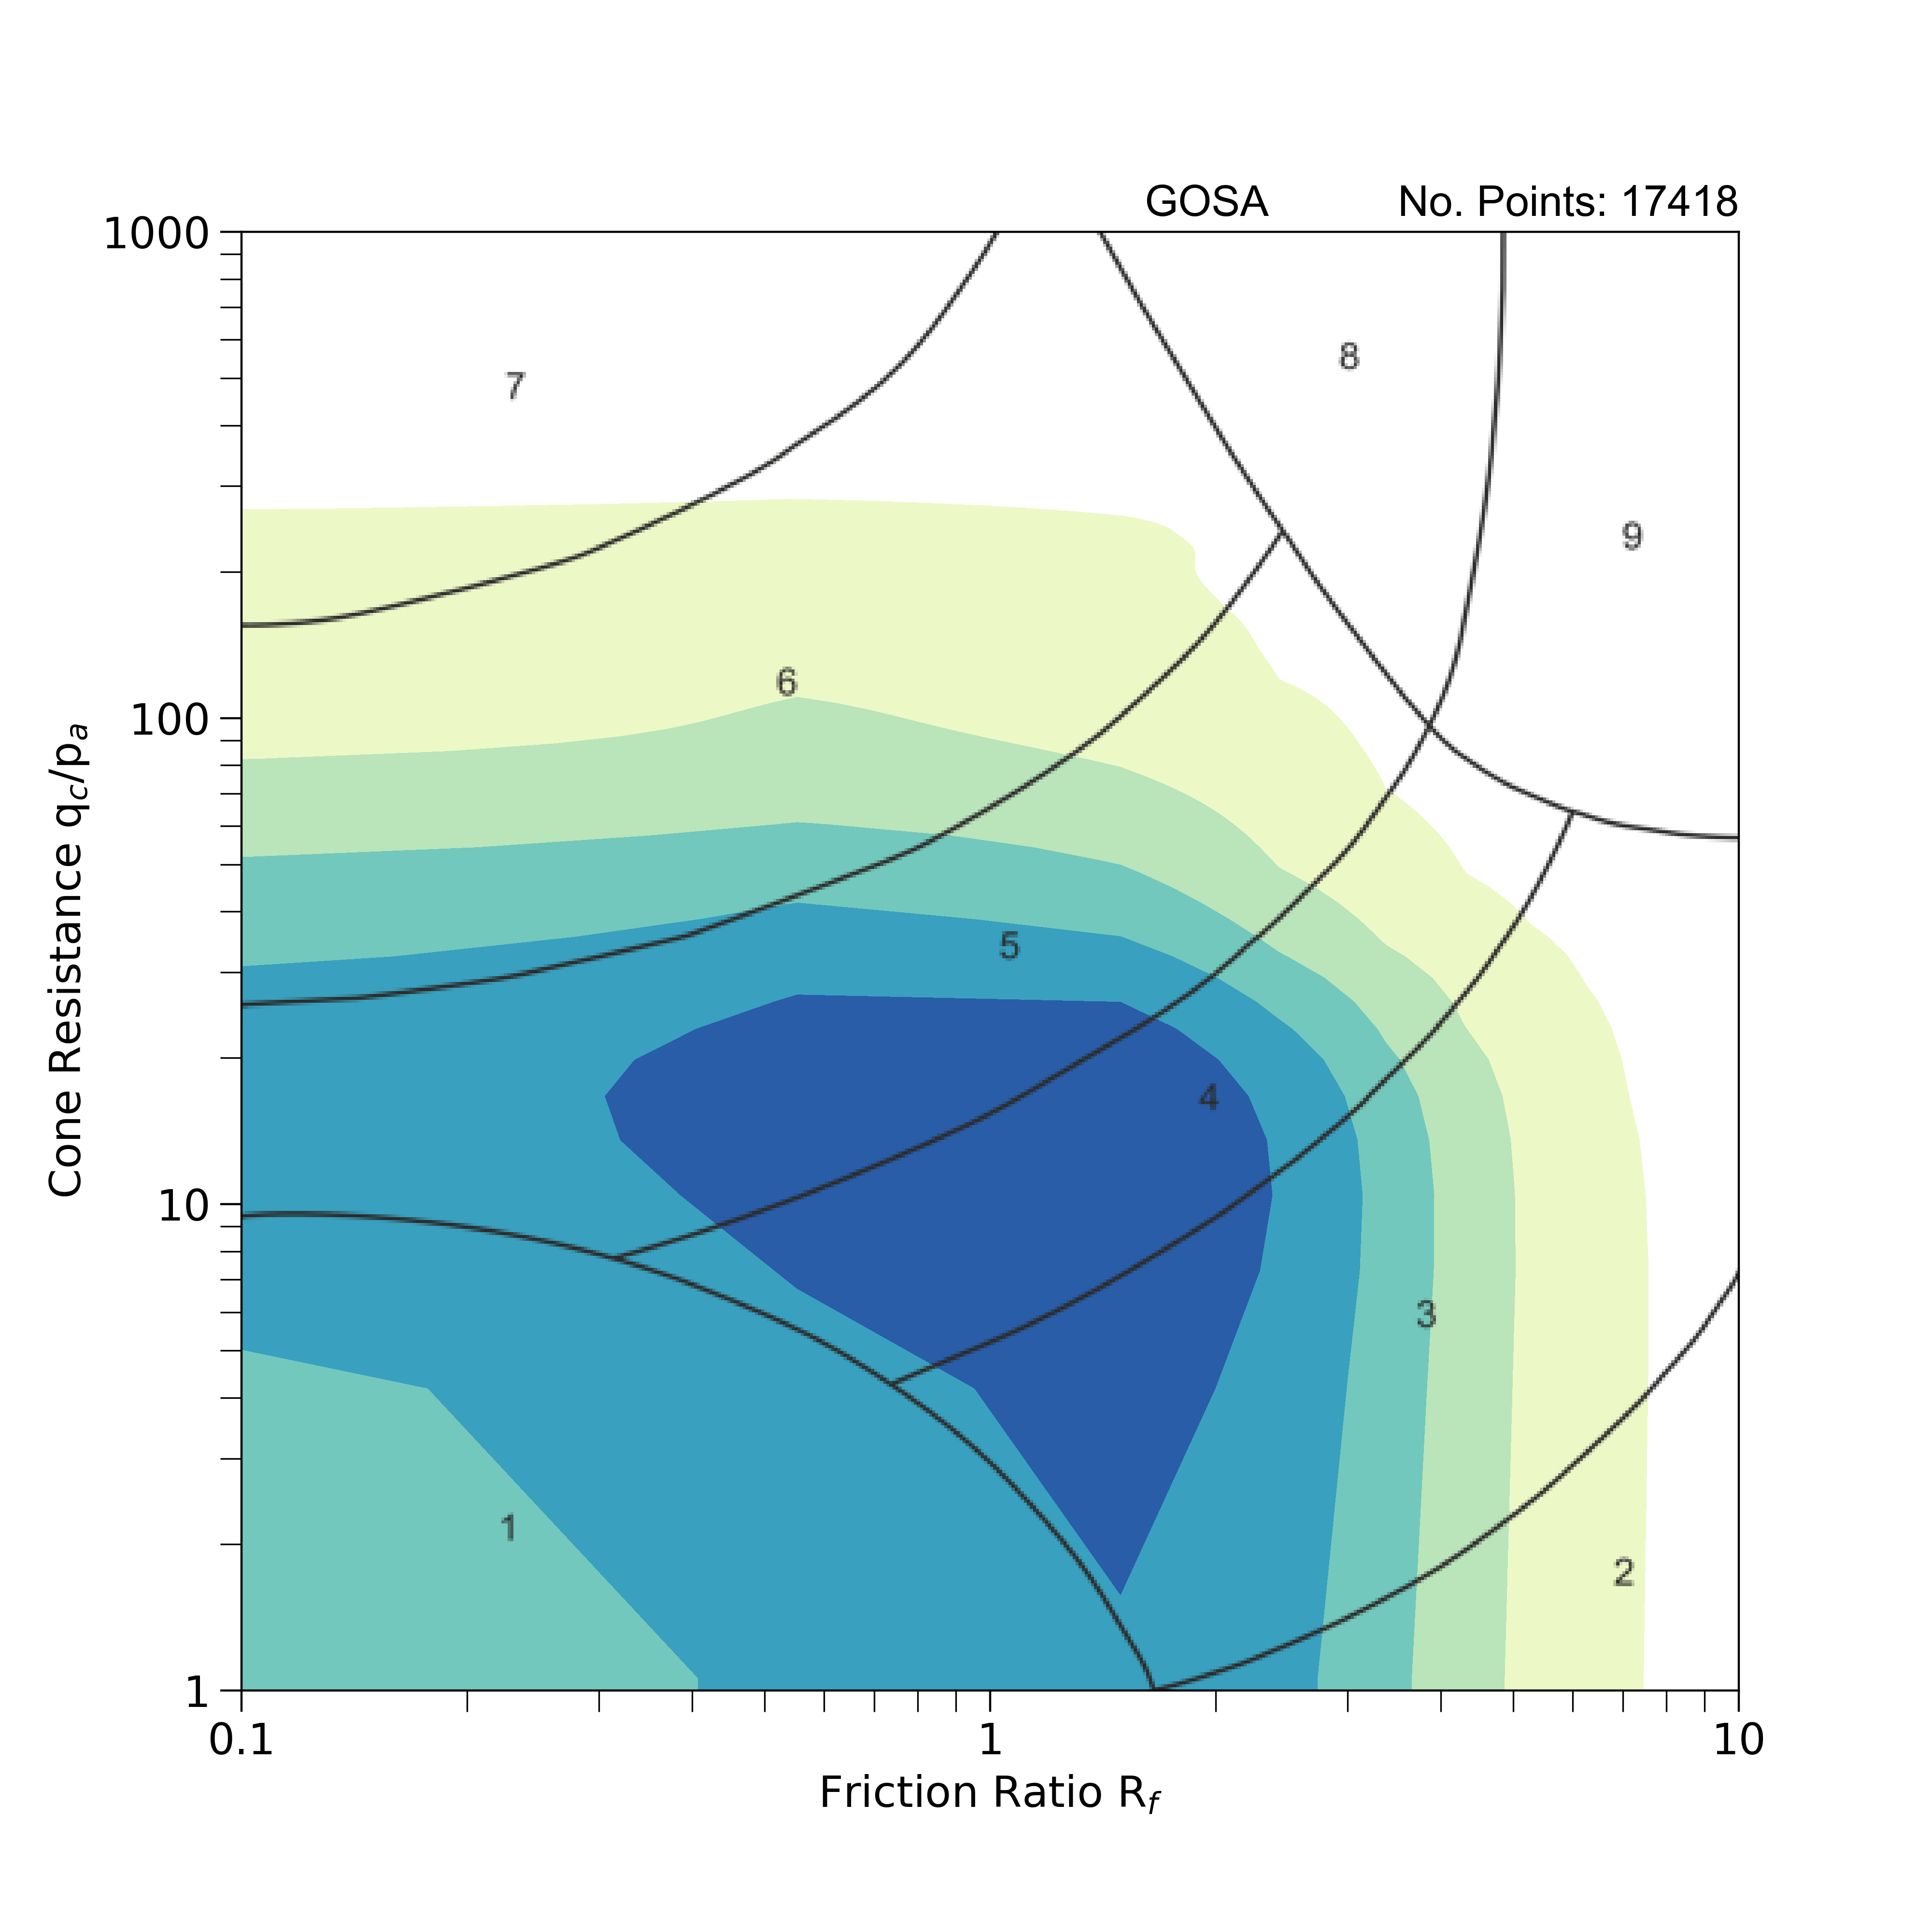
Geotechnical properties: strength tests
Non-normalised soil behaviour type chart after Robertson (2010) with 2D kernel density estimation of dimensionless cone resistance and friction ratio obtained from cone penetration tests. 1: sensitive fine-grained; 2: clay — organic soil; 3: clays — clay to silty clay; 4: silt mixtures — clayey silt and silty clay; 5: sand mixtures — silty sand to sandy silt; 6: sands — cleans sands to silty sands; 7: dense sand to gravelly sand; 8: stiff sand to clayey sand (overconsolidated or cemented); 9: stiff, fine-grained sand (overconsolidated or cemented). BGS © UKRI.
Killearn Sand And Gravel Member (KARN)
Geological descriptions
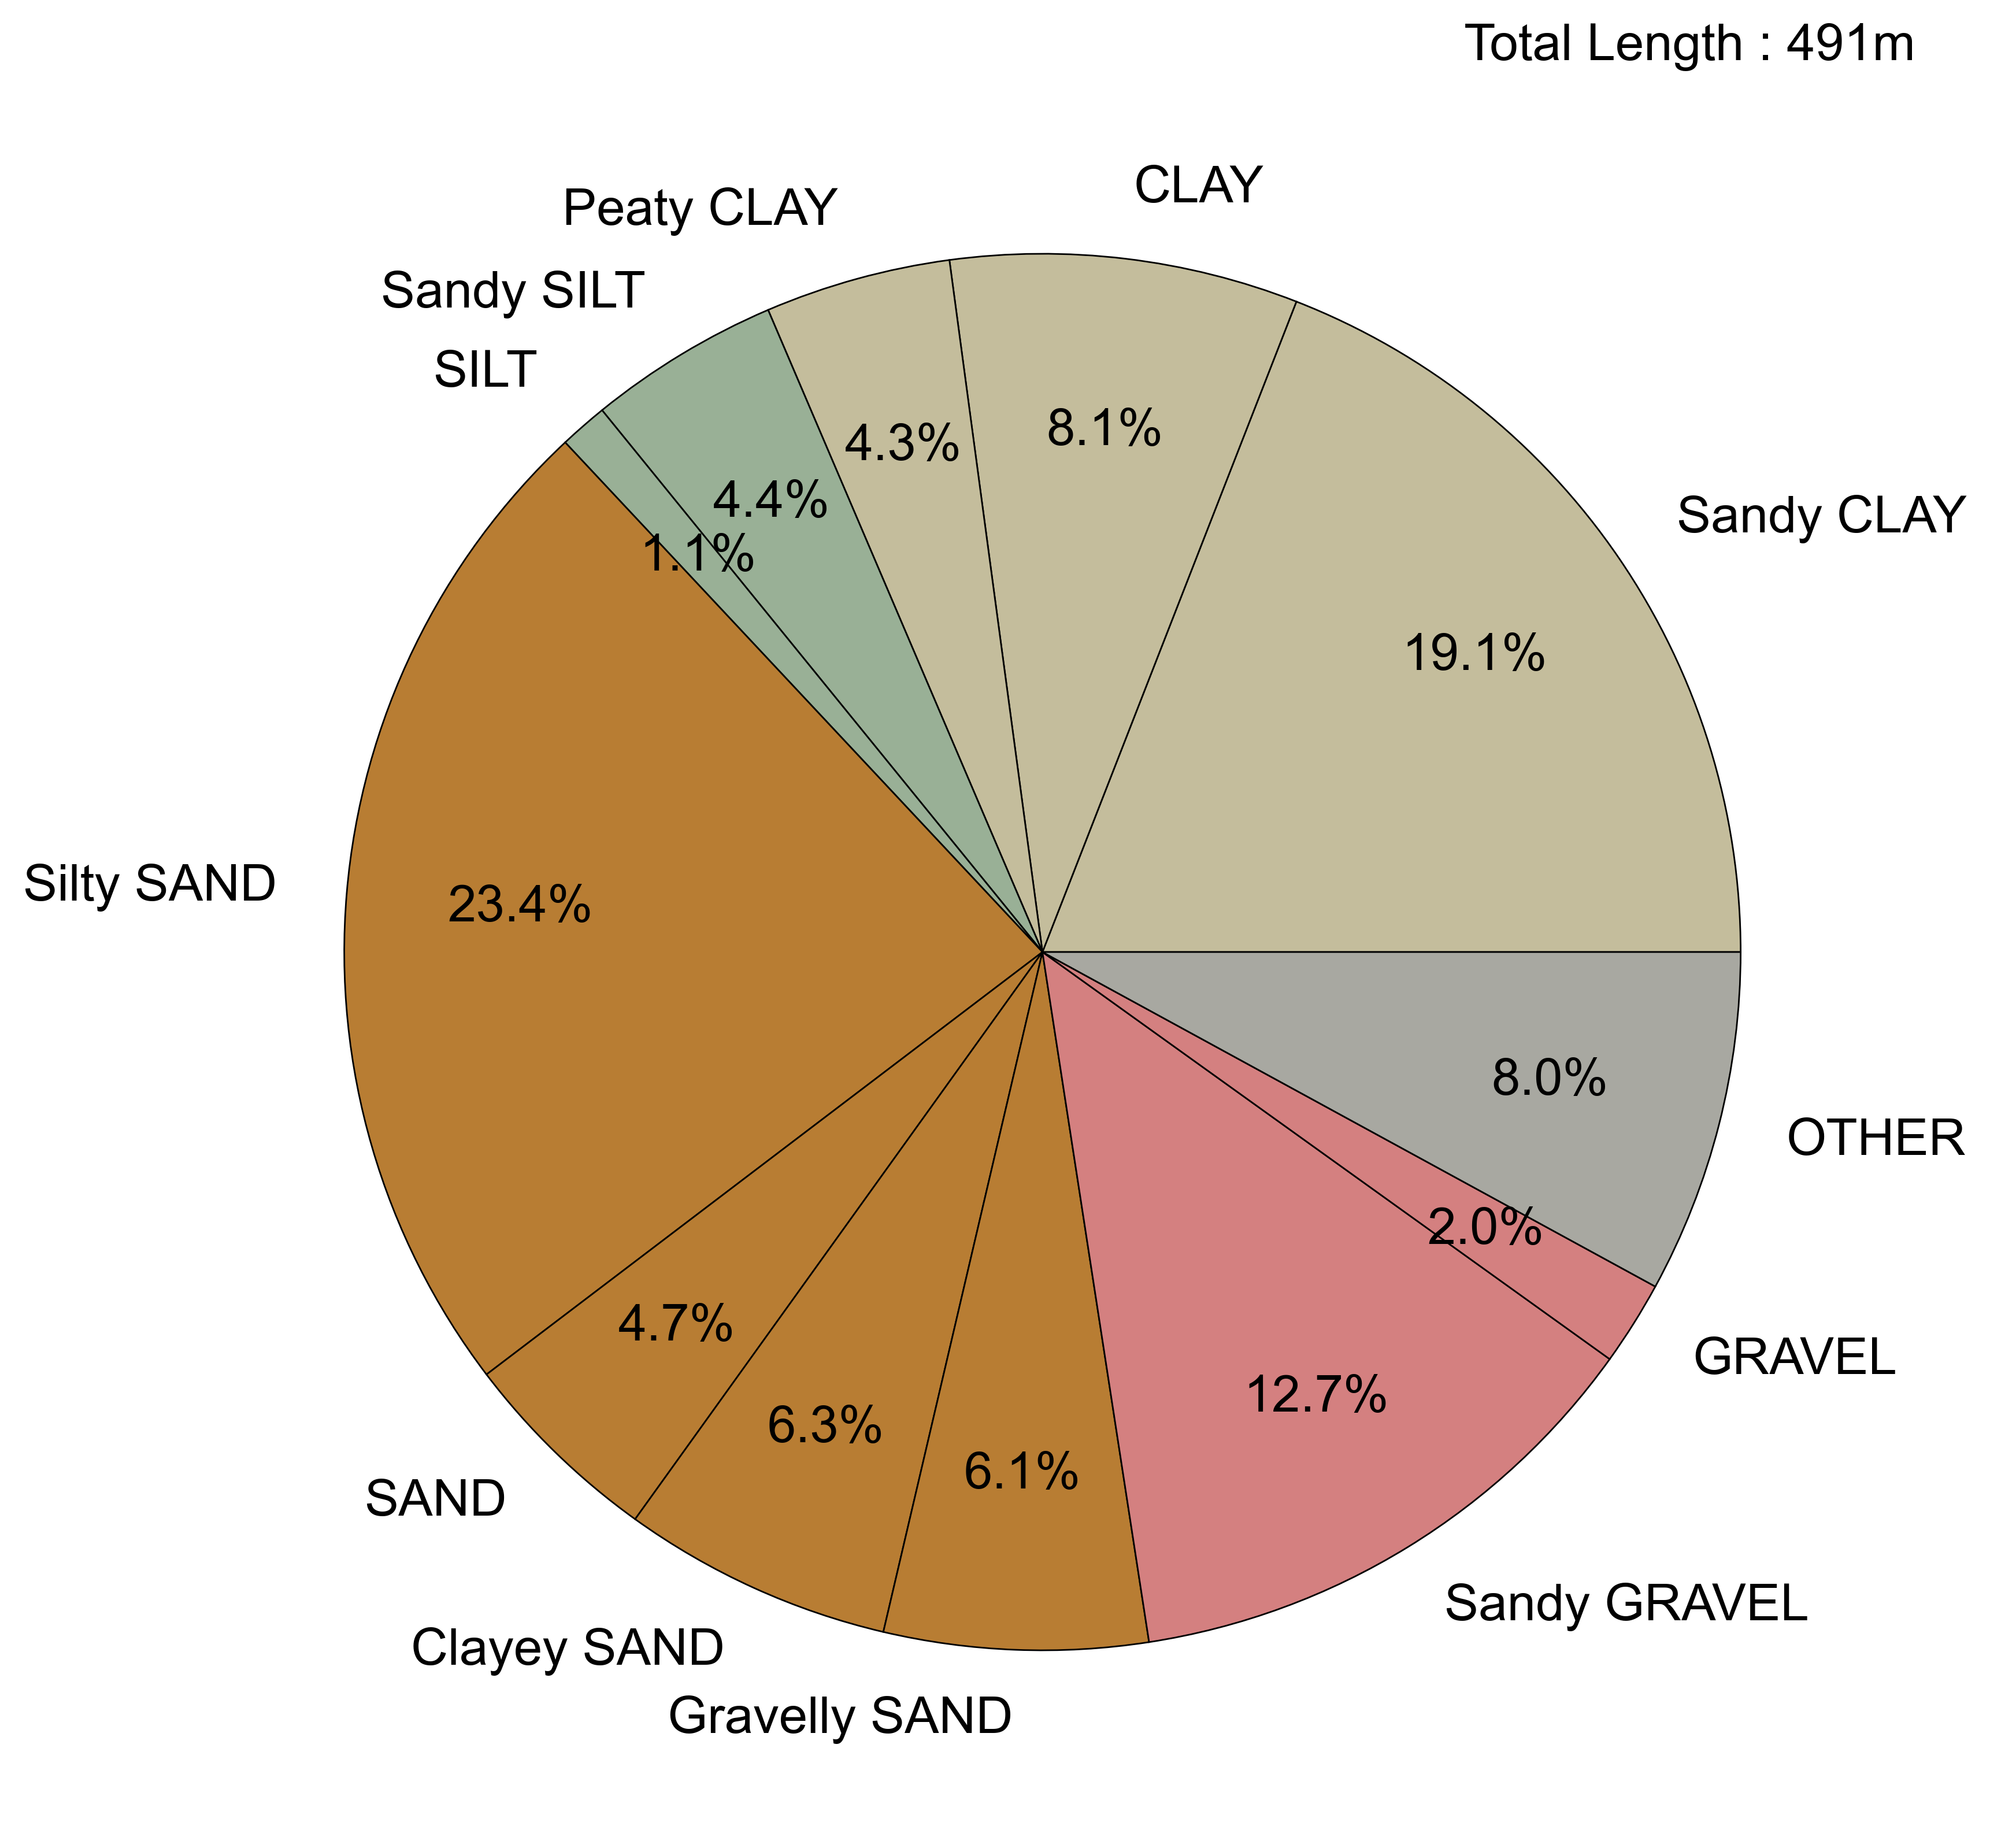
Pie chart summarising the dominant soil types (primary and secondary constituents) described in exploratory hole logs based on total metres logged. Descriptions have been simplified to remove tertiary constituents and a threshold of 1 per cent applied to aid graphical presentation. Soil types representing less than 1 per cent of the total logged are included in the ‘other’ category. BGS © UKRI.
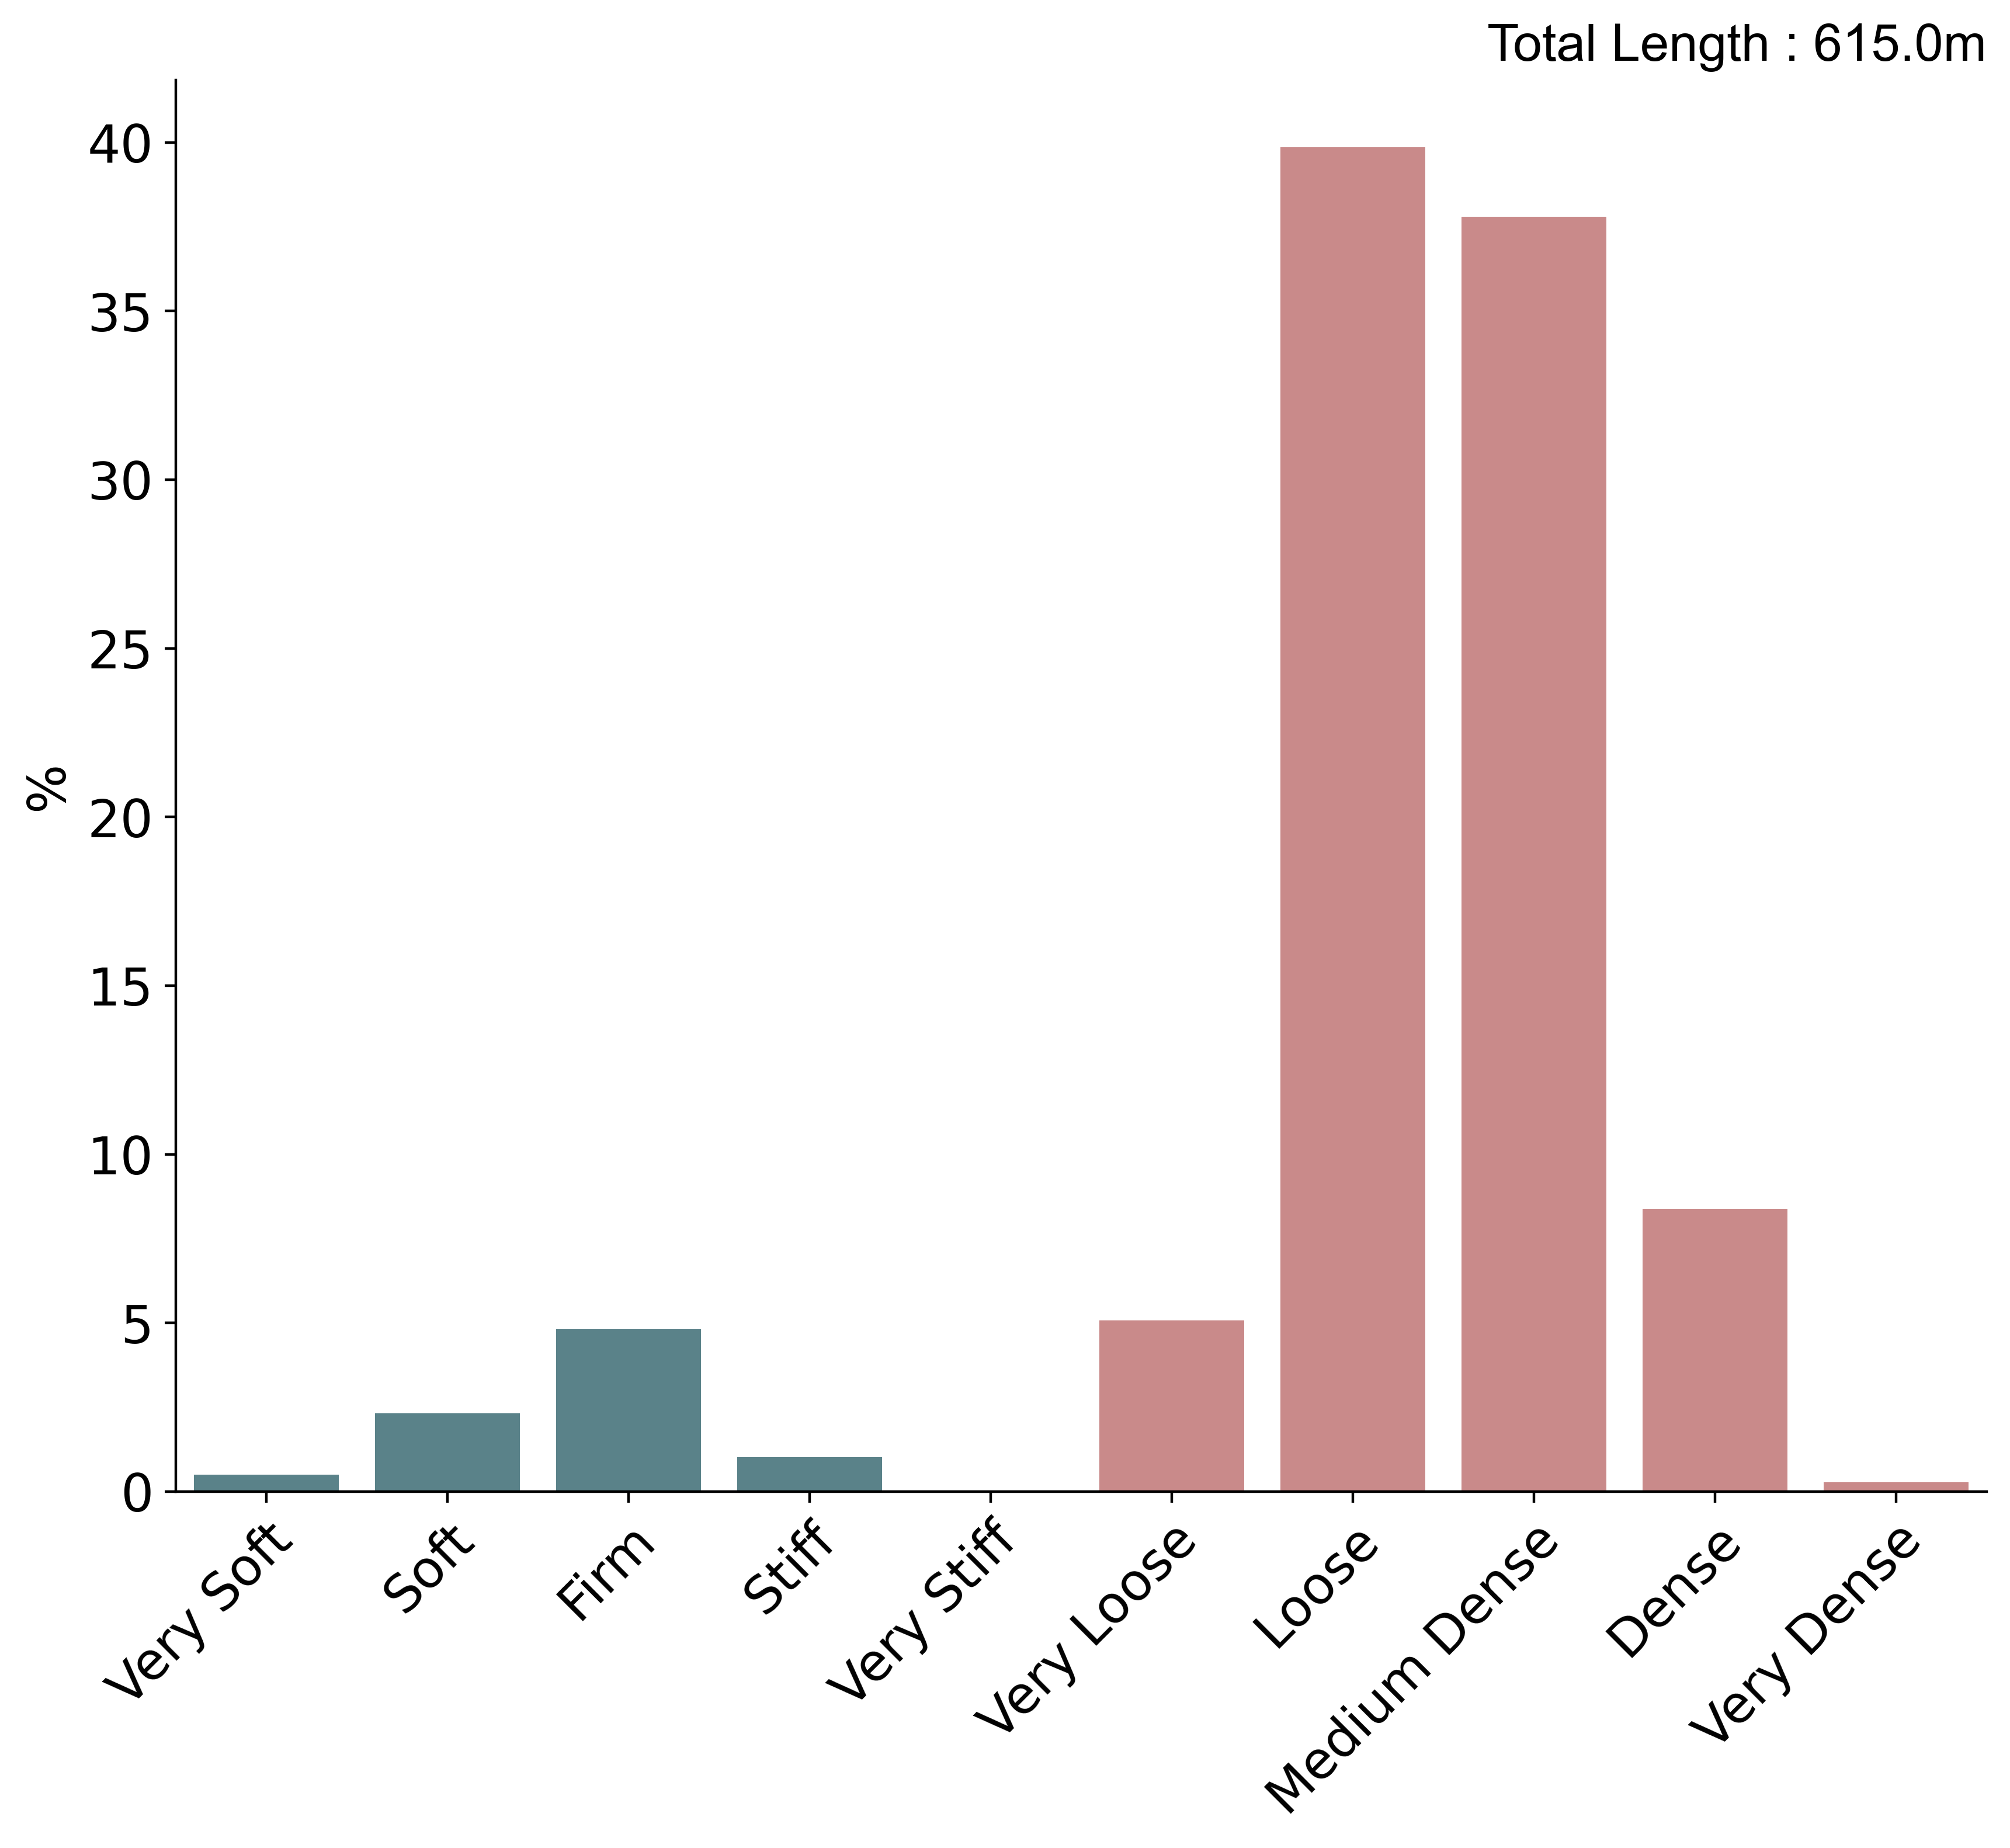
Geological descriptions
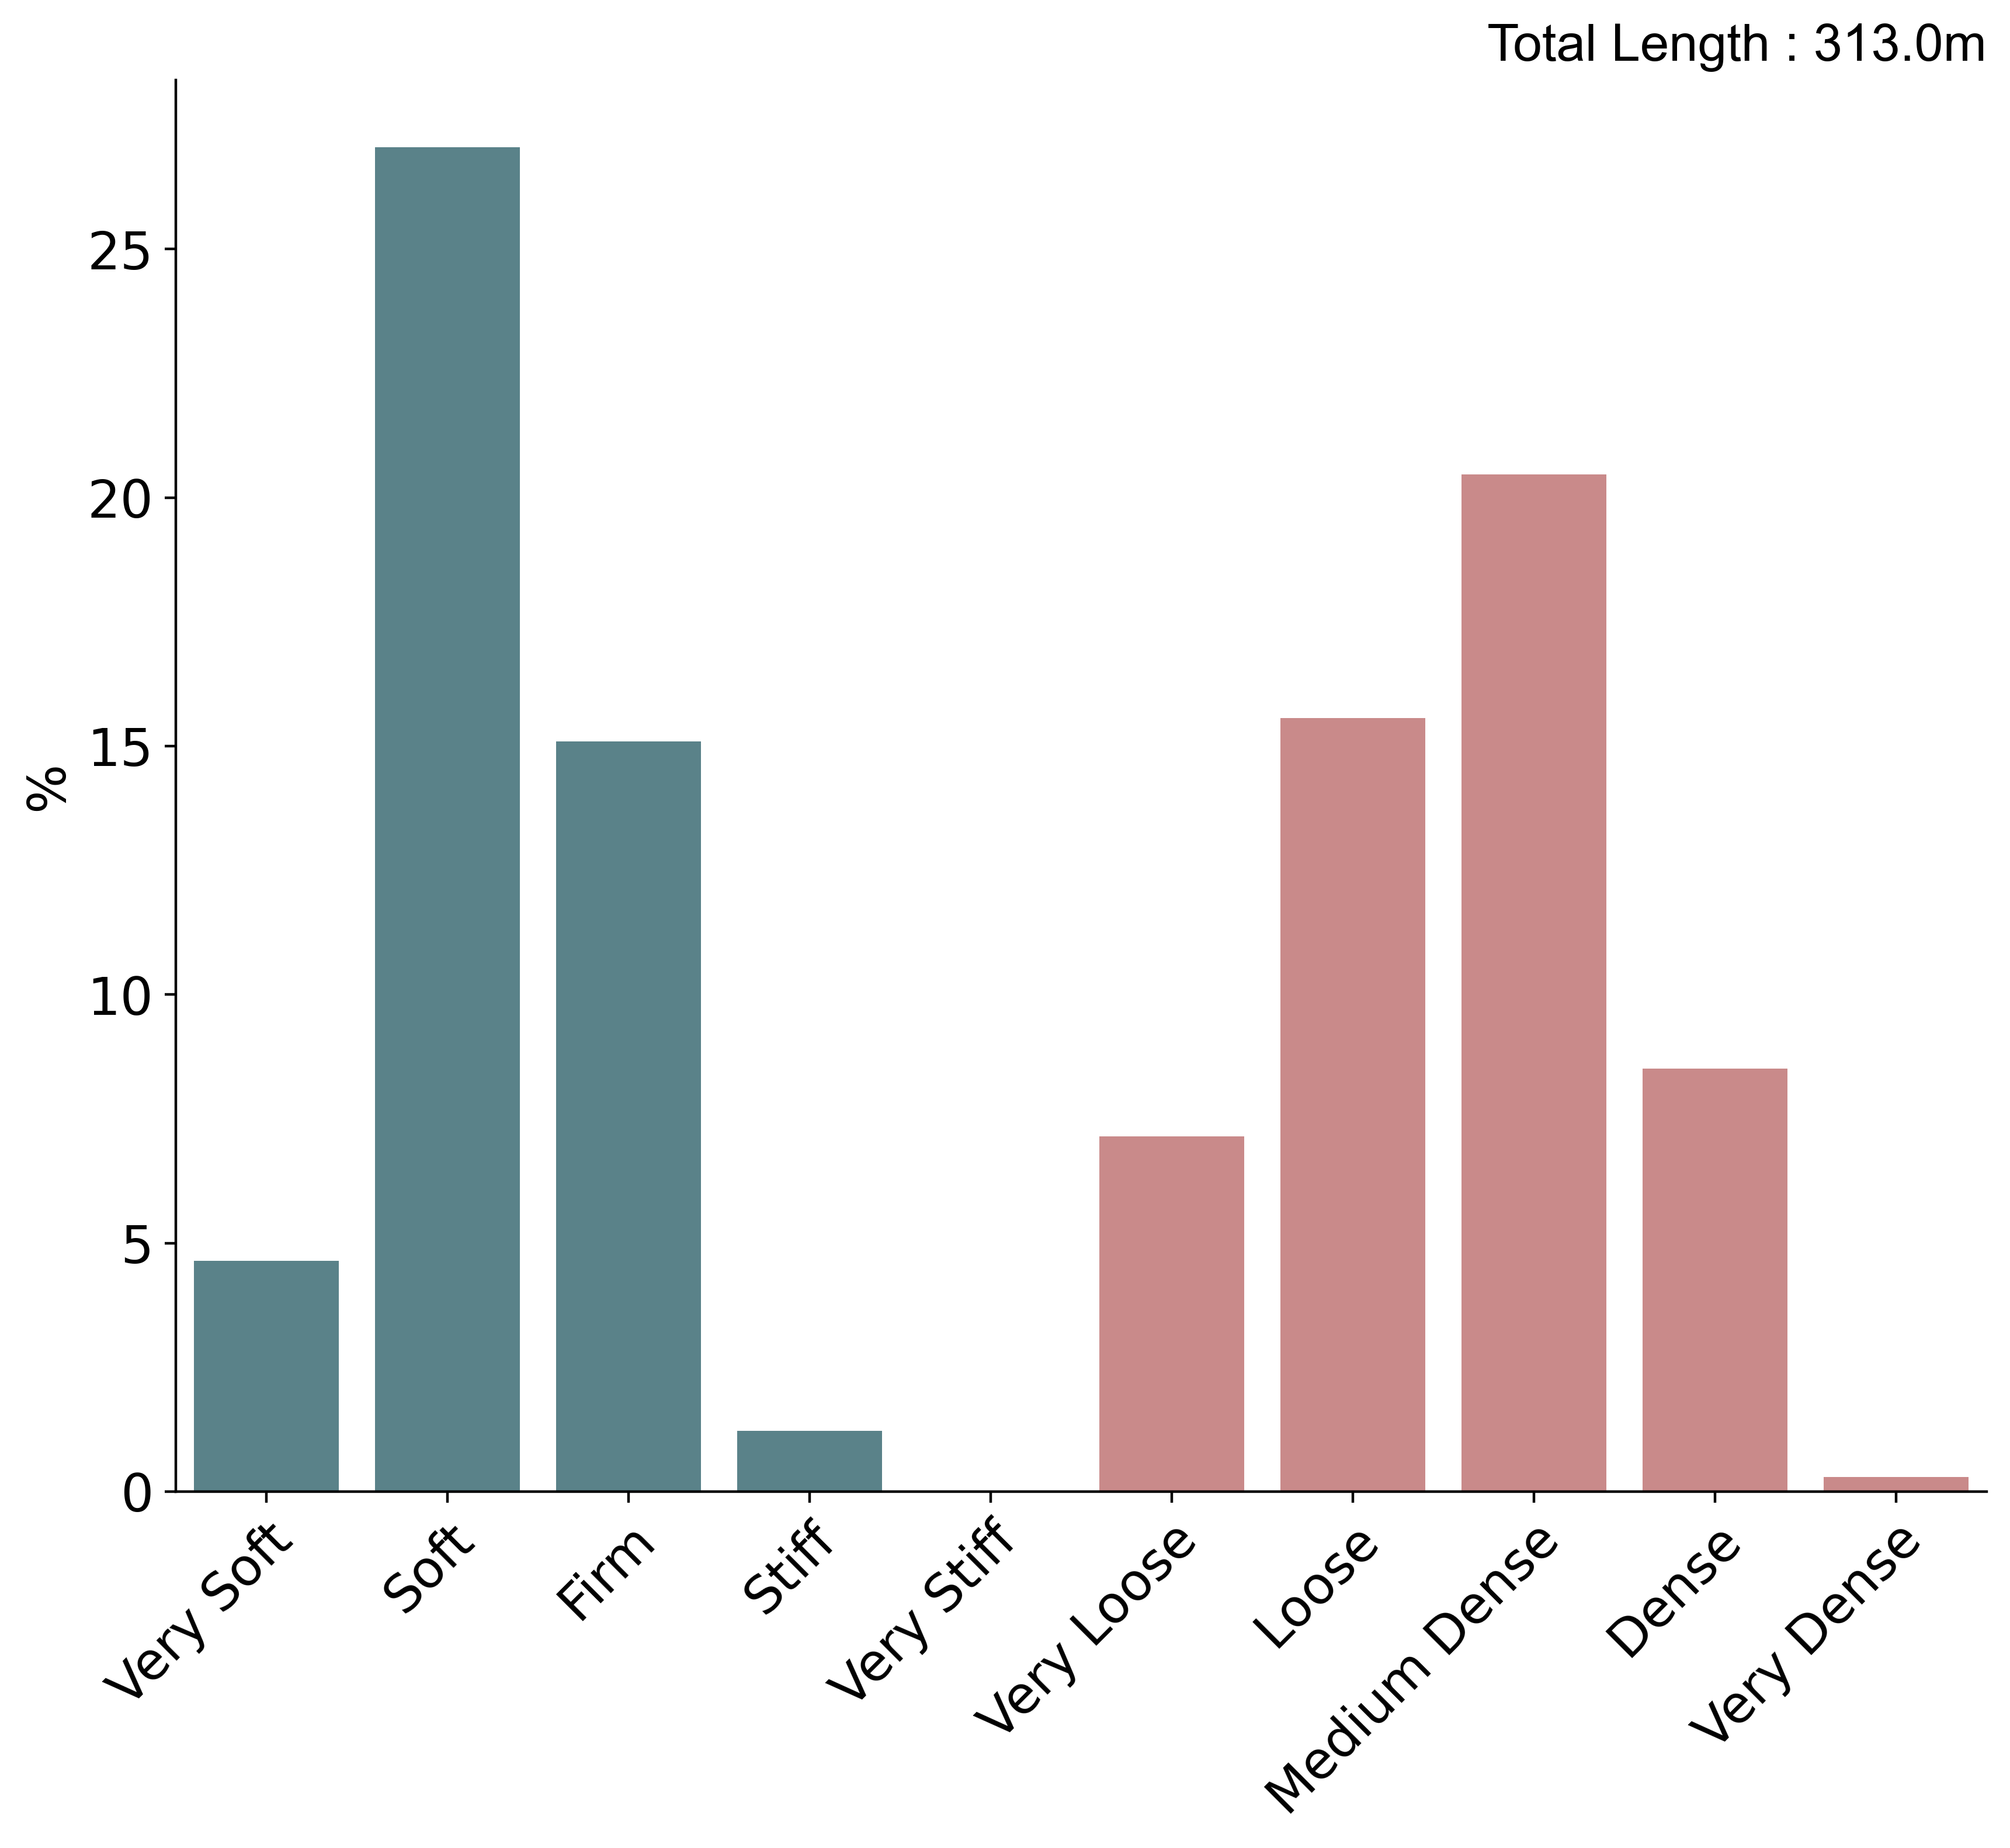
Histogram summarising the consistency and relative density described in exploratory hole logs based on total metres logged. BGS © UKRI.
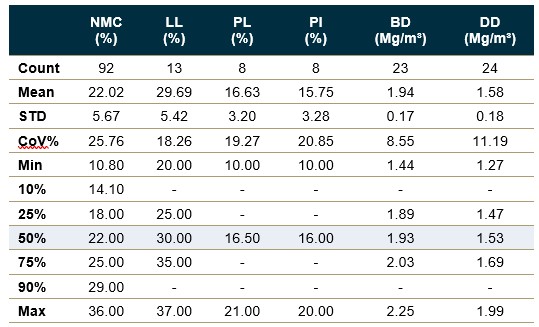
Geotechnical properties: classification tests
Statistical summaries of geotechnical index properties from laboratory tests. STD – standard deviation; CoV% – coefficient of variation; NMC – natural moisture content; LL – liquid limit geotechnical index properties. BGS © UKRI
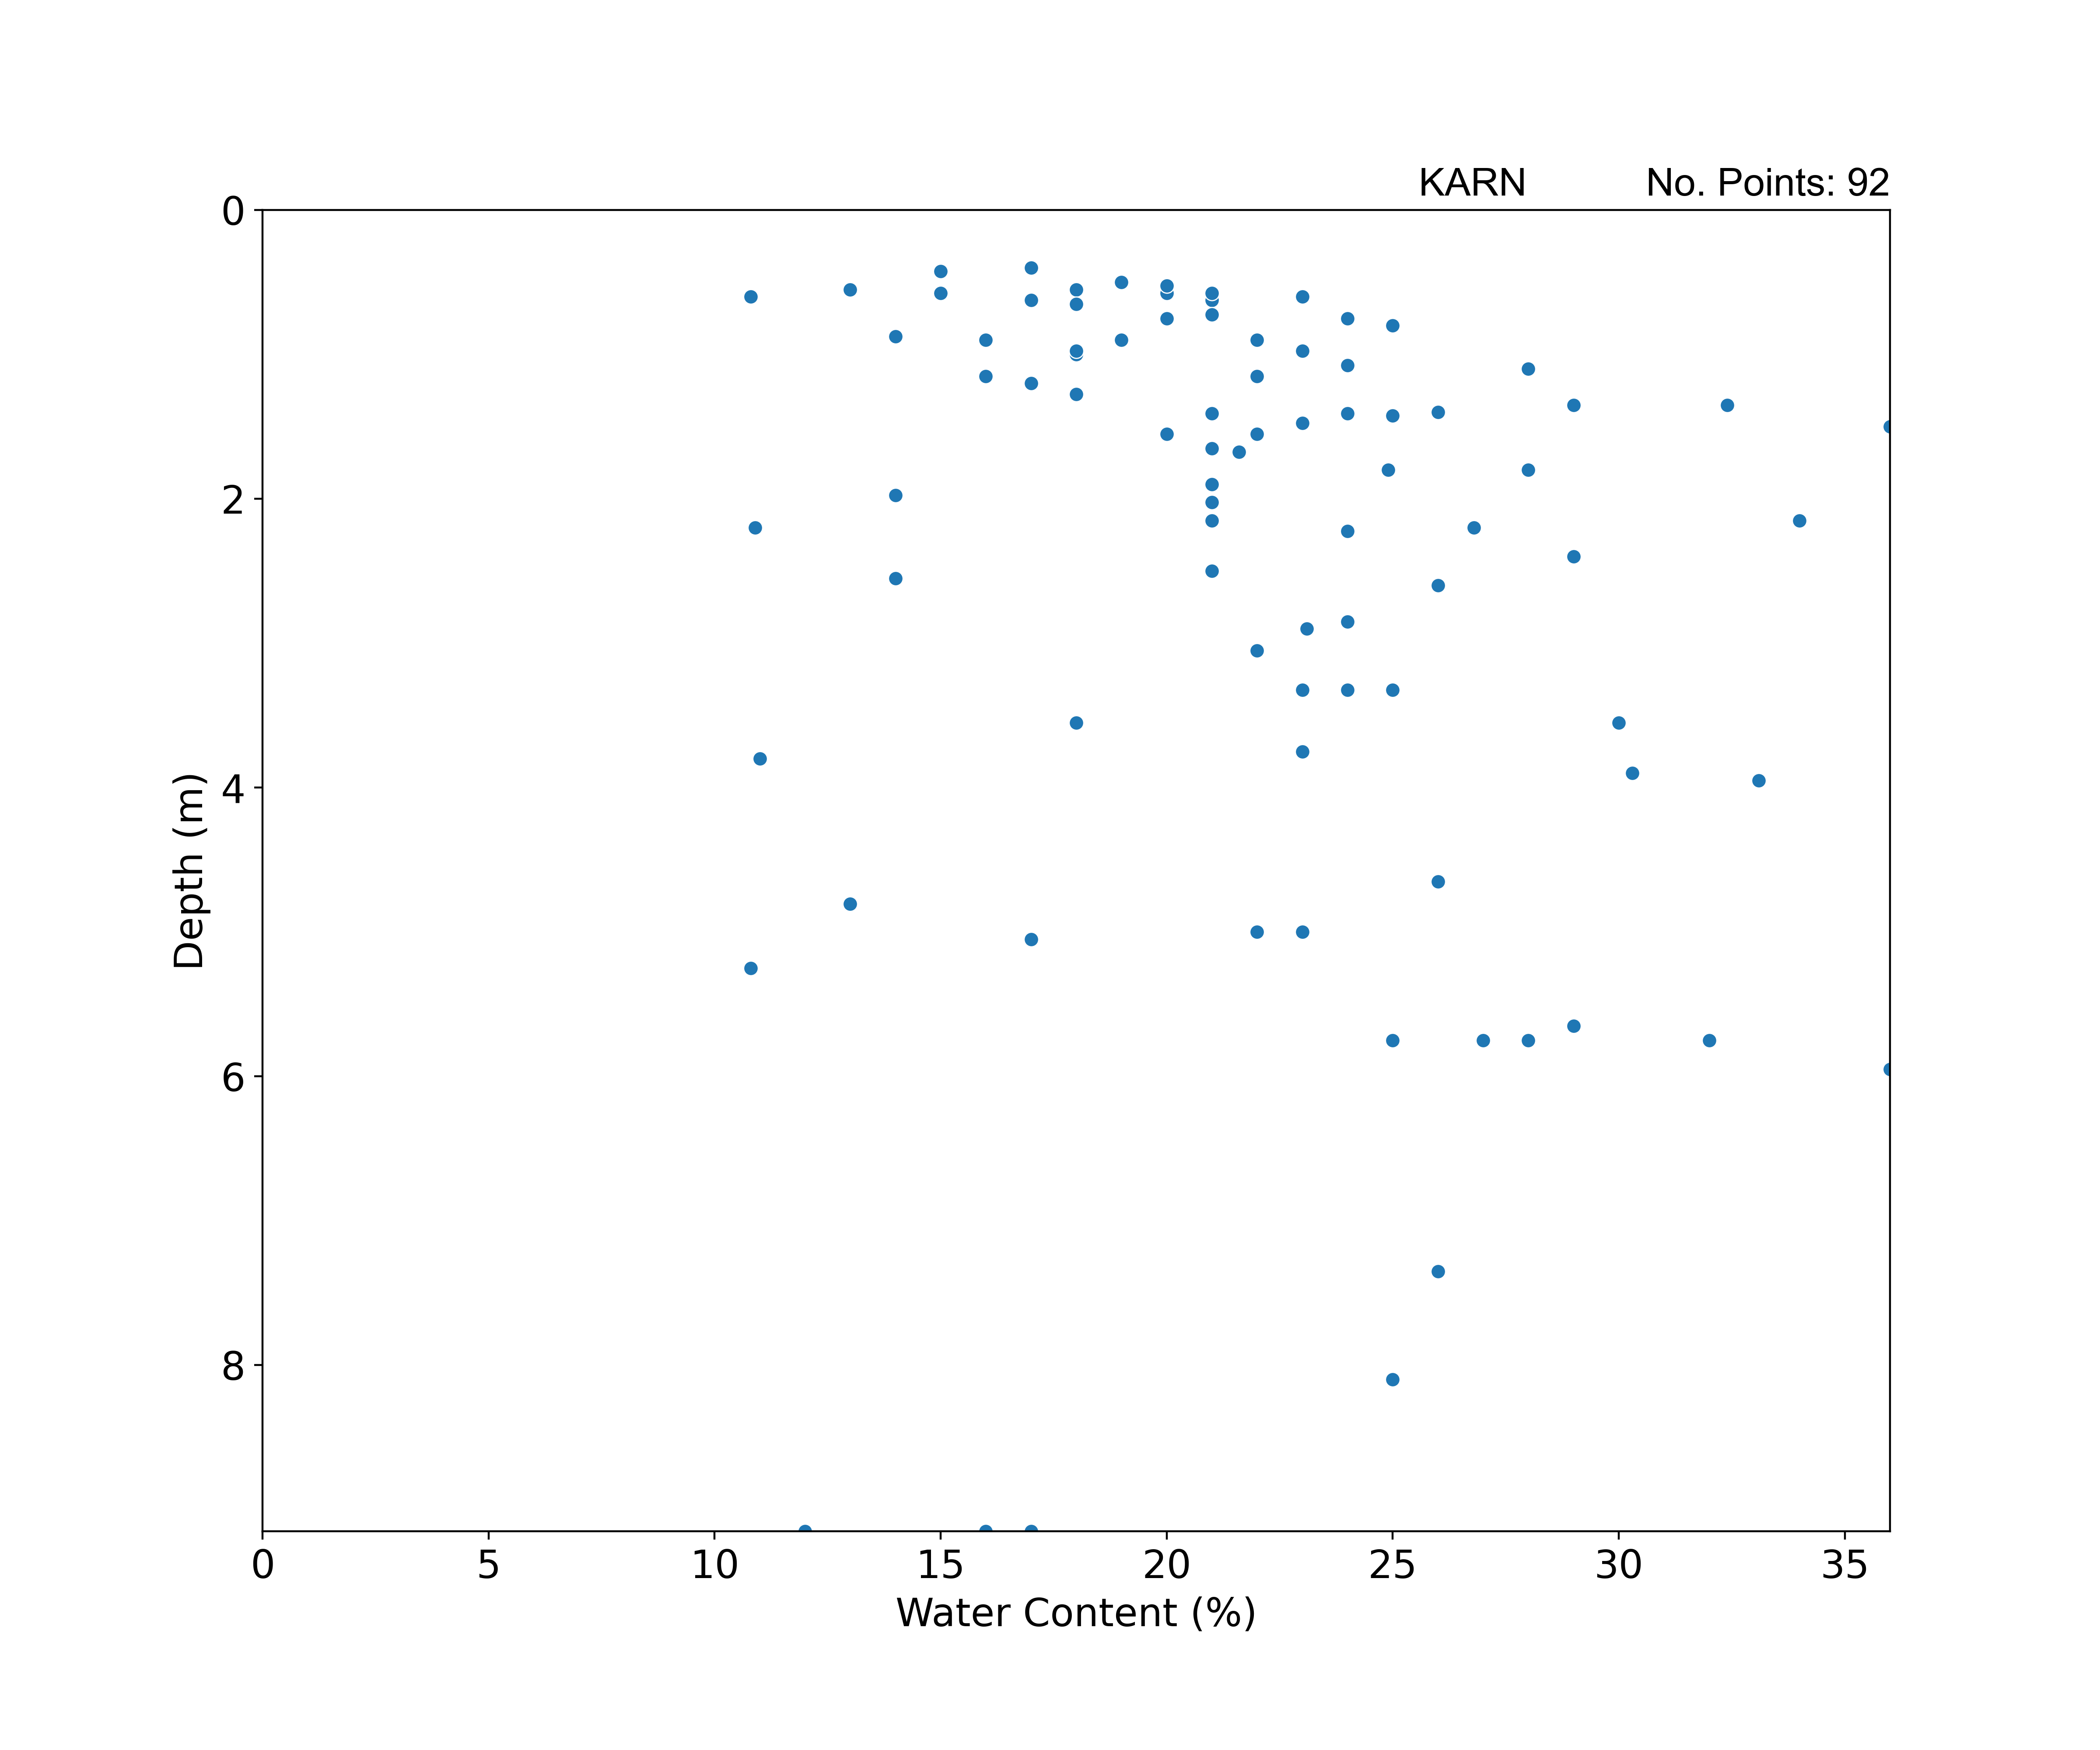
Geotechnical properties: classification tests
Scatterplot summarising water content with depth. BGS © UKRI.
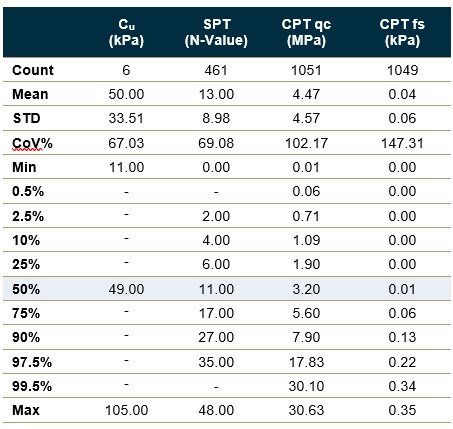
Geotechnical properties: strength tests
Statistical summaries of geotechnical strength properties from laboratory and in situ tests. STD – standard deviation; CoV% – coefficient of variation; Cu – undrained shear strength obtained from unconsolidated undrained triaxial tests; SPT – standard penetration test (number of tests with N-value > 50 or with no N-value = 11); CPT qc – cone penetration test resistance; CPT fs – cone penetration test friction (negative friction values removed for statistical analysis). Percentiles reported based on sample size; no summaries are provided where there are fewer than 5 samples.BGS © UKRI
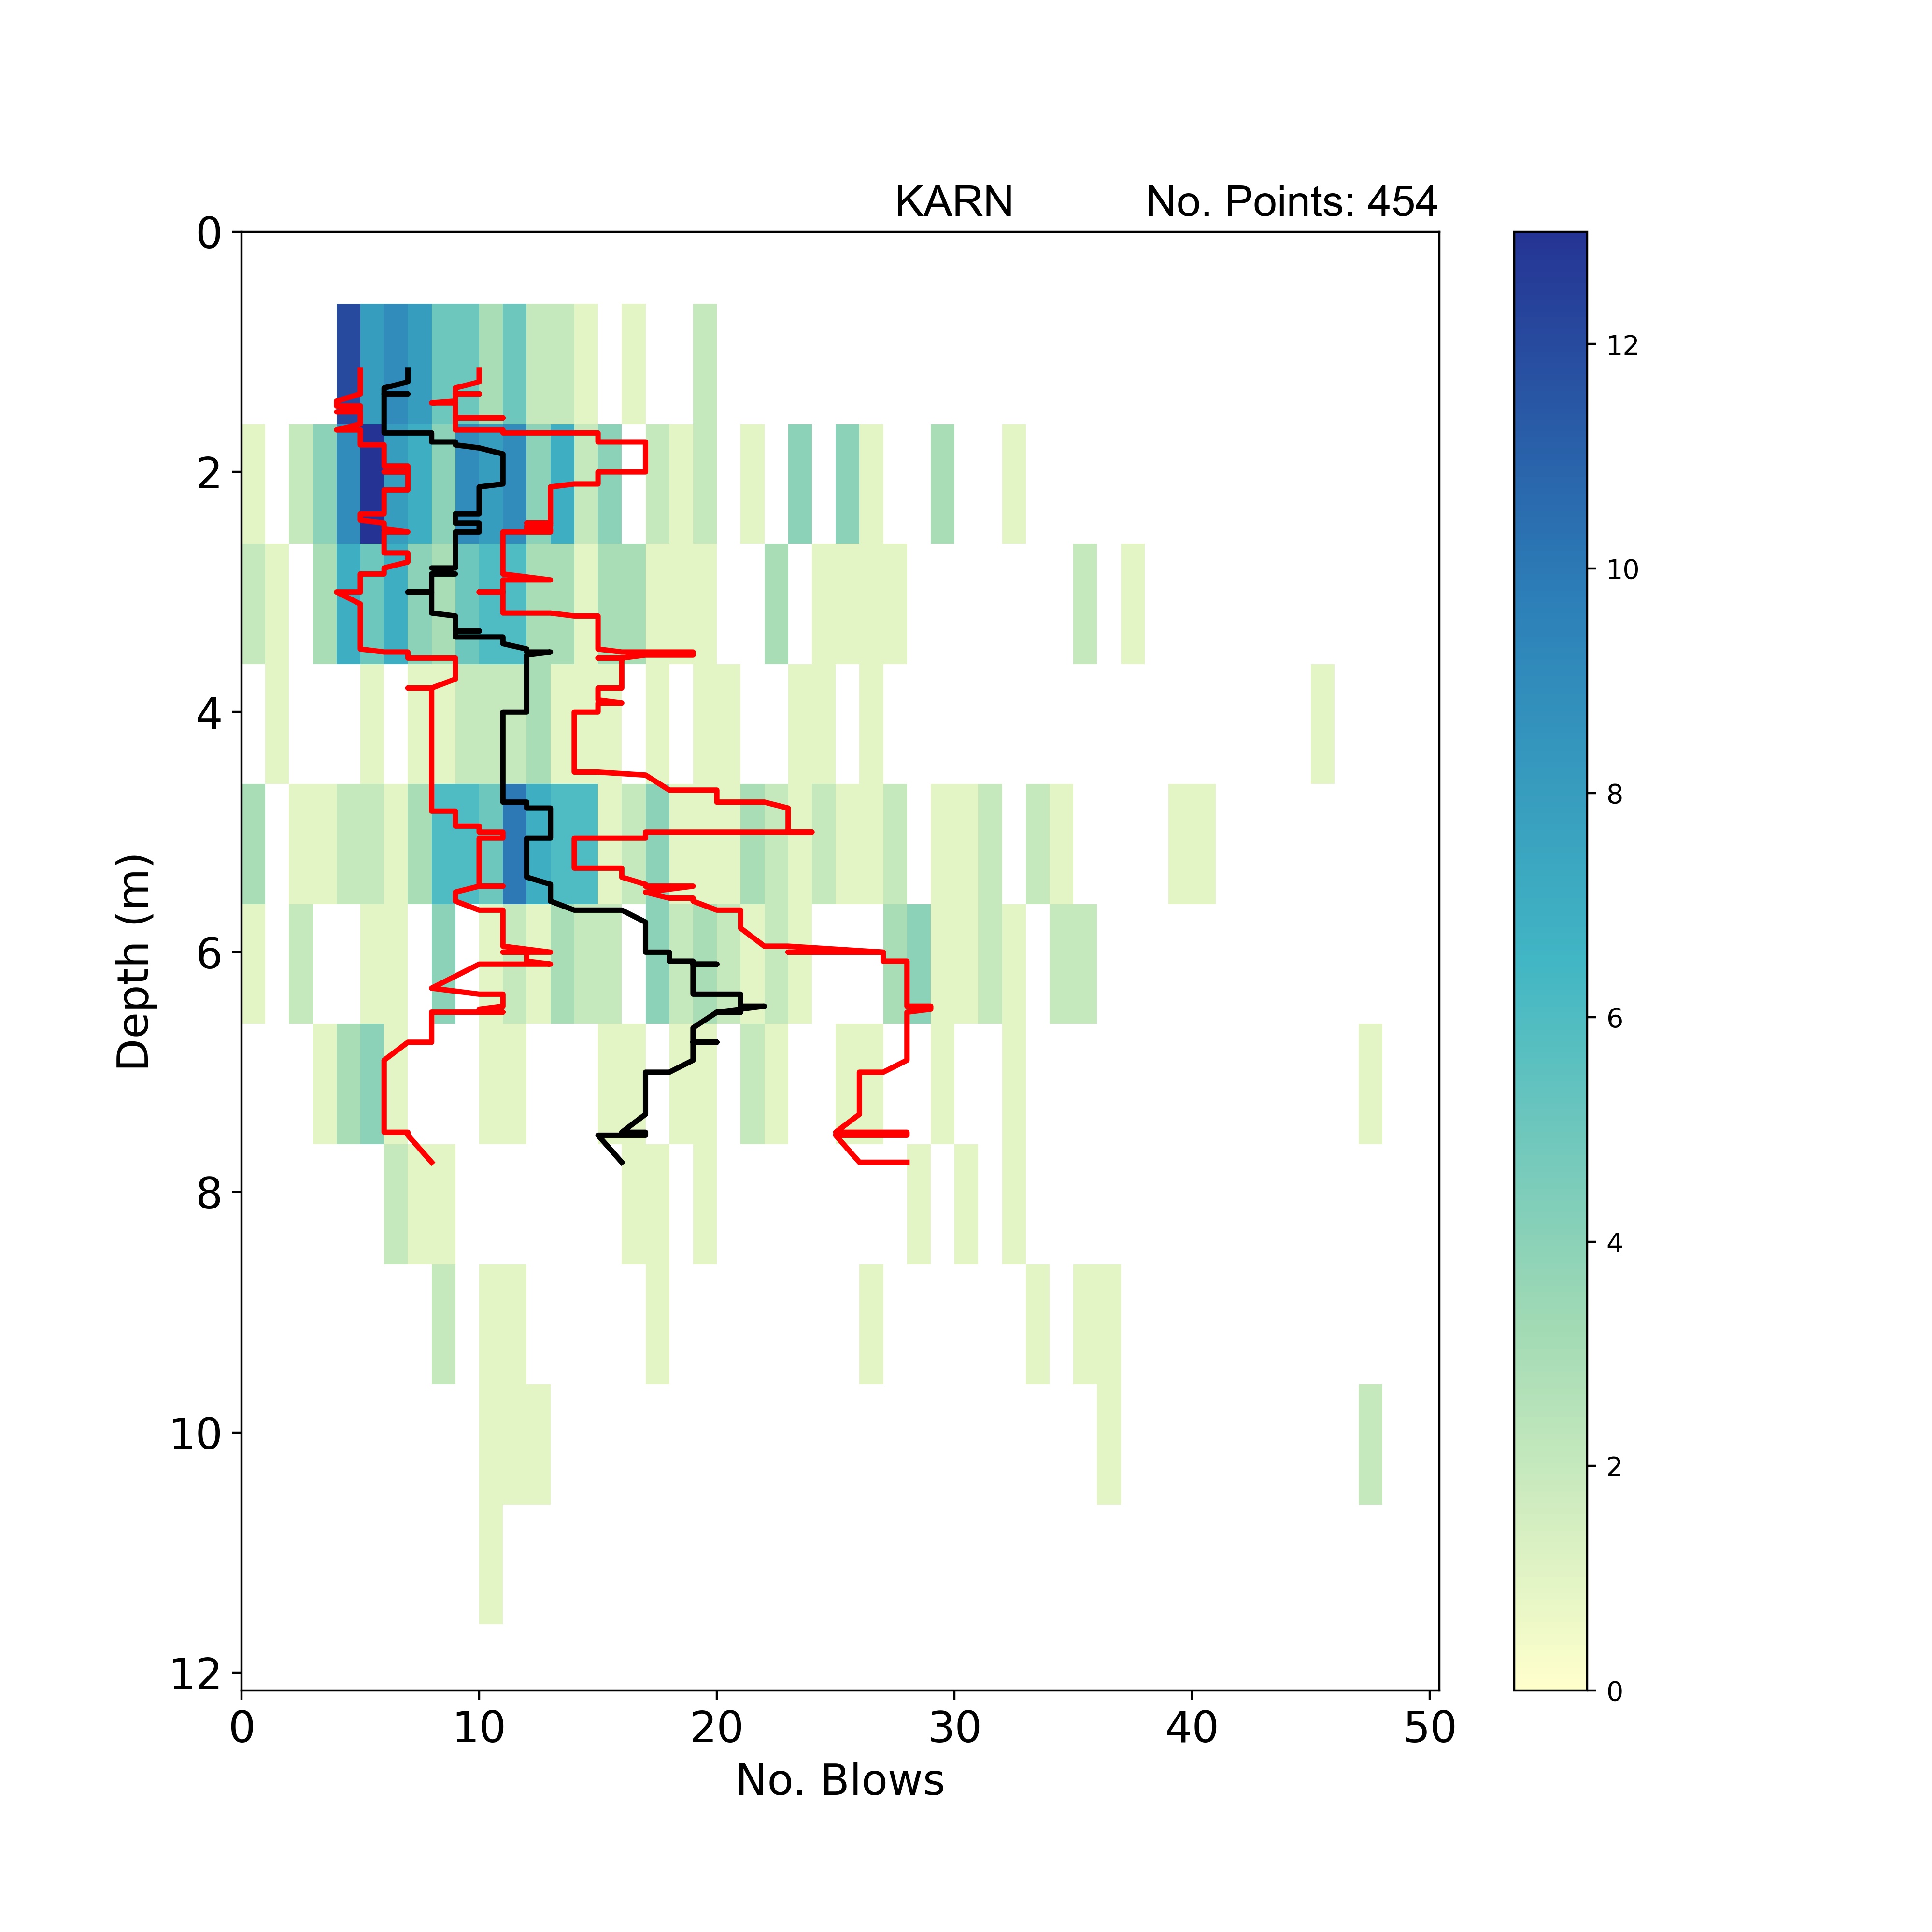
Geotechnical properties: strength tests
2D histogram summarising SPT N-value results with depth. Black line: SPT N-value with depth trend using a rolling window median (window width = 10 per cent sample number); red lines: SPT N-value with depth trend using a rolling window of 25th and 75th percentile (window width = 10 per cent sample number. Number of tests with N-value > 50 or with no N-value = 11. BGS © UKRI
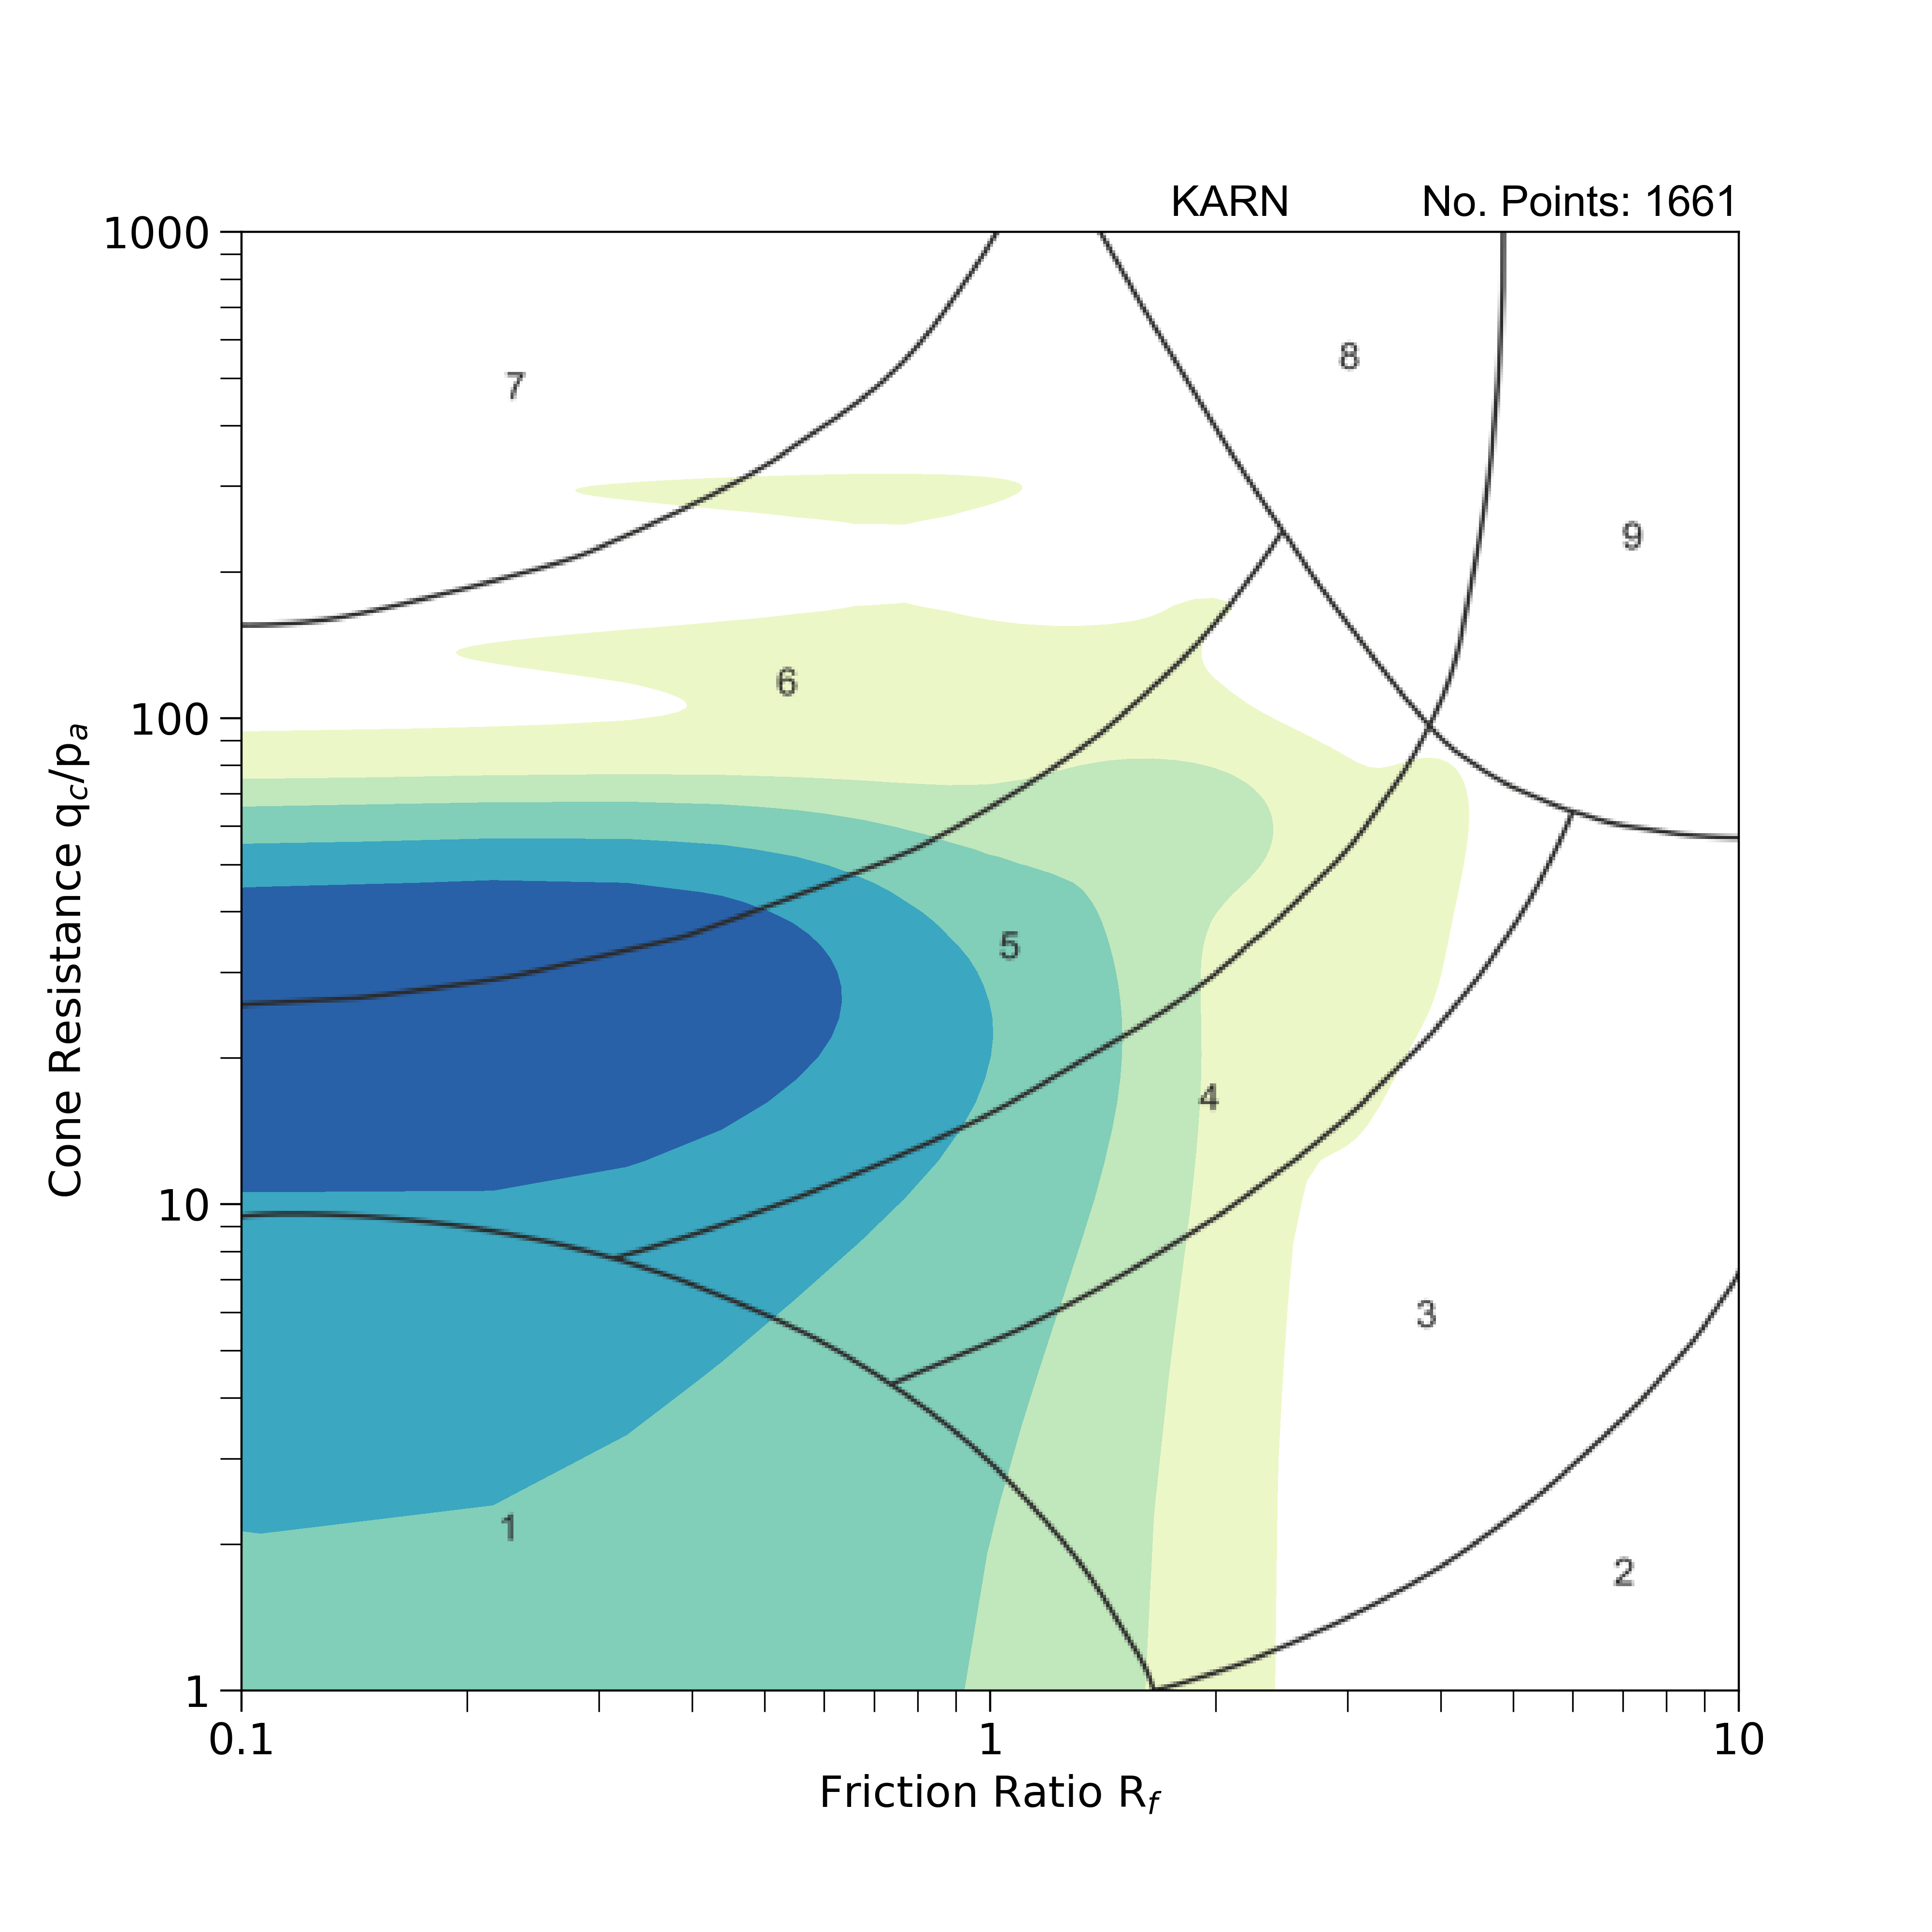
Geotechnical properties: strength tests
Non-normalised soil behaviour type chart after Robertson (2010) with 2D kernel density estimation of dimensionless cone resistance and friction ratio obtained from cone penetration tests. 1: sensitive fine-grained; 2: clay — organic soil; 3: clays — clay to silty clay; 4: silt mixtures — clayey silt and silty clay; 5: sand mixtures — silty sand to sandy silt; 6: sands — cleans sands to silty sands; 7: dense sand to gravelly sand; 8: stiff sand to clayey sand (overconsolidated or cemented); 9: stiff, fine-grained sand (overconsolidated or cemented). BGS © UKRI.
Law Sand And Gravel Member (LAWSG)
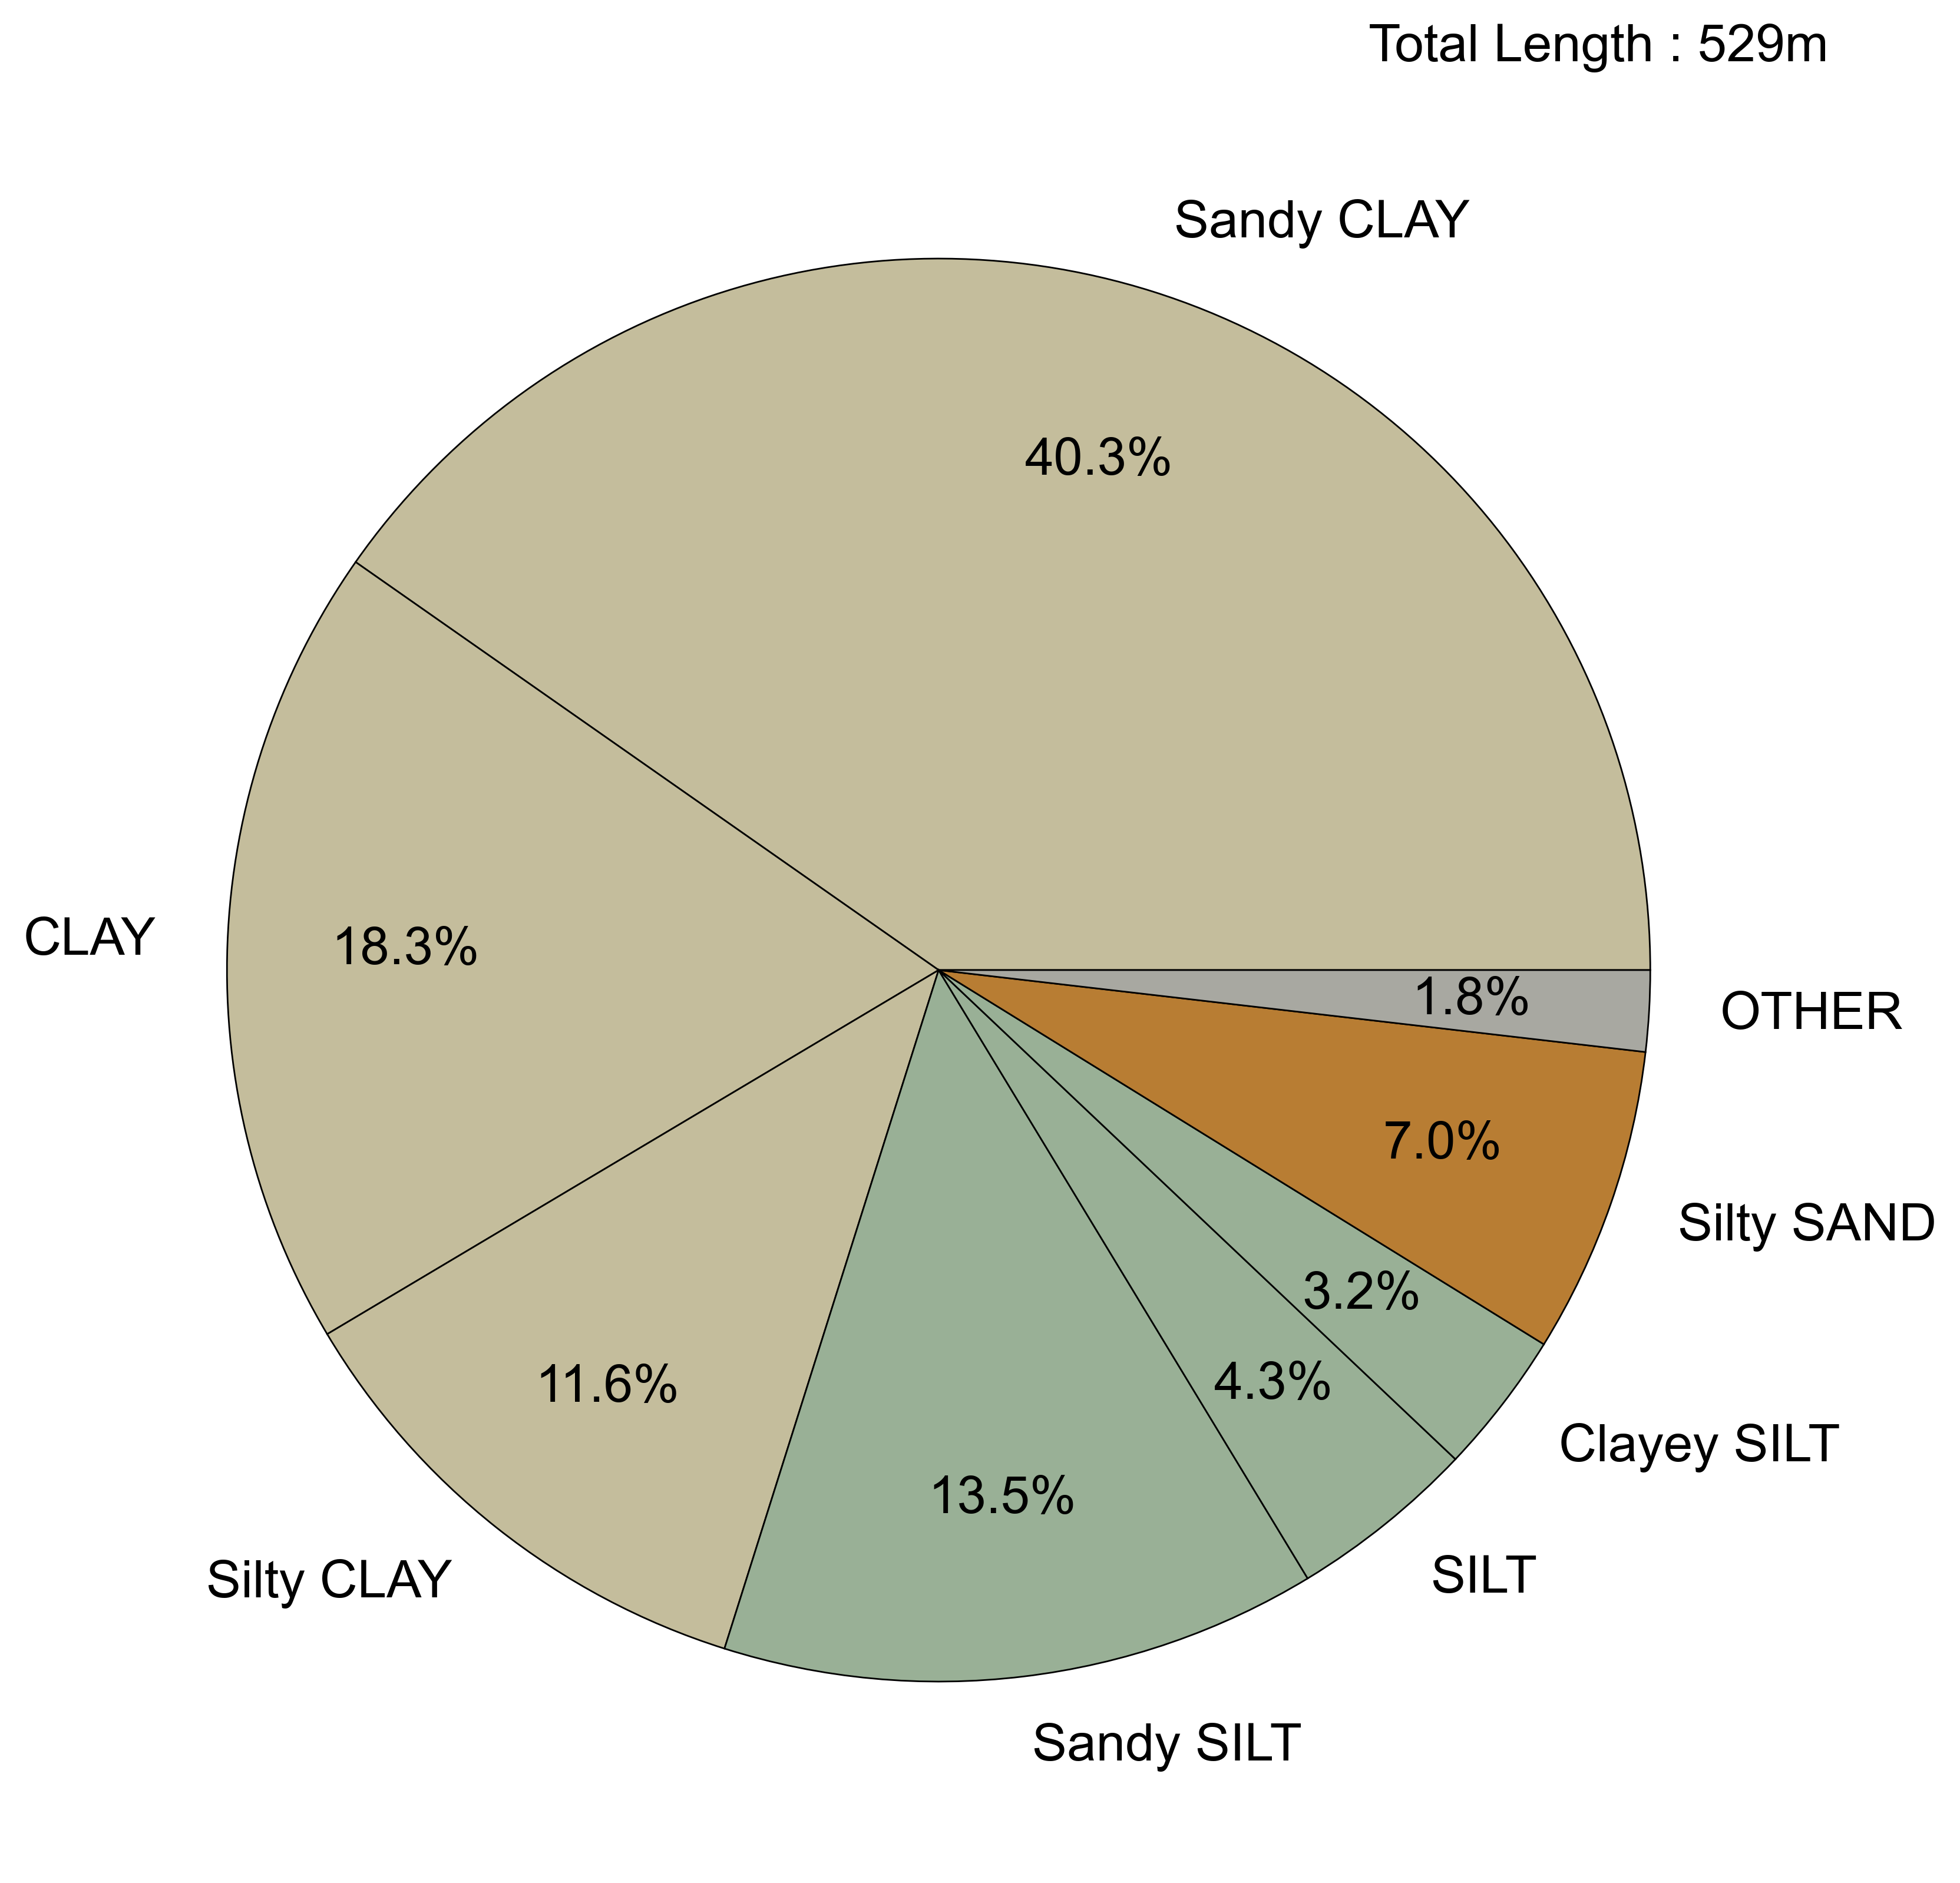
Geological descriptions
Pie chart summarising the dominant soil types (primary and secondary constituents) described in exploratory hole logs based on total metres logged. Descriptions have been simplified to remove tertiary constituents and a threshold of 1 per cent applied to aid graphical presentation. Soil types representing less than 1 per cent of the total logged are included in the ‘other’ category. BGS © UKRI.
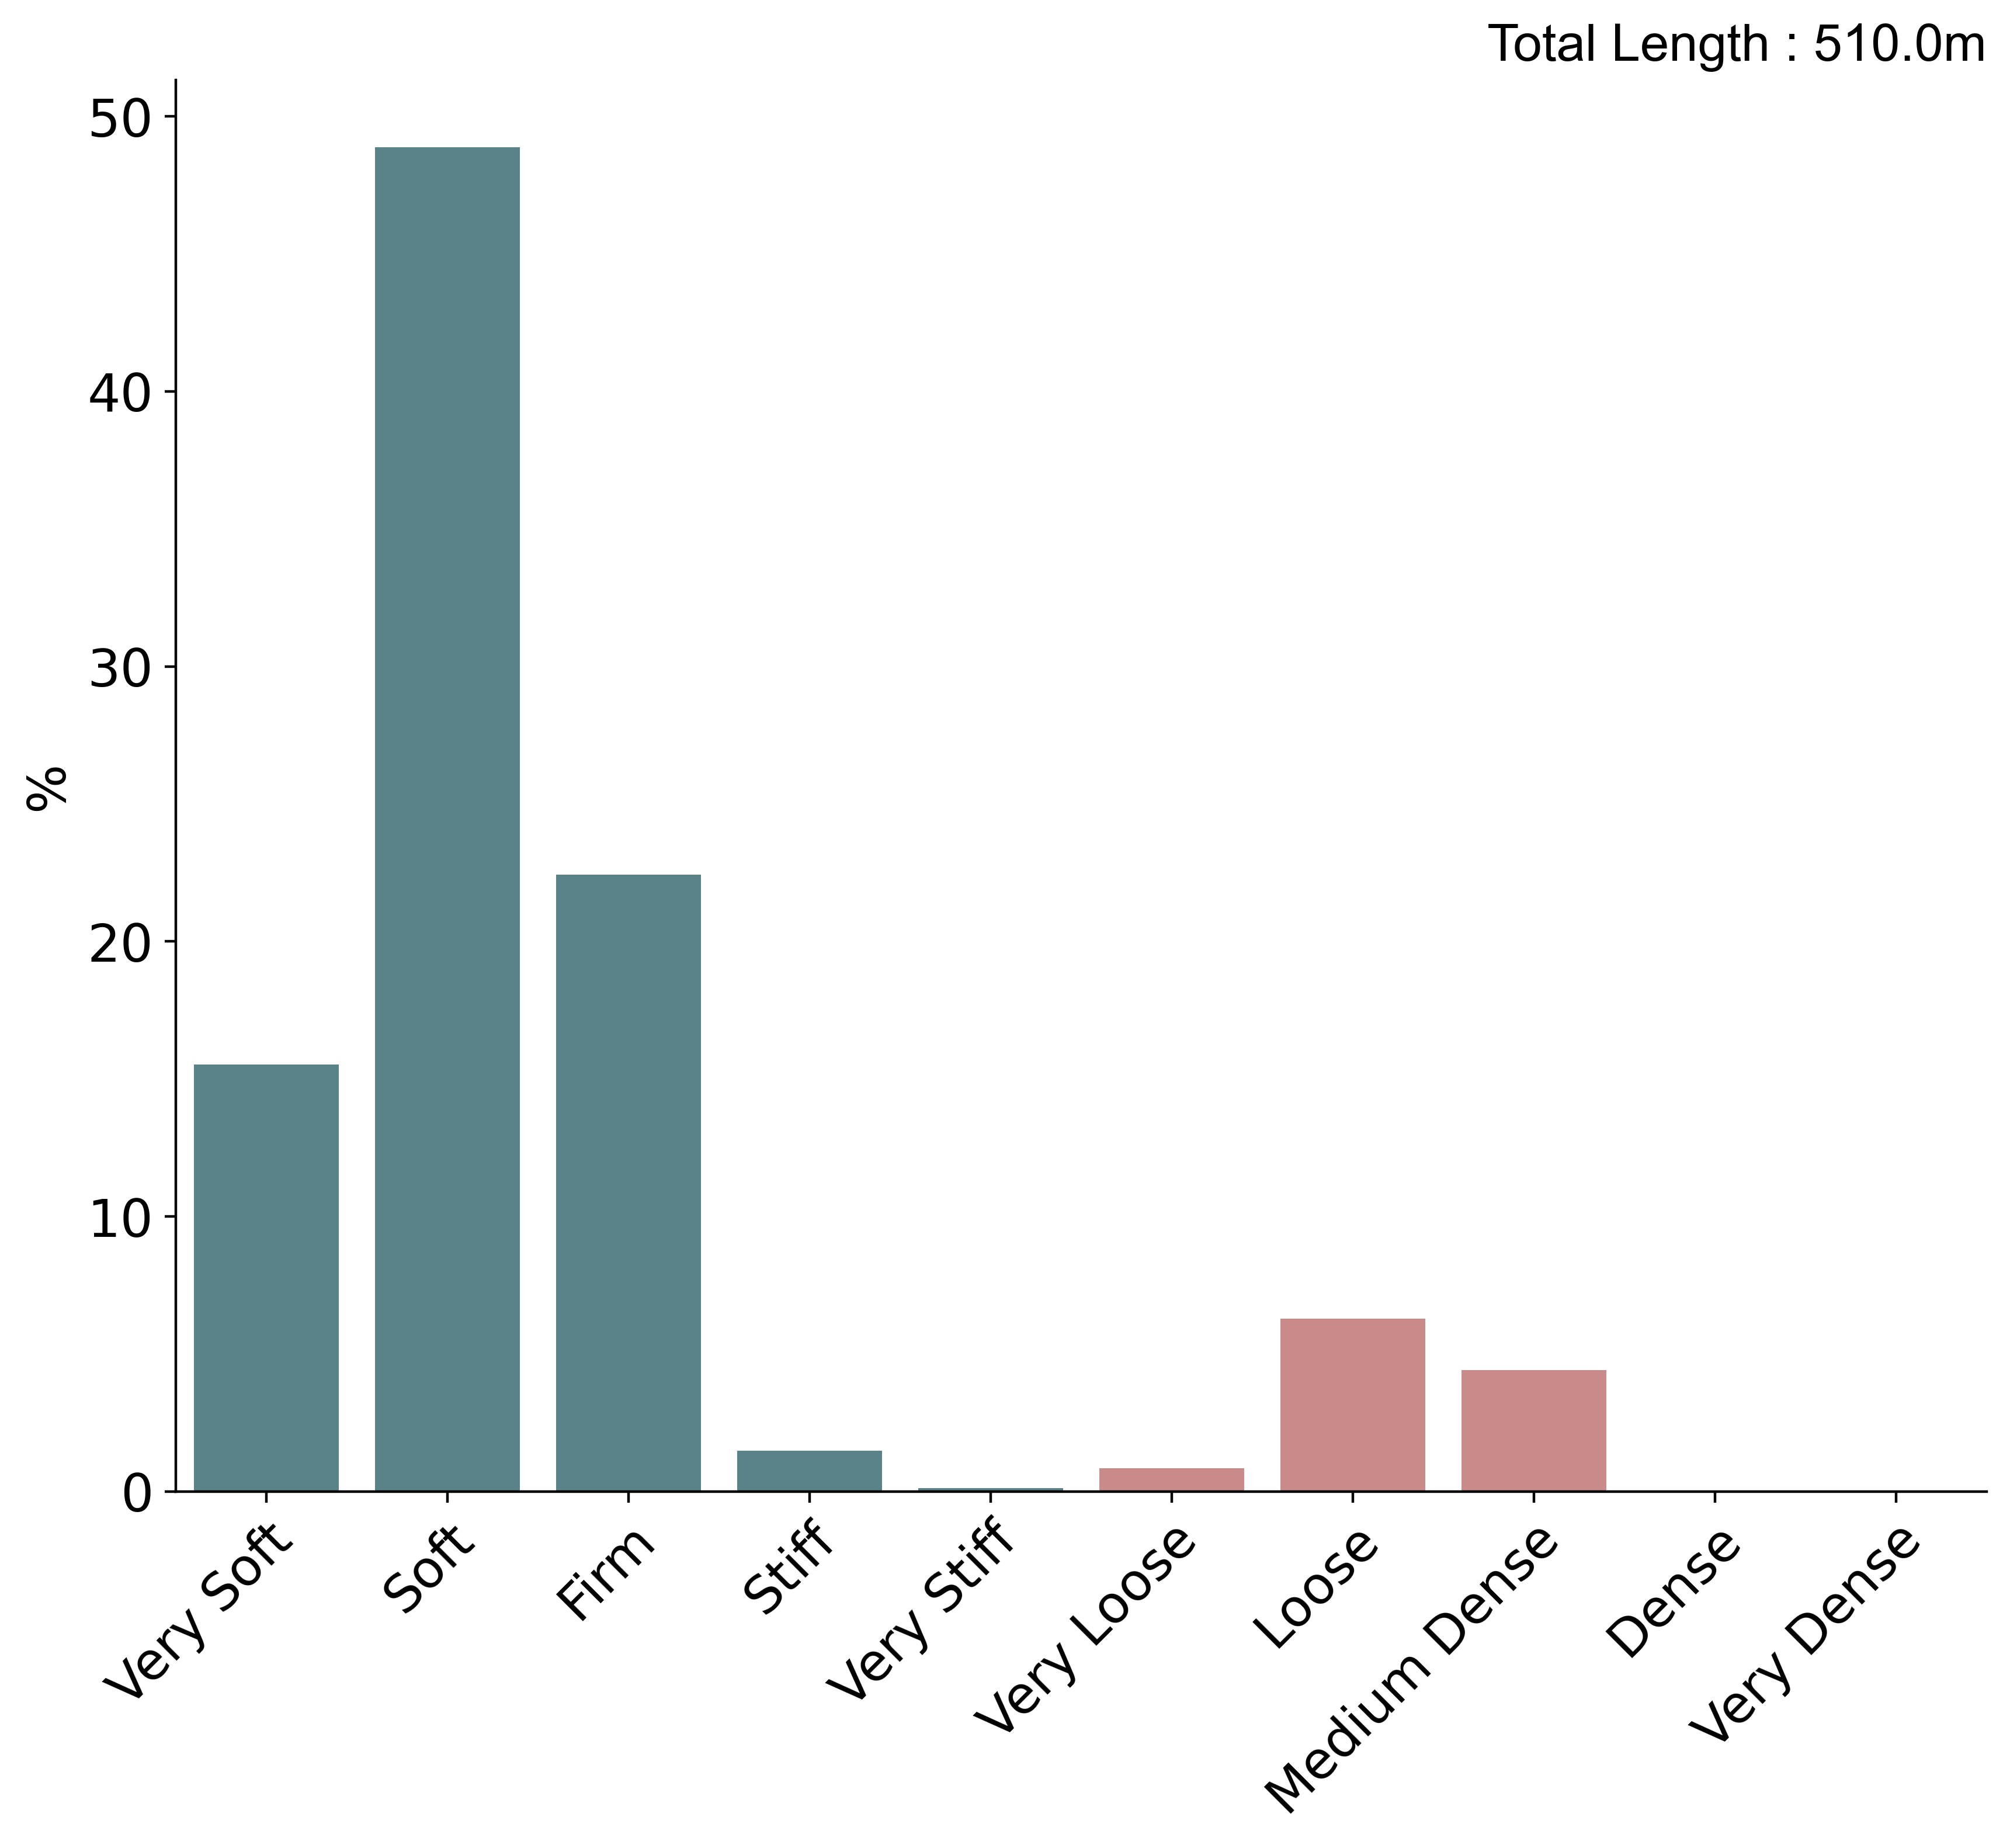
Geological descriptions
Histogram summarising the consistency and relative density described in exploratory hole logs based on total metres logged. BGS © UKRI.
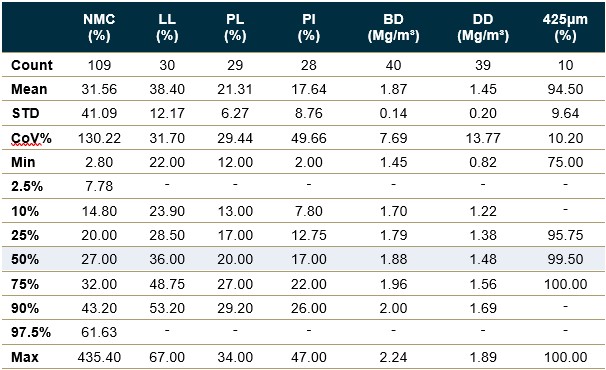
Geotechnical properties: classification tests
Statistical summaries of geotechnical index properties from laboratory tests. STD – standard deviation; CoV% – coefficient of variation; NMC – natural moisture content; LL – liquid limit; PL – plastic limit; PI – plasticity index; BD – bulk density; DD – dry density; 425 μm – percentage of sample by mass passing 425 μm sieve. Percentiles reported based on sample size; no summaries are provid
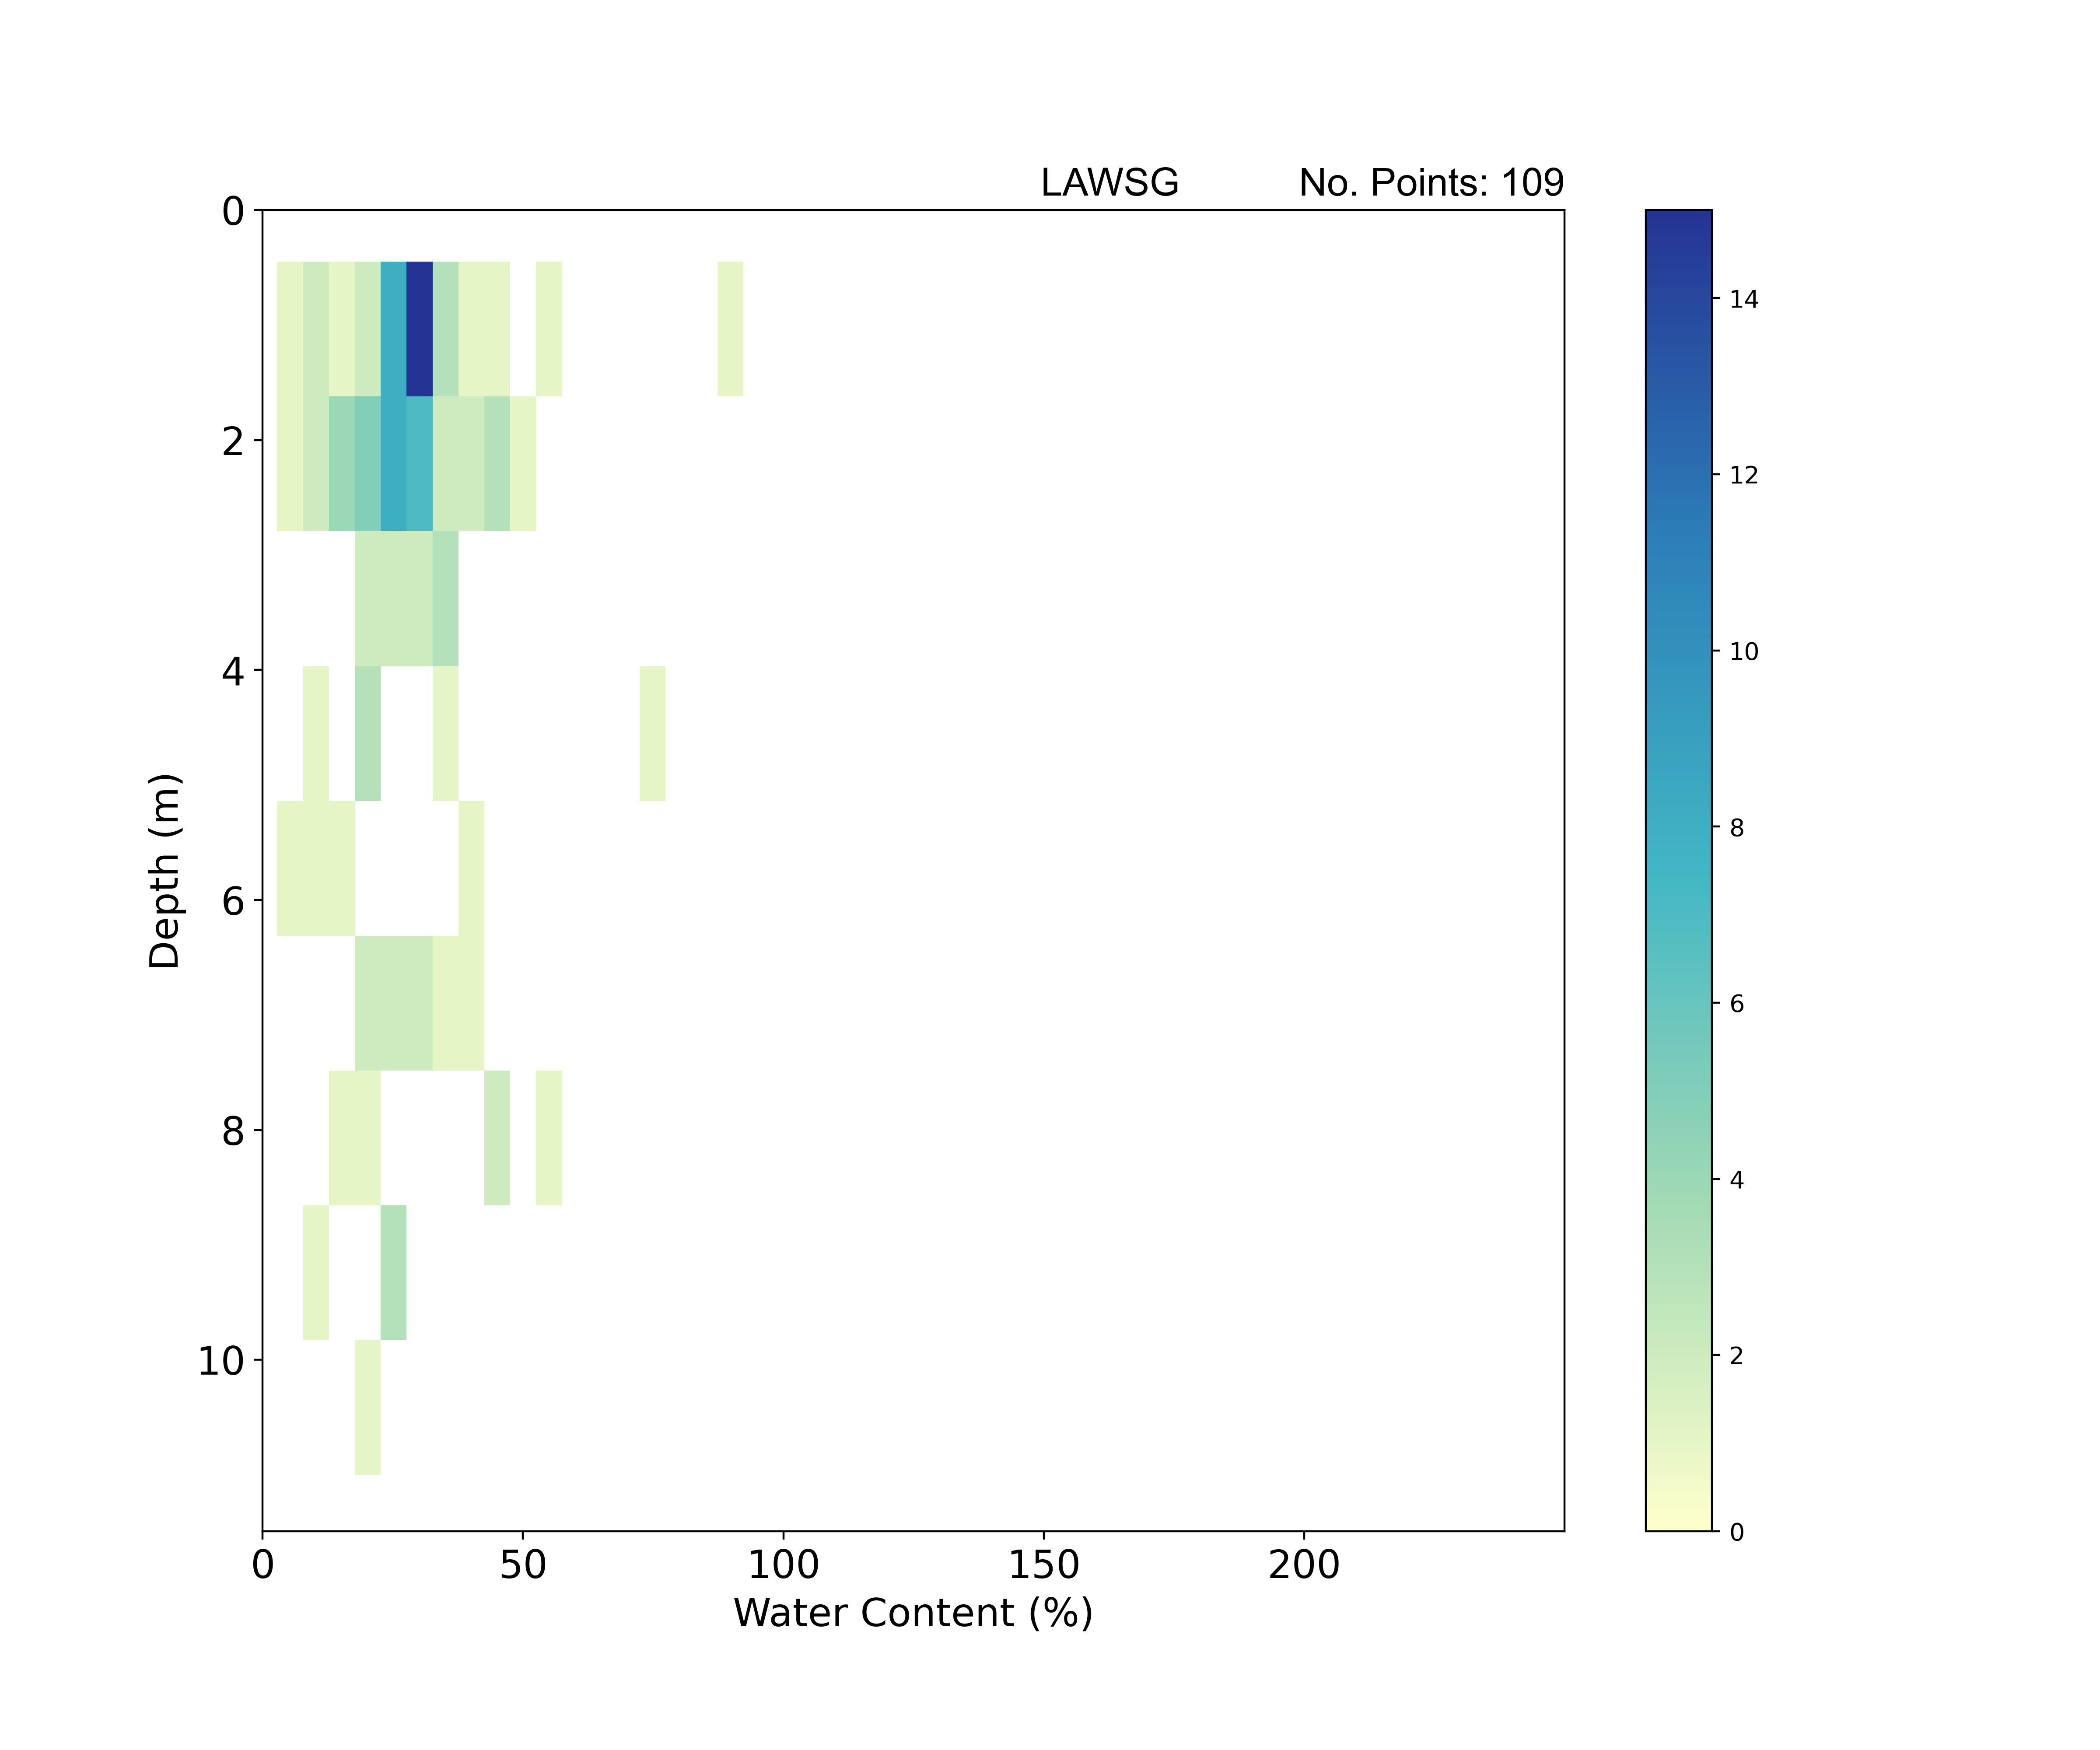
Geotechnical properties: classification tests
2D histogram plot summarising water content with depth. BGS © UKRI.
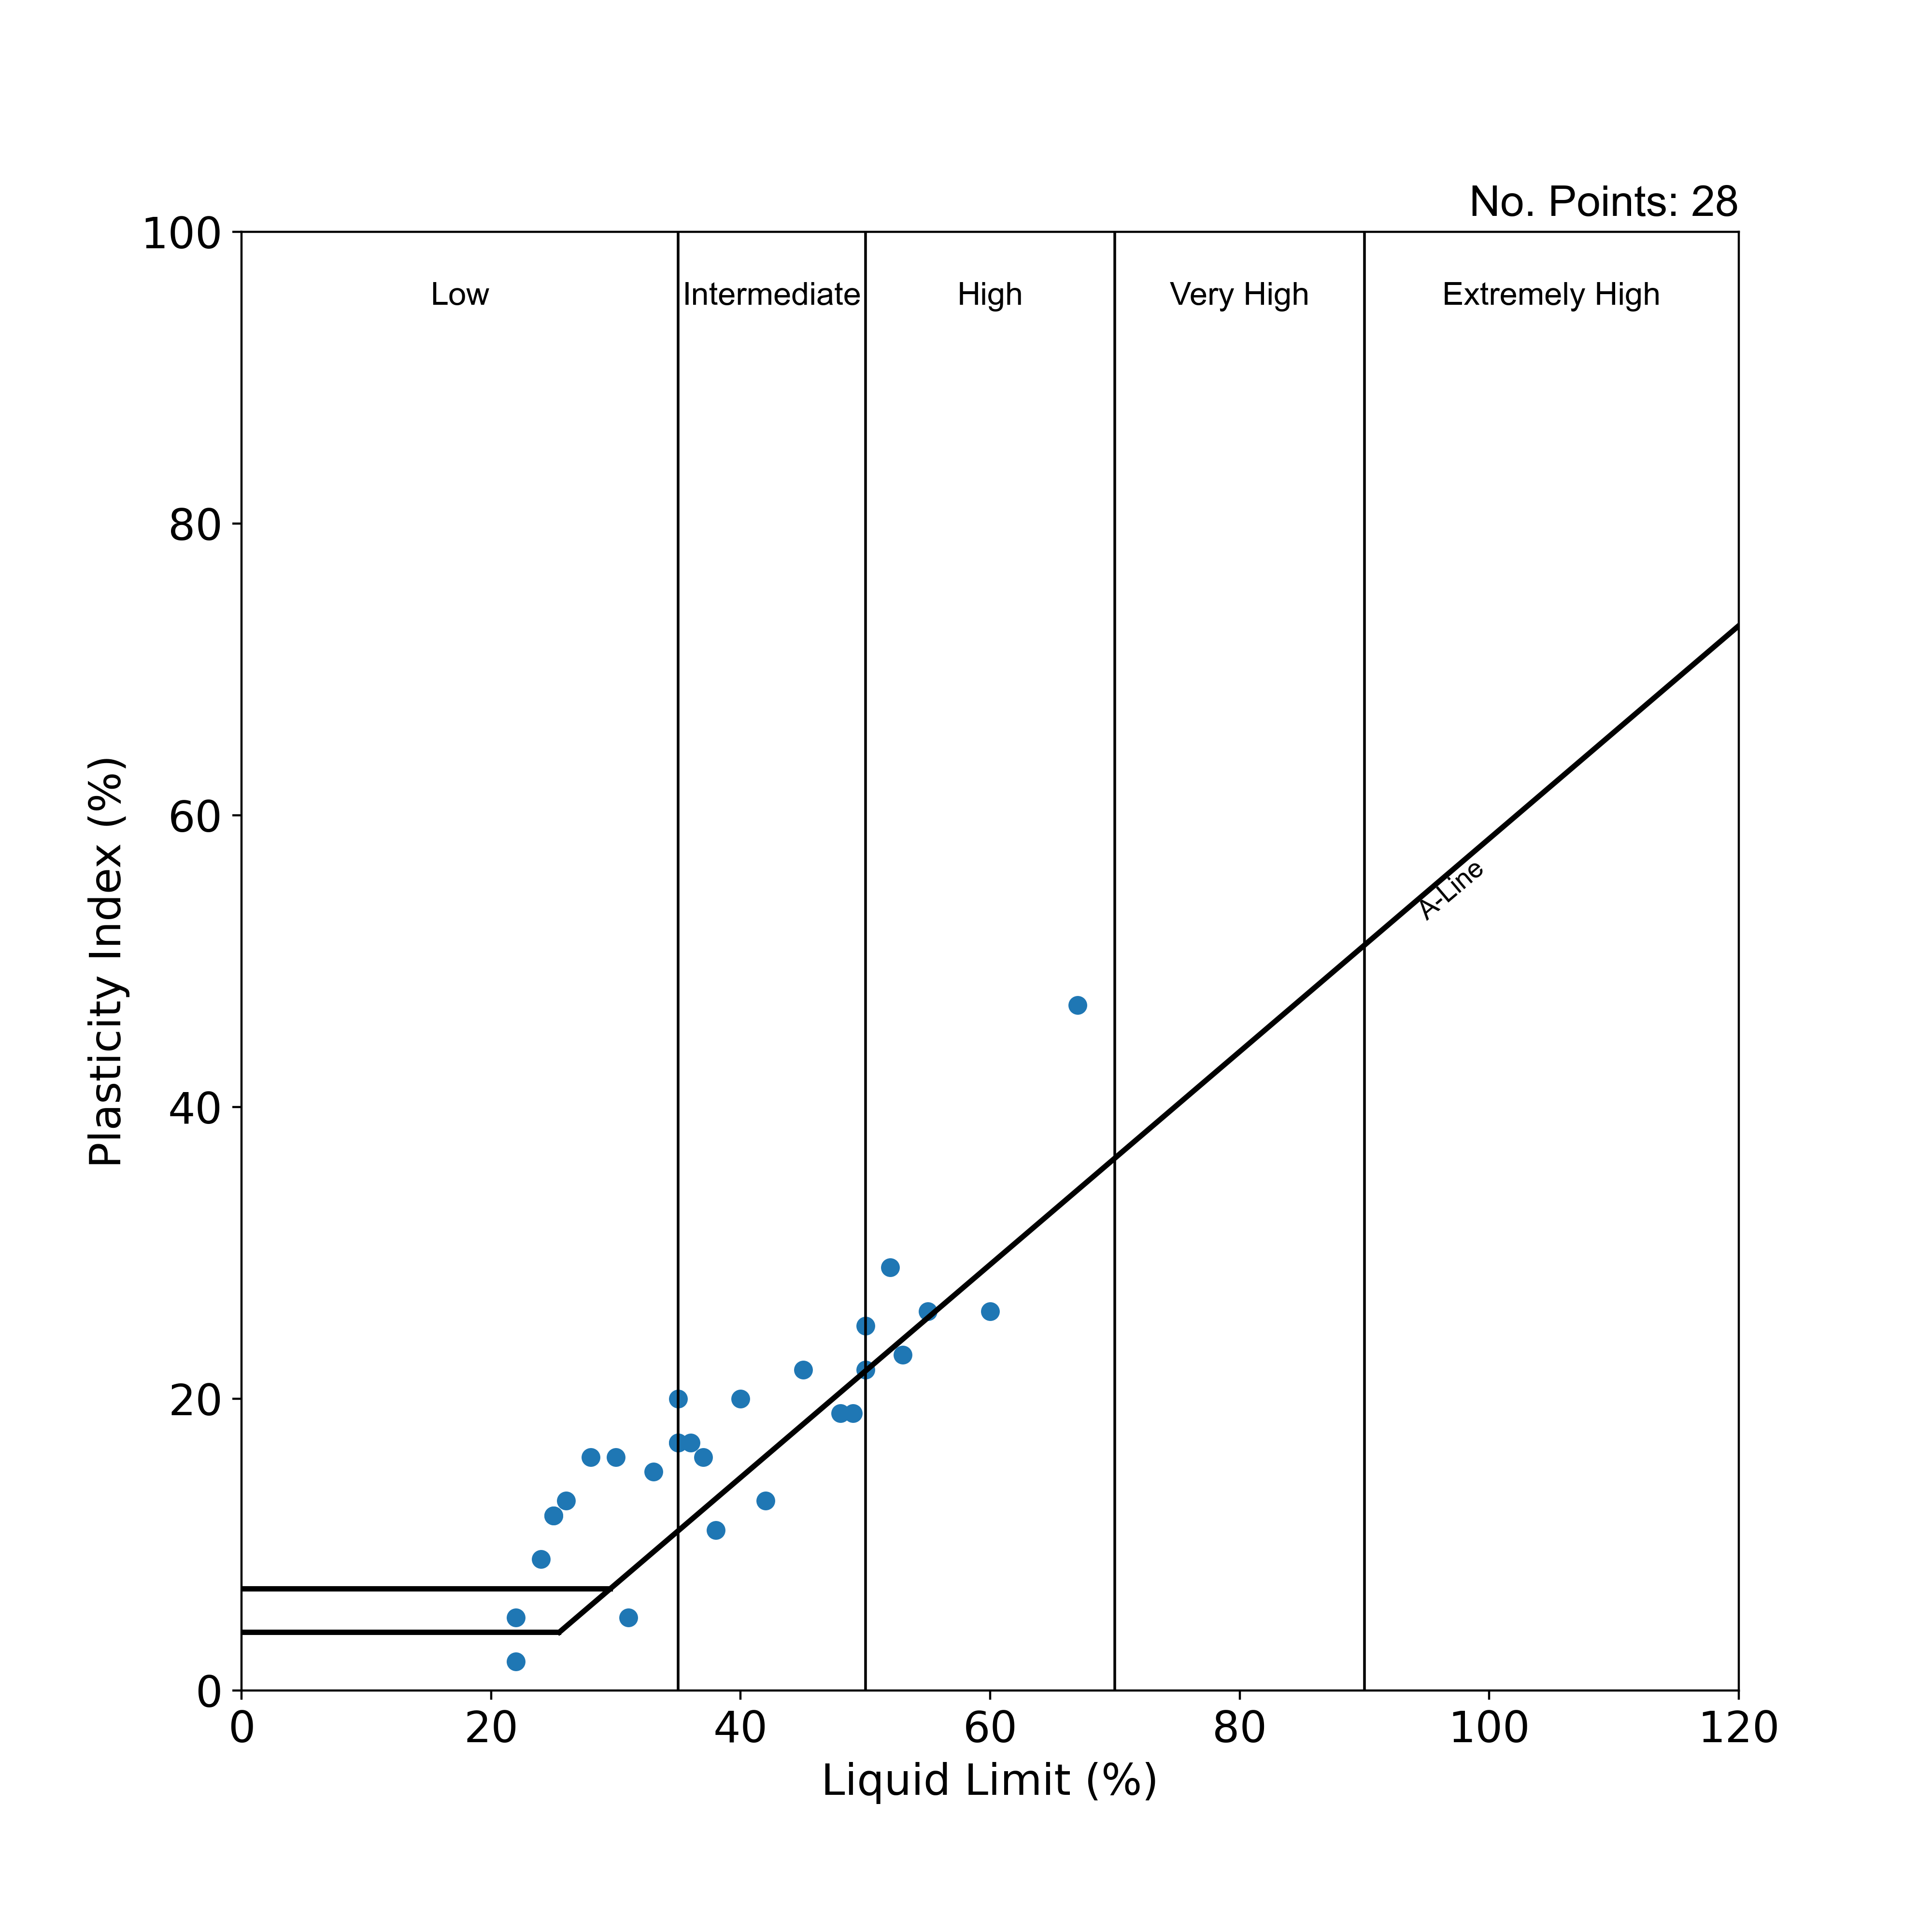
Geotechnical properties: classification tests
Casagrande plasticity plot summarising the distribution of plasticity results. BGS © UKRI.
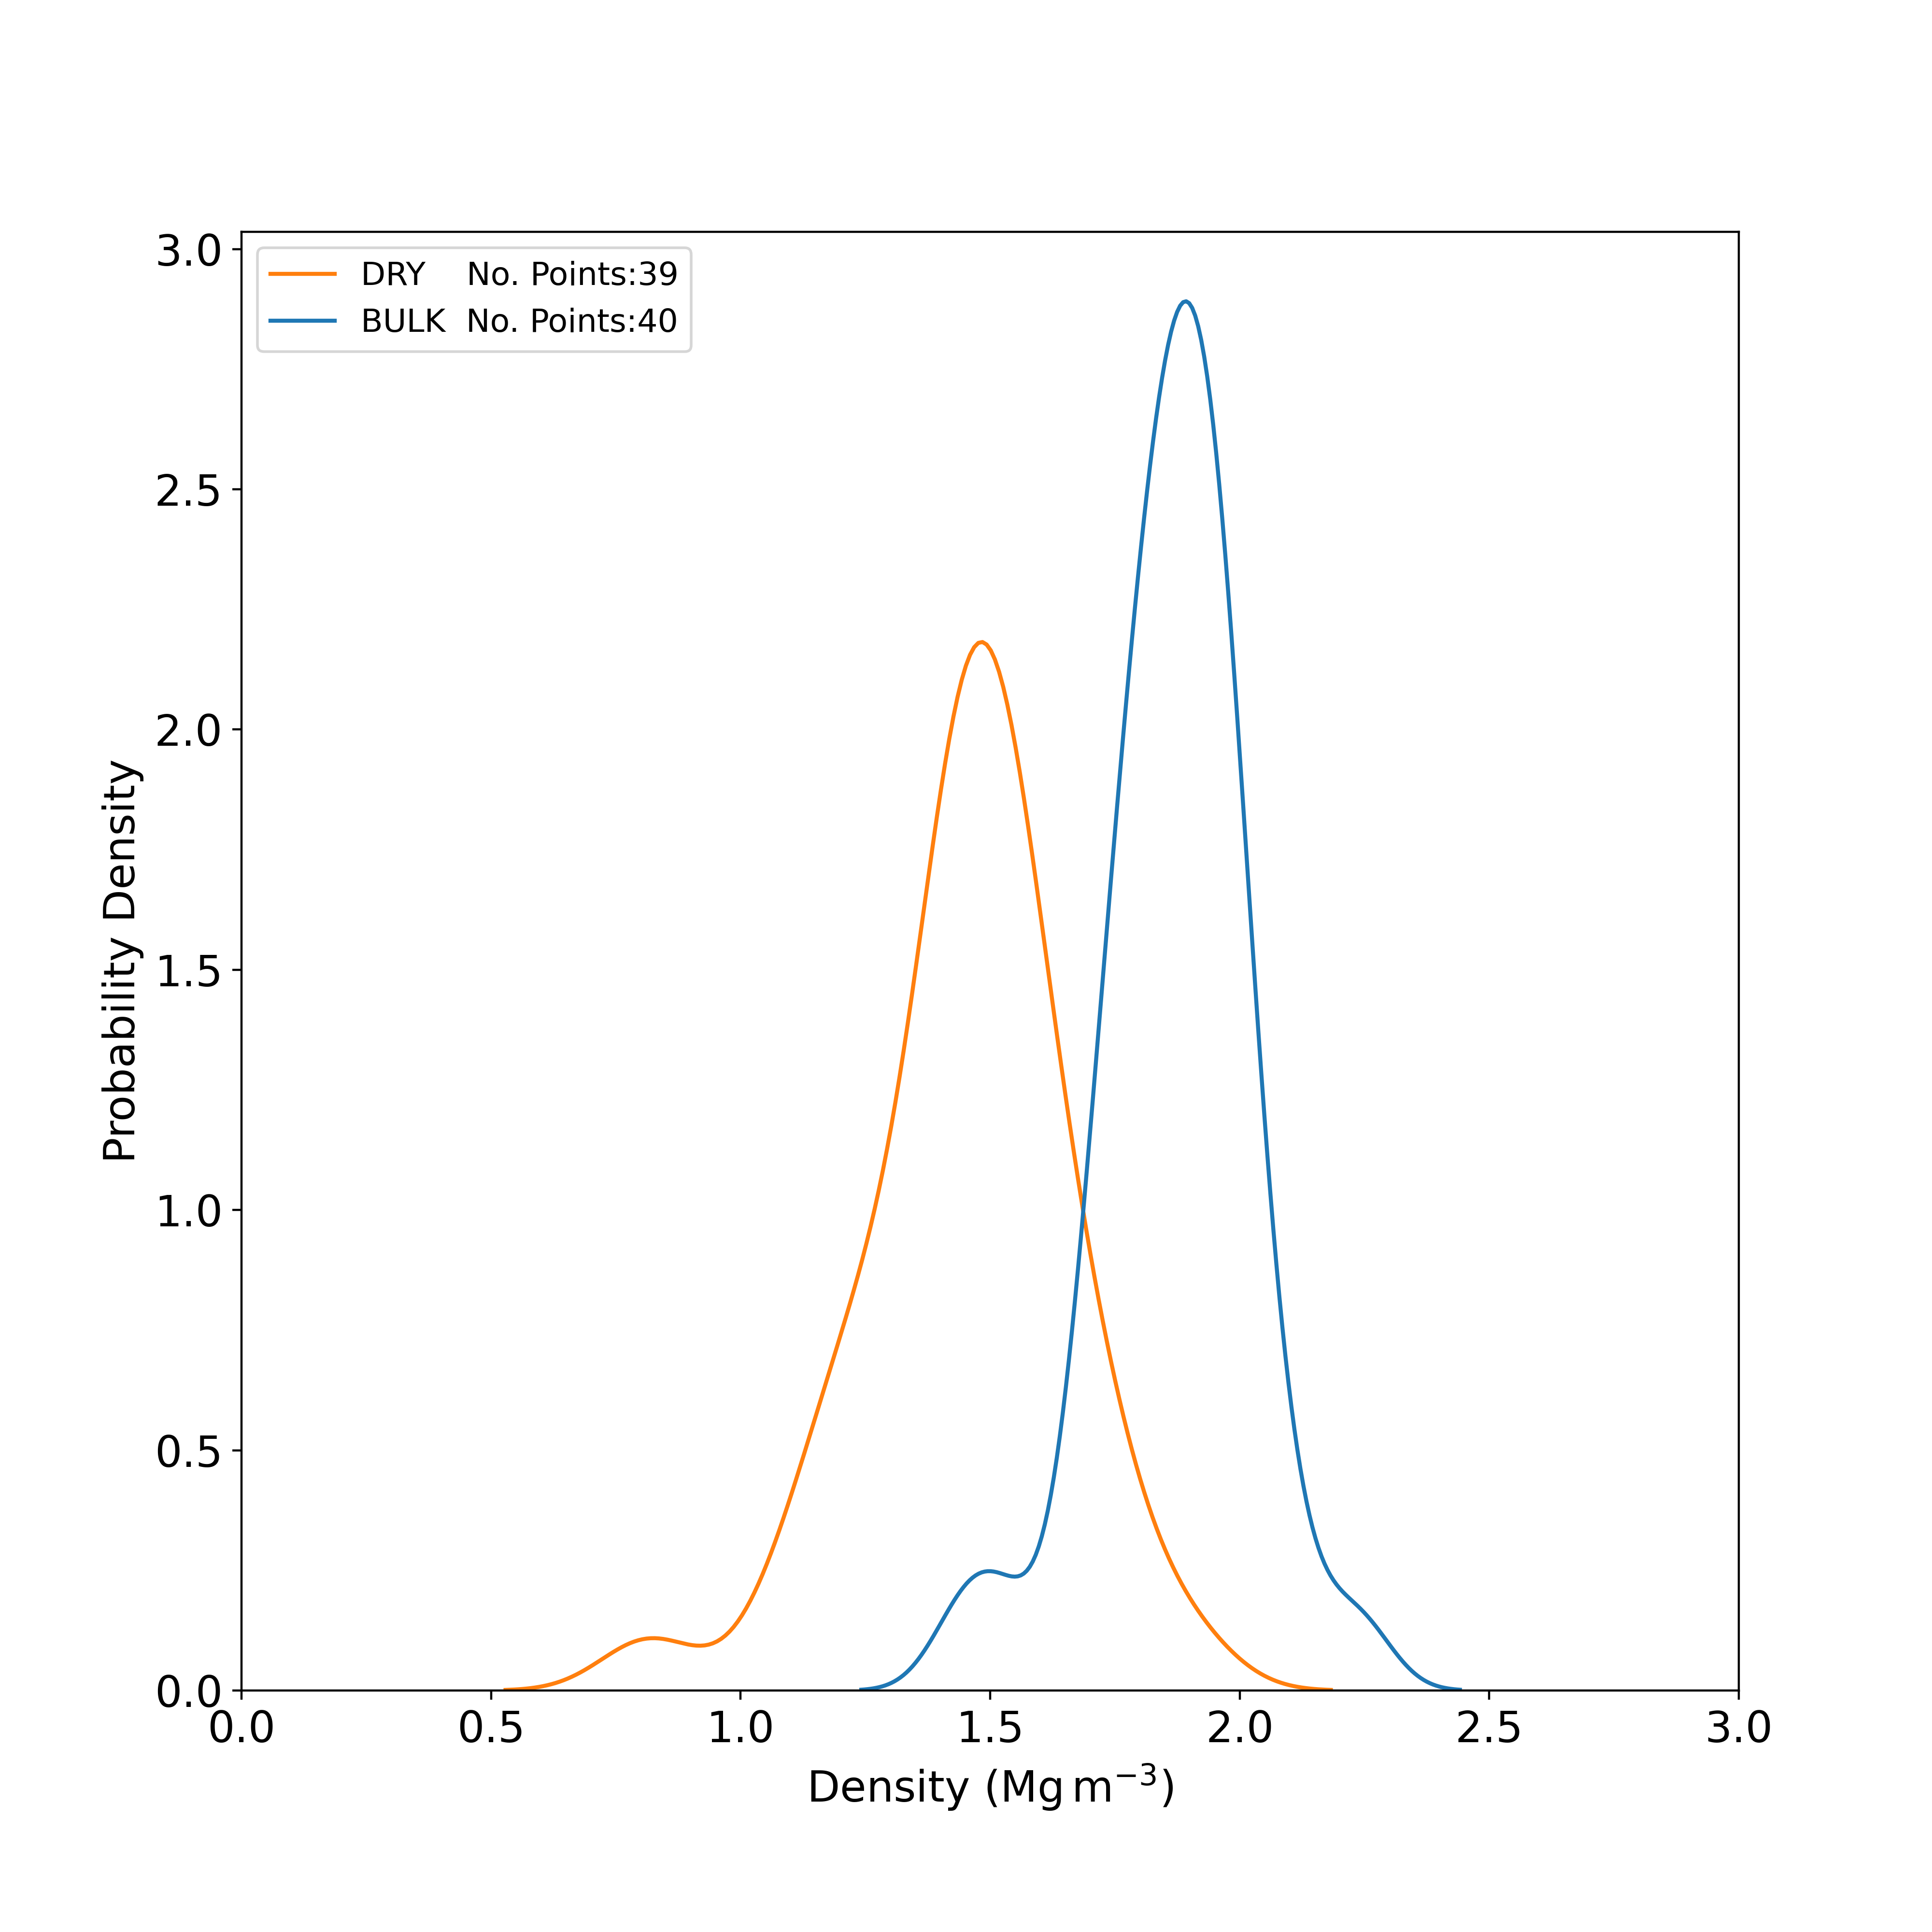
Geotechnical properties: classification tests
Kernel density plot showing the distribution of bulk density and dry density results obtained from laboratory tests. BGS © UKRI.
Geotechnical properties: strength tests
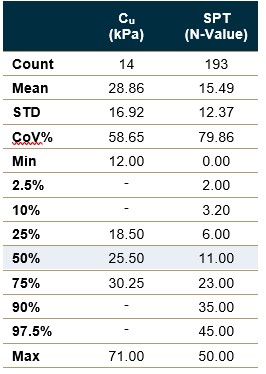
Statistical summaries of geotechnical strength properties from laboratory and in situ tests. STD – standard deviation; CoV% – coefficient of variation; Cu – undrained shear strength obtained from unconsolidated undrained triaxial tests; SPT – standard penetration test (number of tests with N-value > 50 or with no N-value = 13). Percentiles reported based on sample size; no summaries are provided where there are fewer than 5 samples. BGS © UKRI
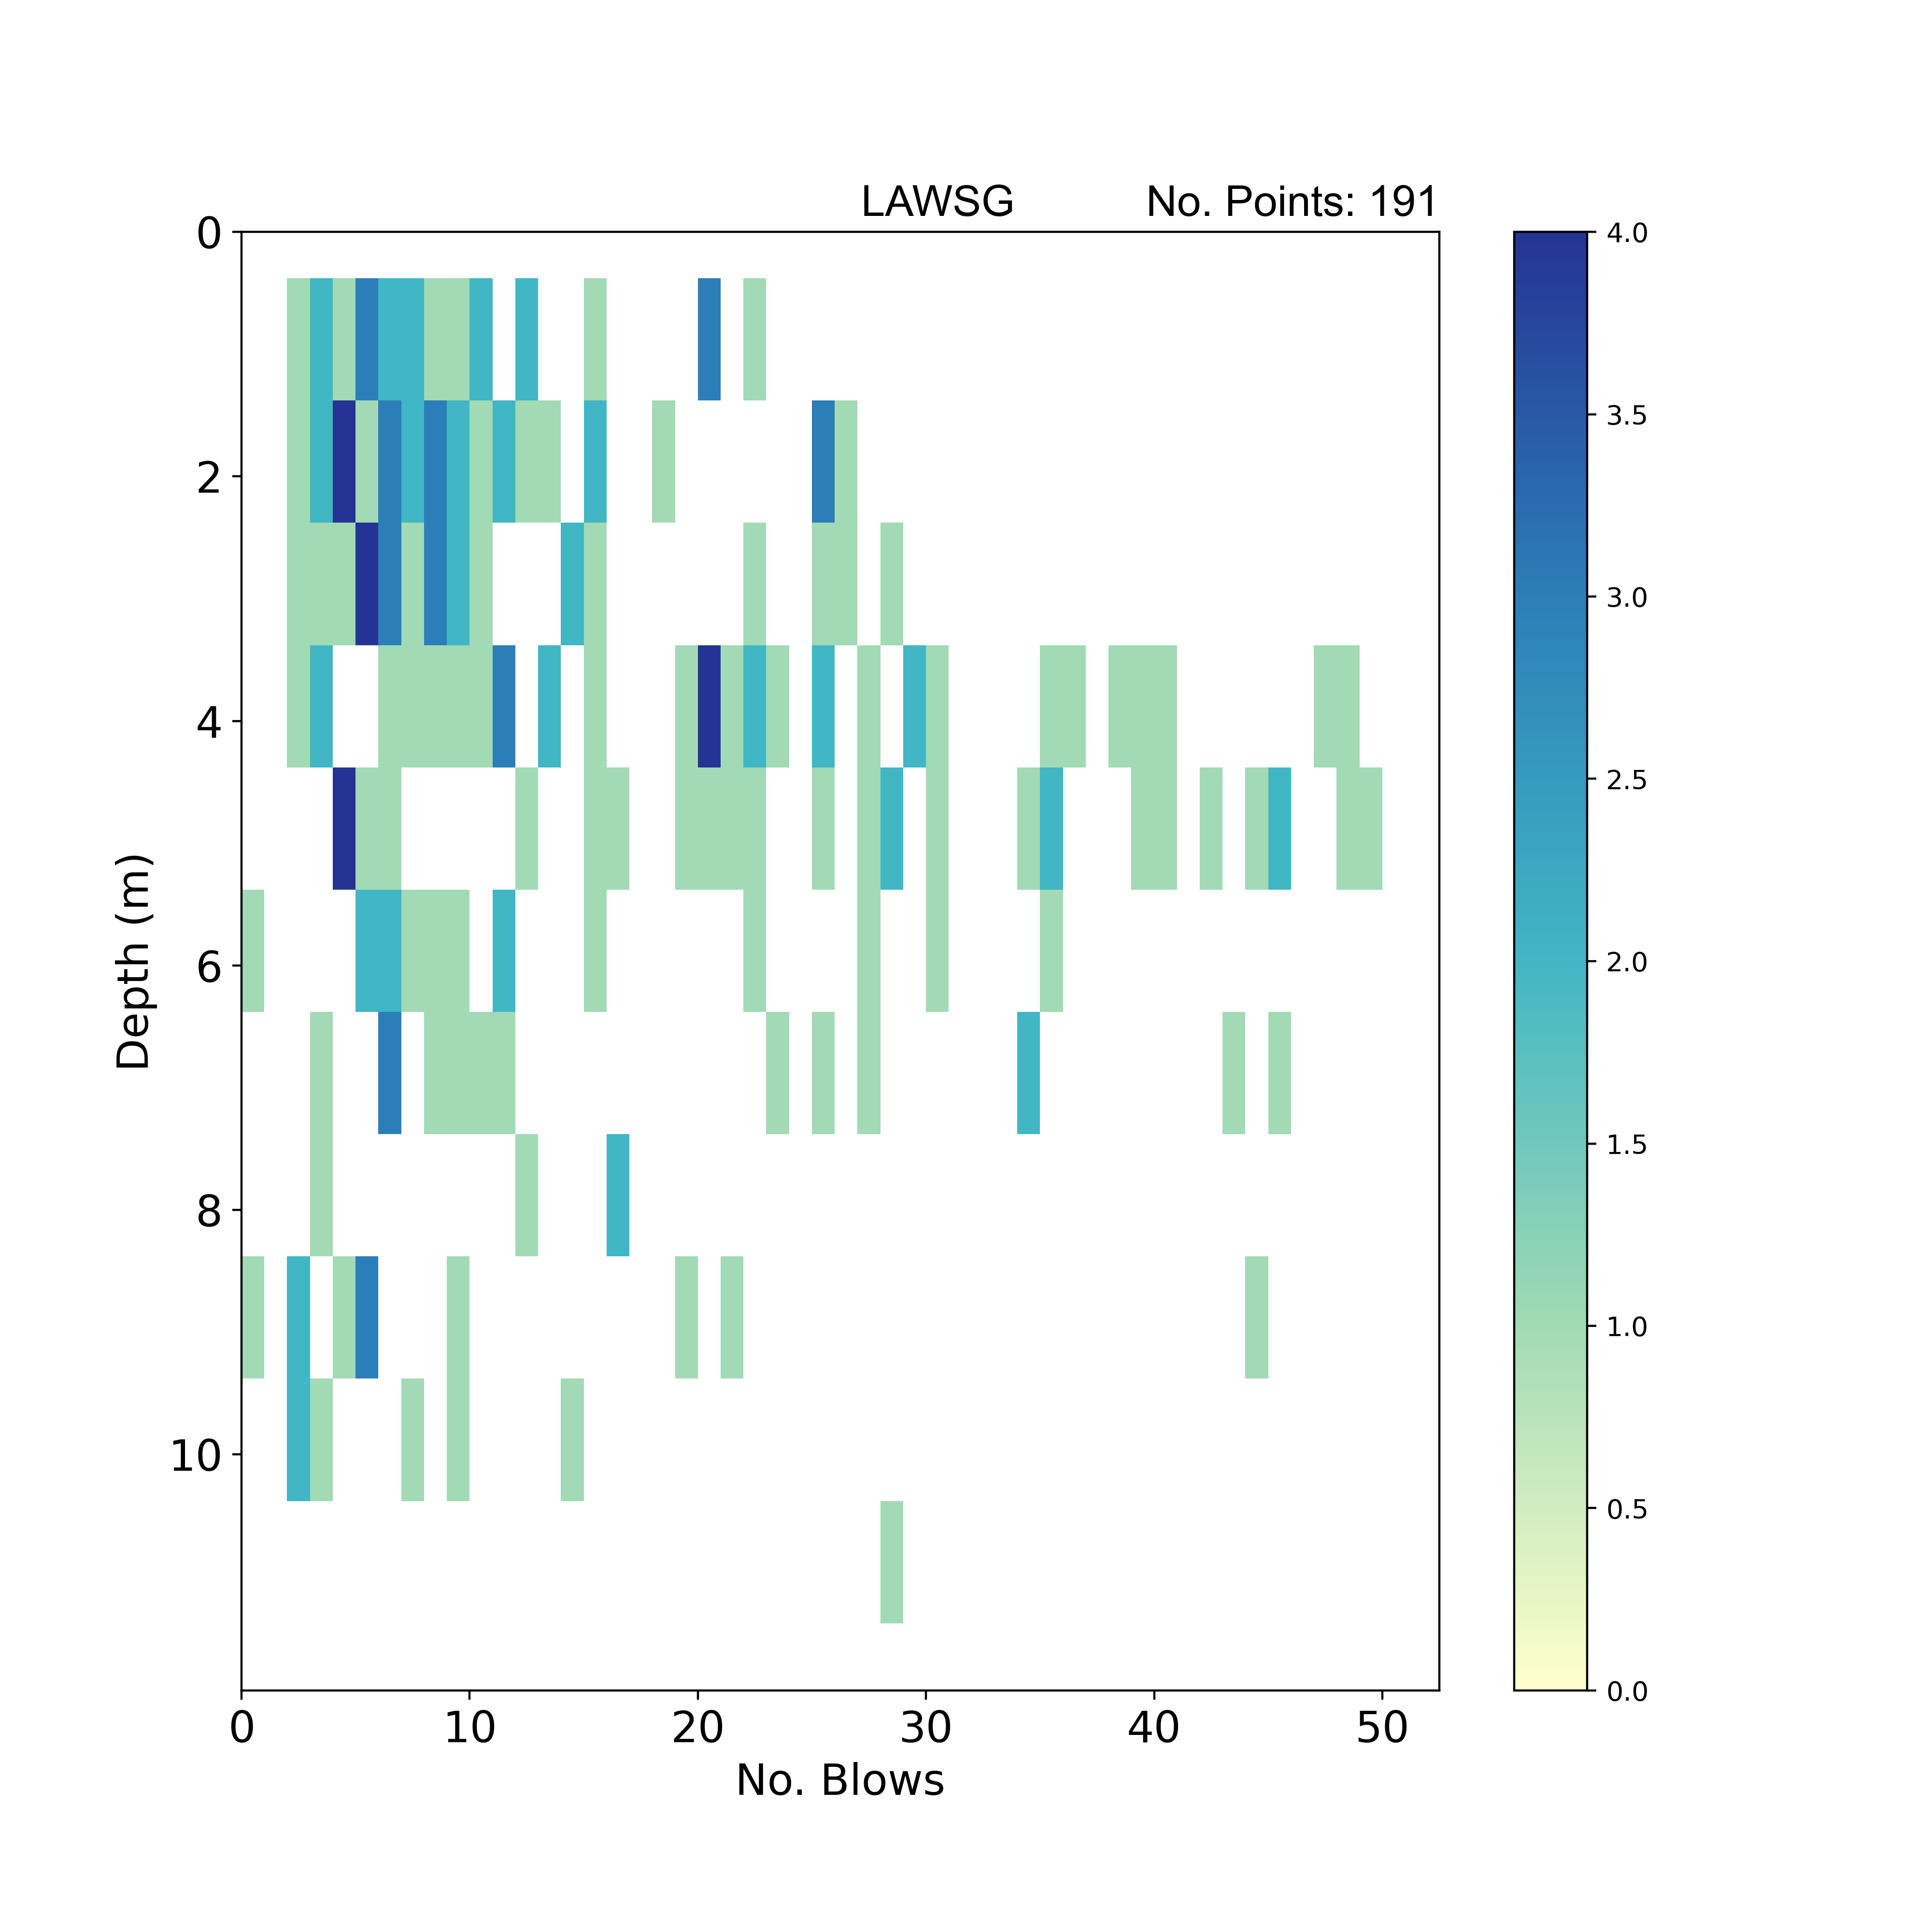
Geotechnical properties: strength tests
2D histogram summarising SPT N-value results with depth. Number of tests with N-value > 50 or with no N-value = 13. BGS © UKRI.
Linwood Clay Member (LIWD)
Geological descriptions
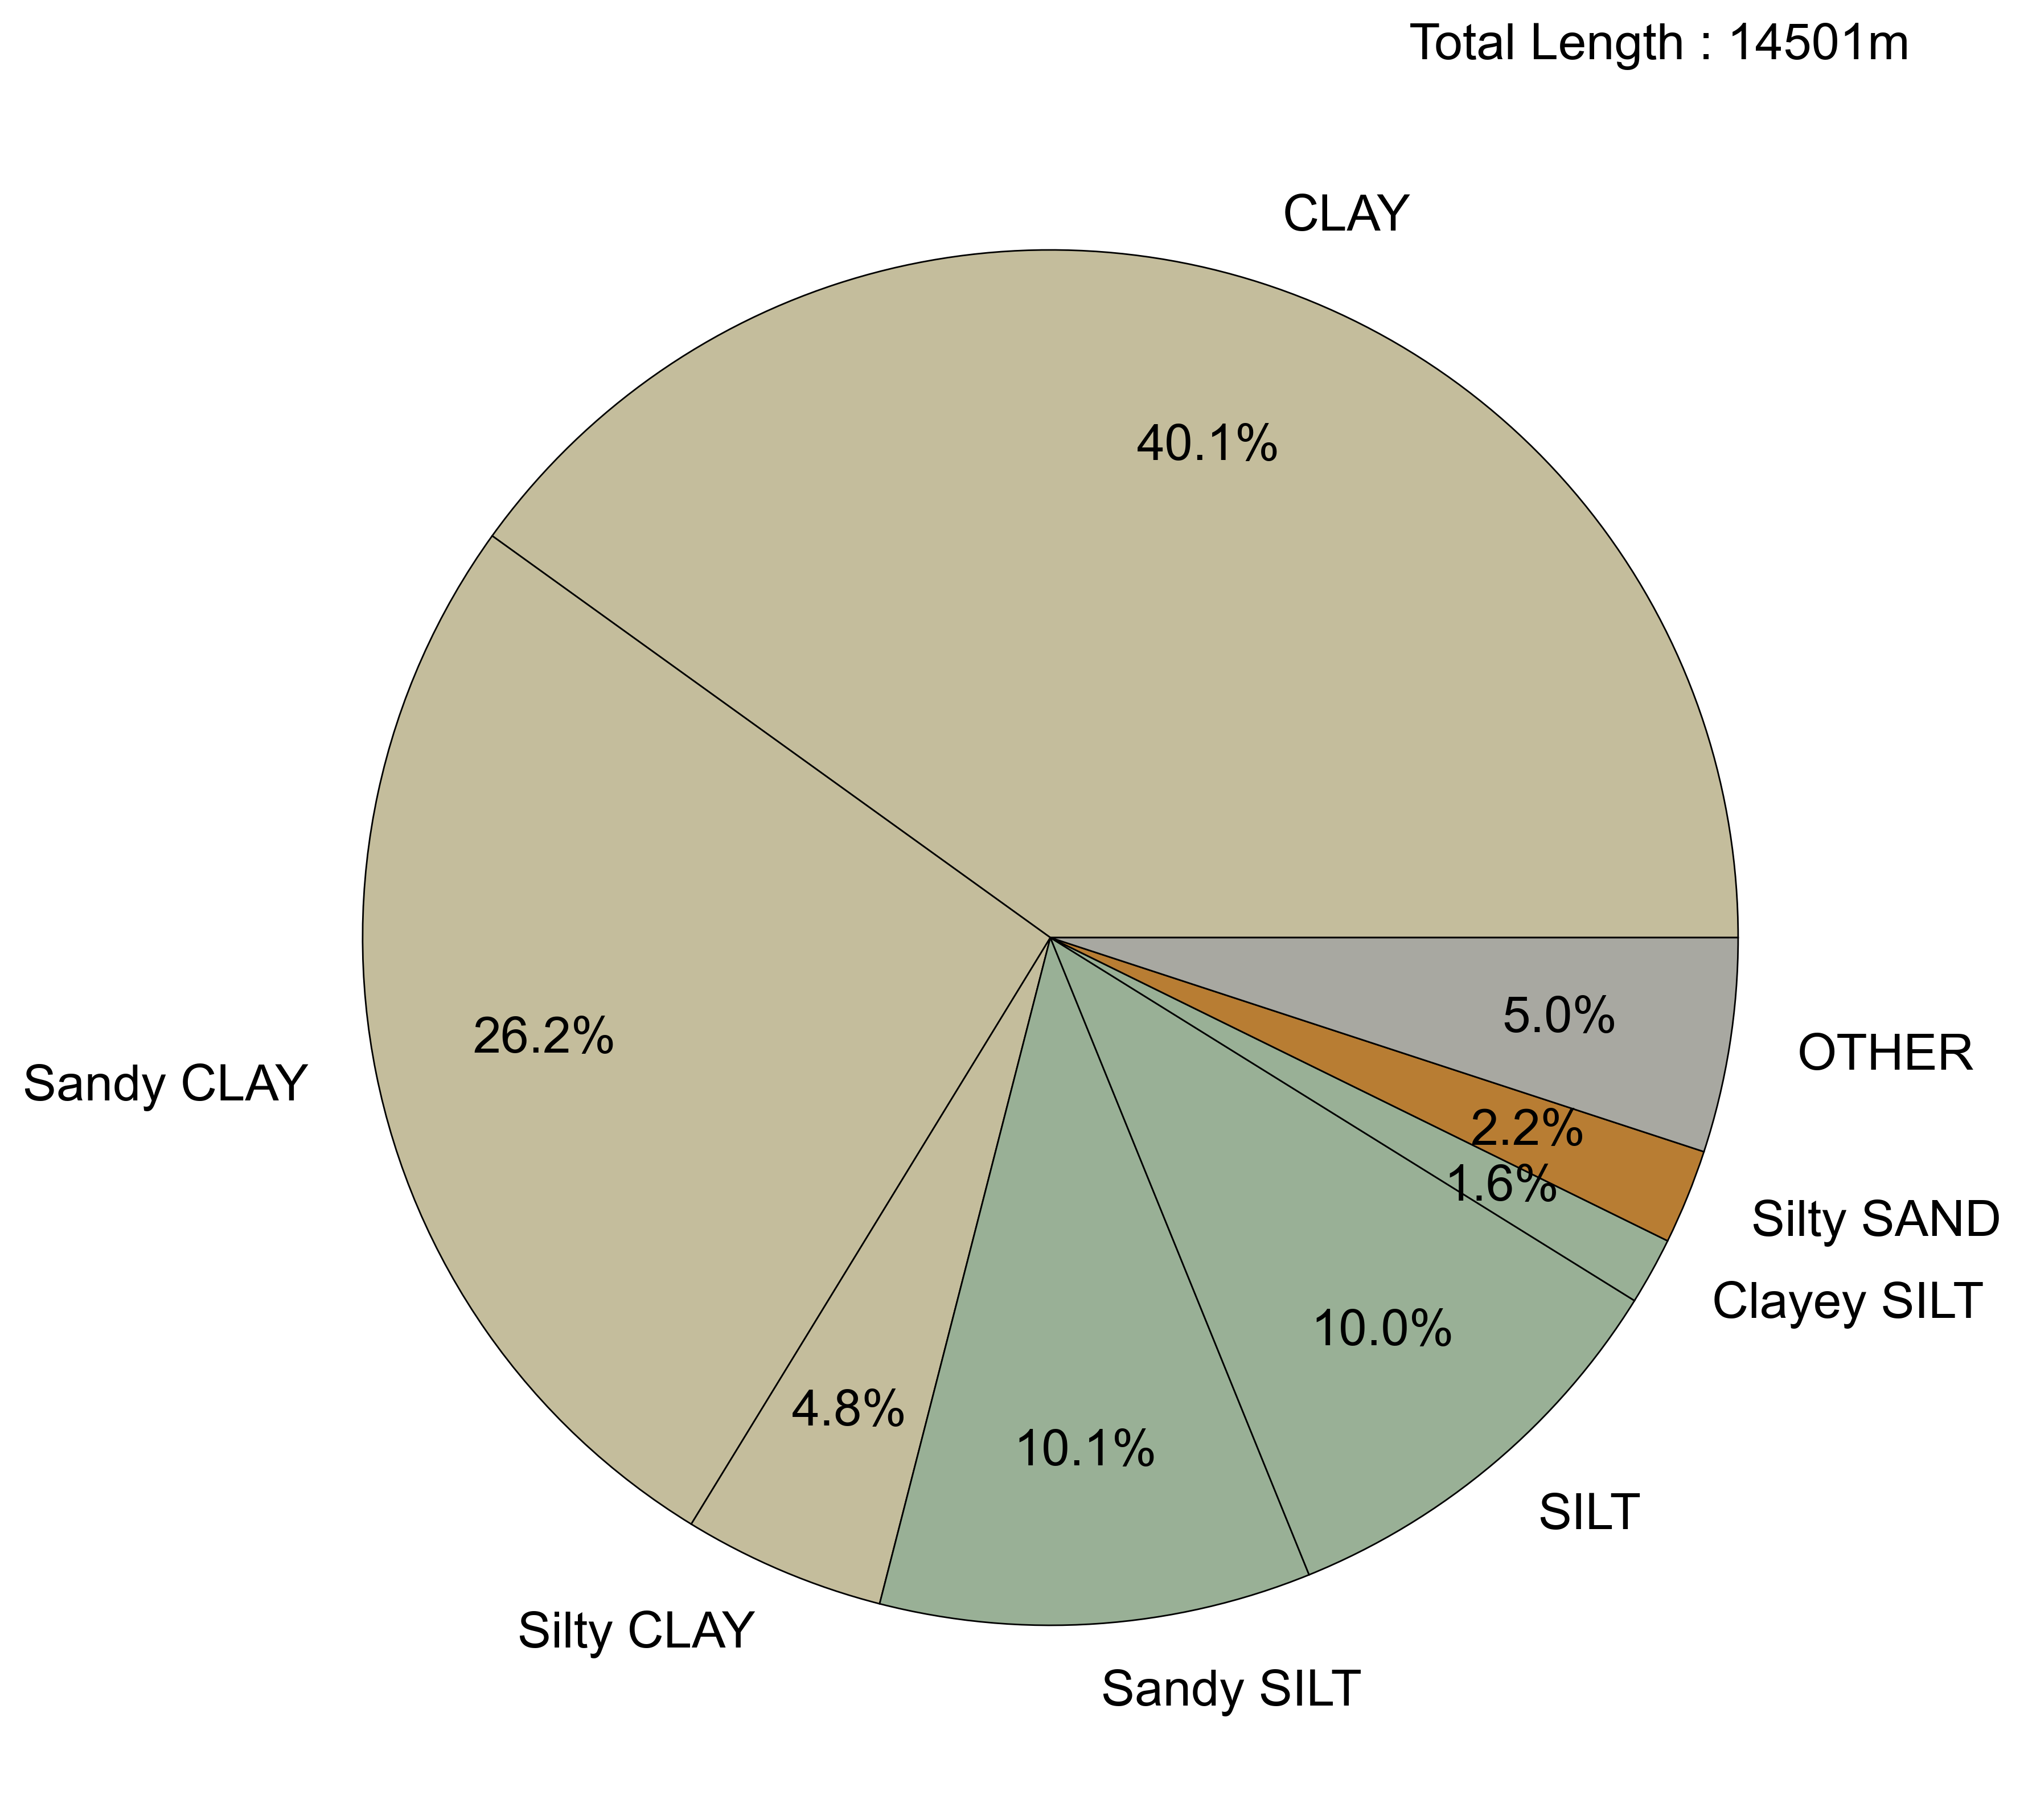
Pie chart summarising the dominant soil types (primary and secondary constituents) described in exploratory hole logs based on total metres logged. Descriptions have been simplified to remove tertiary constituents and a threshold of 1 per cent applied to aid graphical presentation. Soil types representing less than 1 per cent of the total logged are included in the ‘other’ category. BGS © UKRI.
Geological descriptions
Histogram summarising the consistency and relative density described in exploratory hole logs based on total metres logged. BGS © UKRI.
Geotechnical properties: classification tests
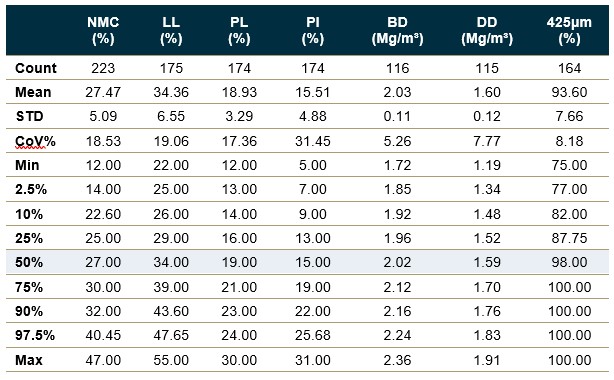
Statistical summaries of geotechnical index properties from laboratory tests. STD – standard deviation; CoV% – coefficient of variation; NMC – natural moisture content; LL – liquid limit; PL – plastic limit; PI – plasticity index; BD – bulk density; DD – dry density; 425 μm – percentage of sample by mass passing 425 μm sieve. Percentiles reported based on sample size; no summaries are provided where there are fewer than 5 samples. BGS © UKRI
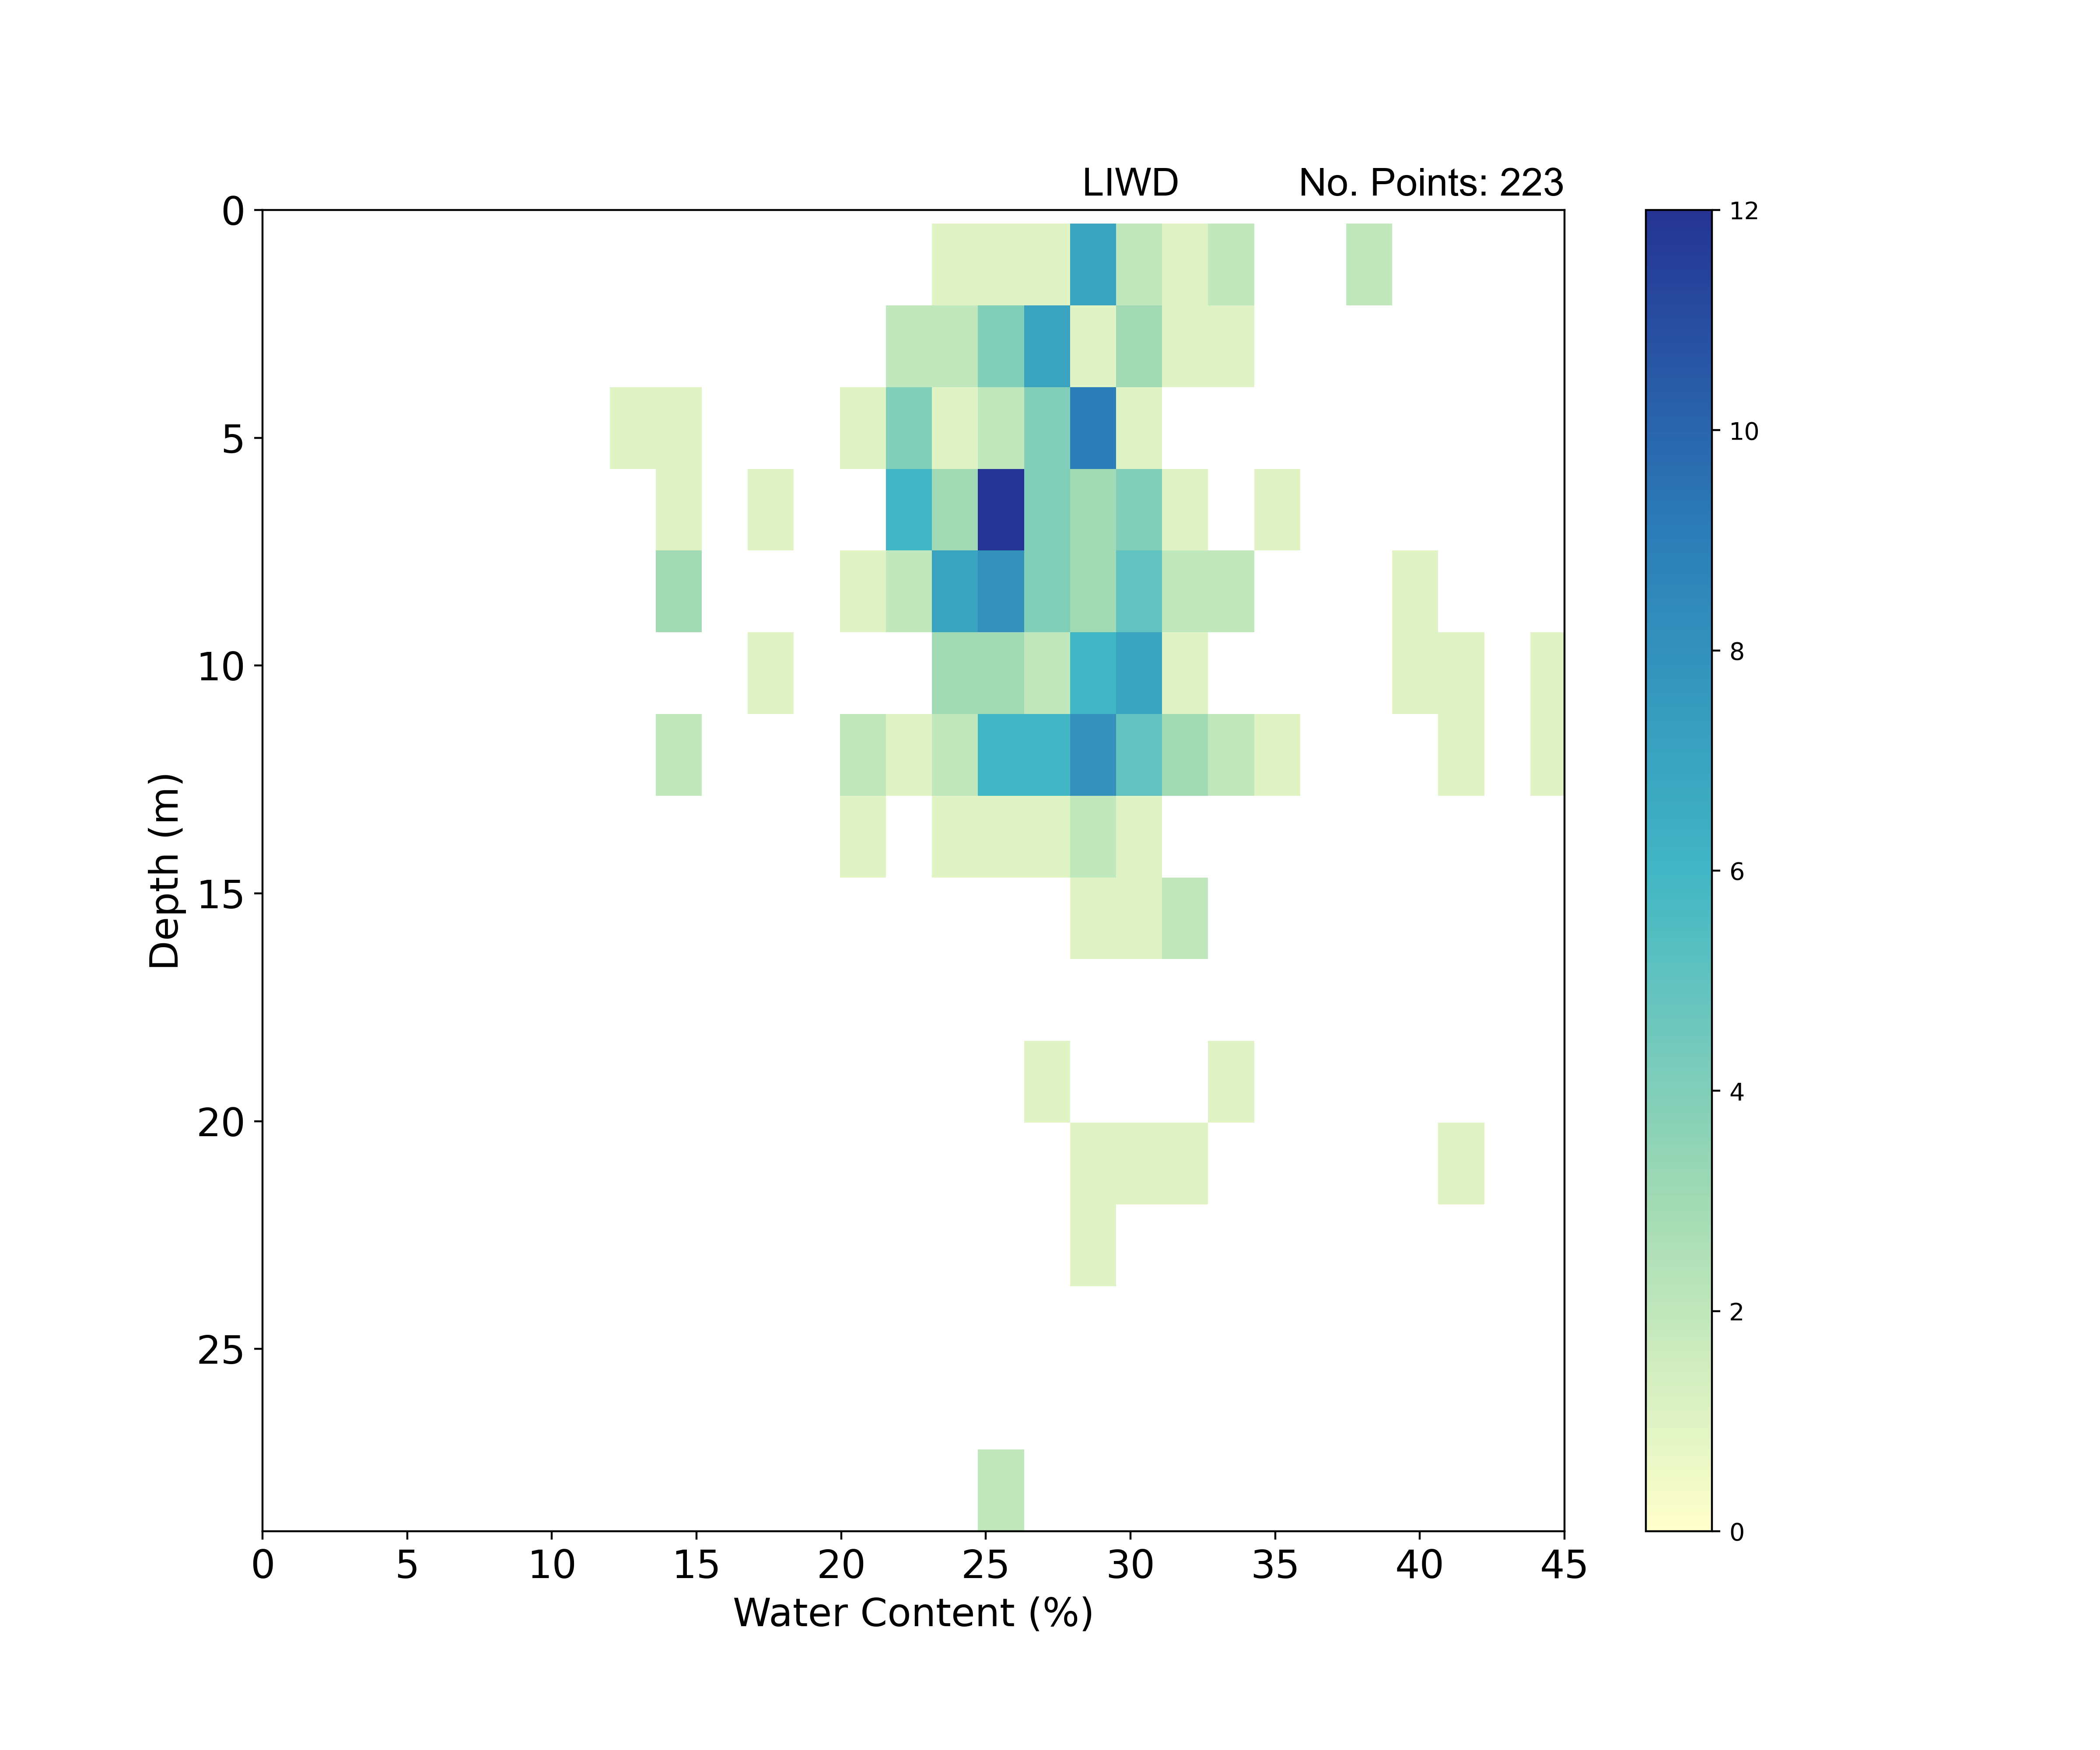
Geotechnical properties: classification tests
2D histogram plot summarising water content with depth. BGS © UKRI.
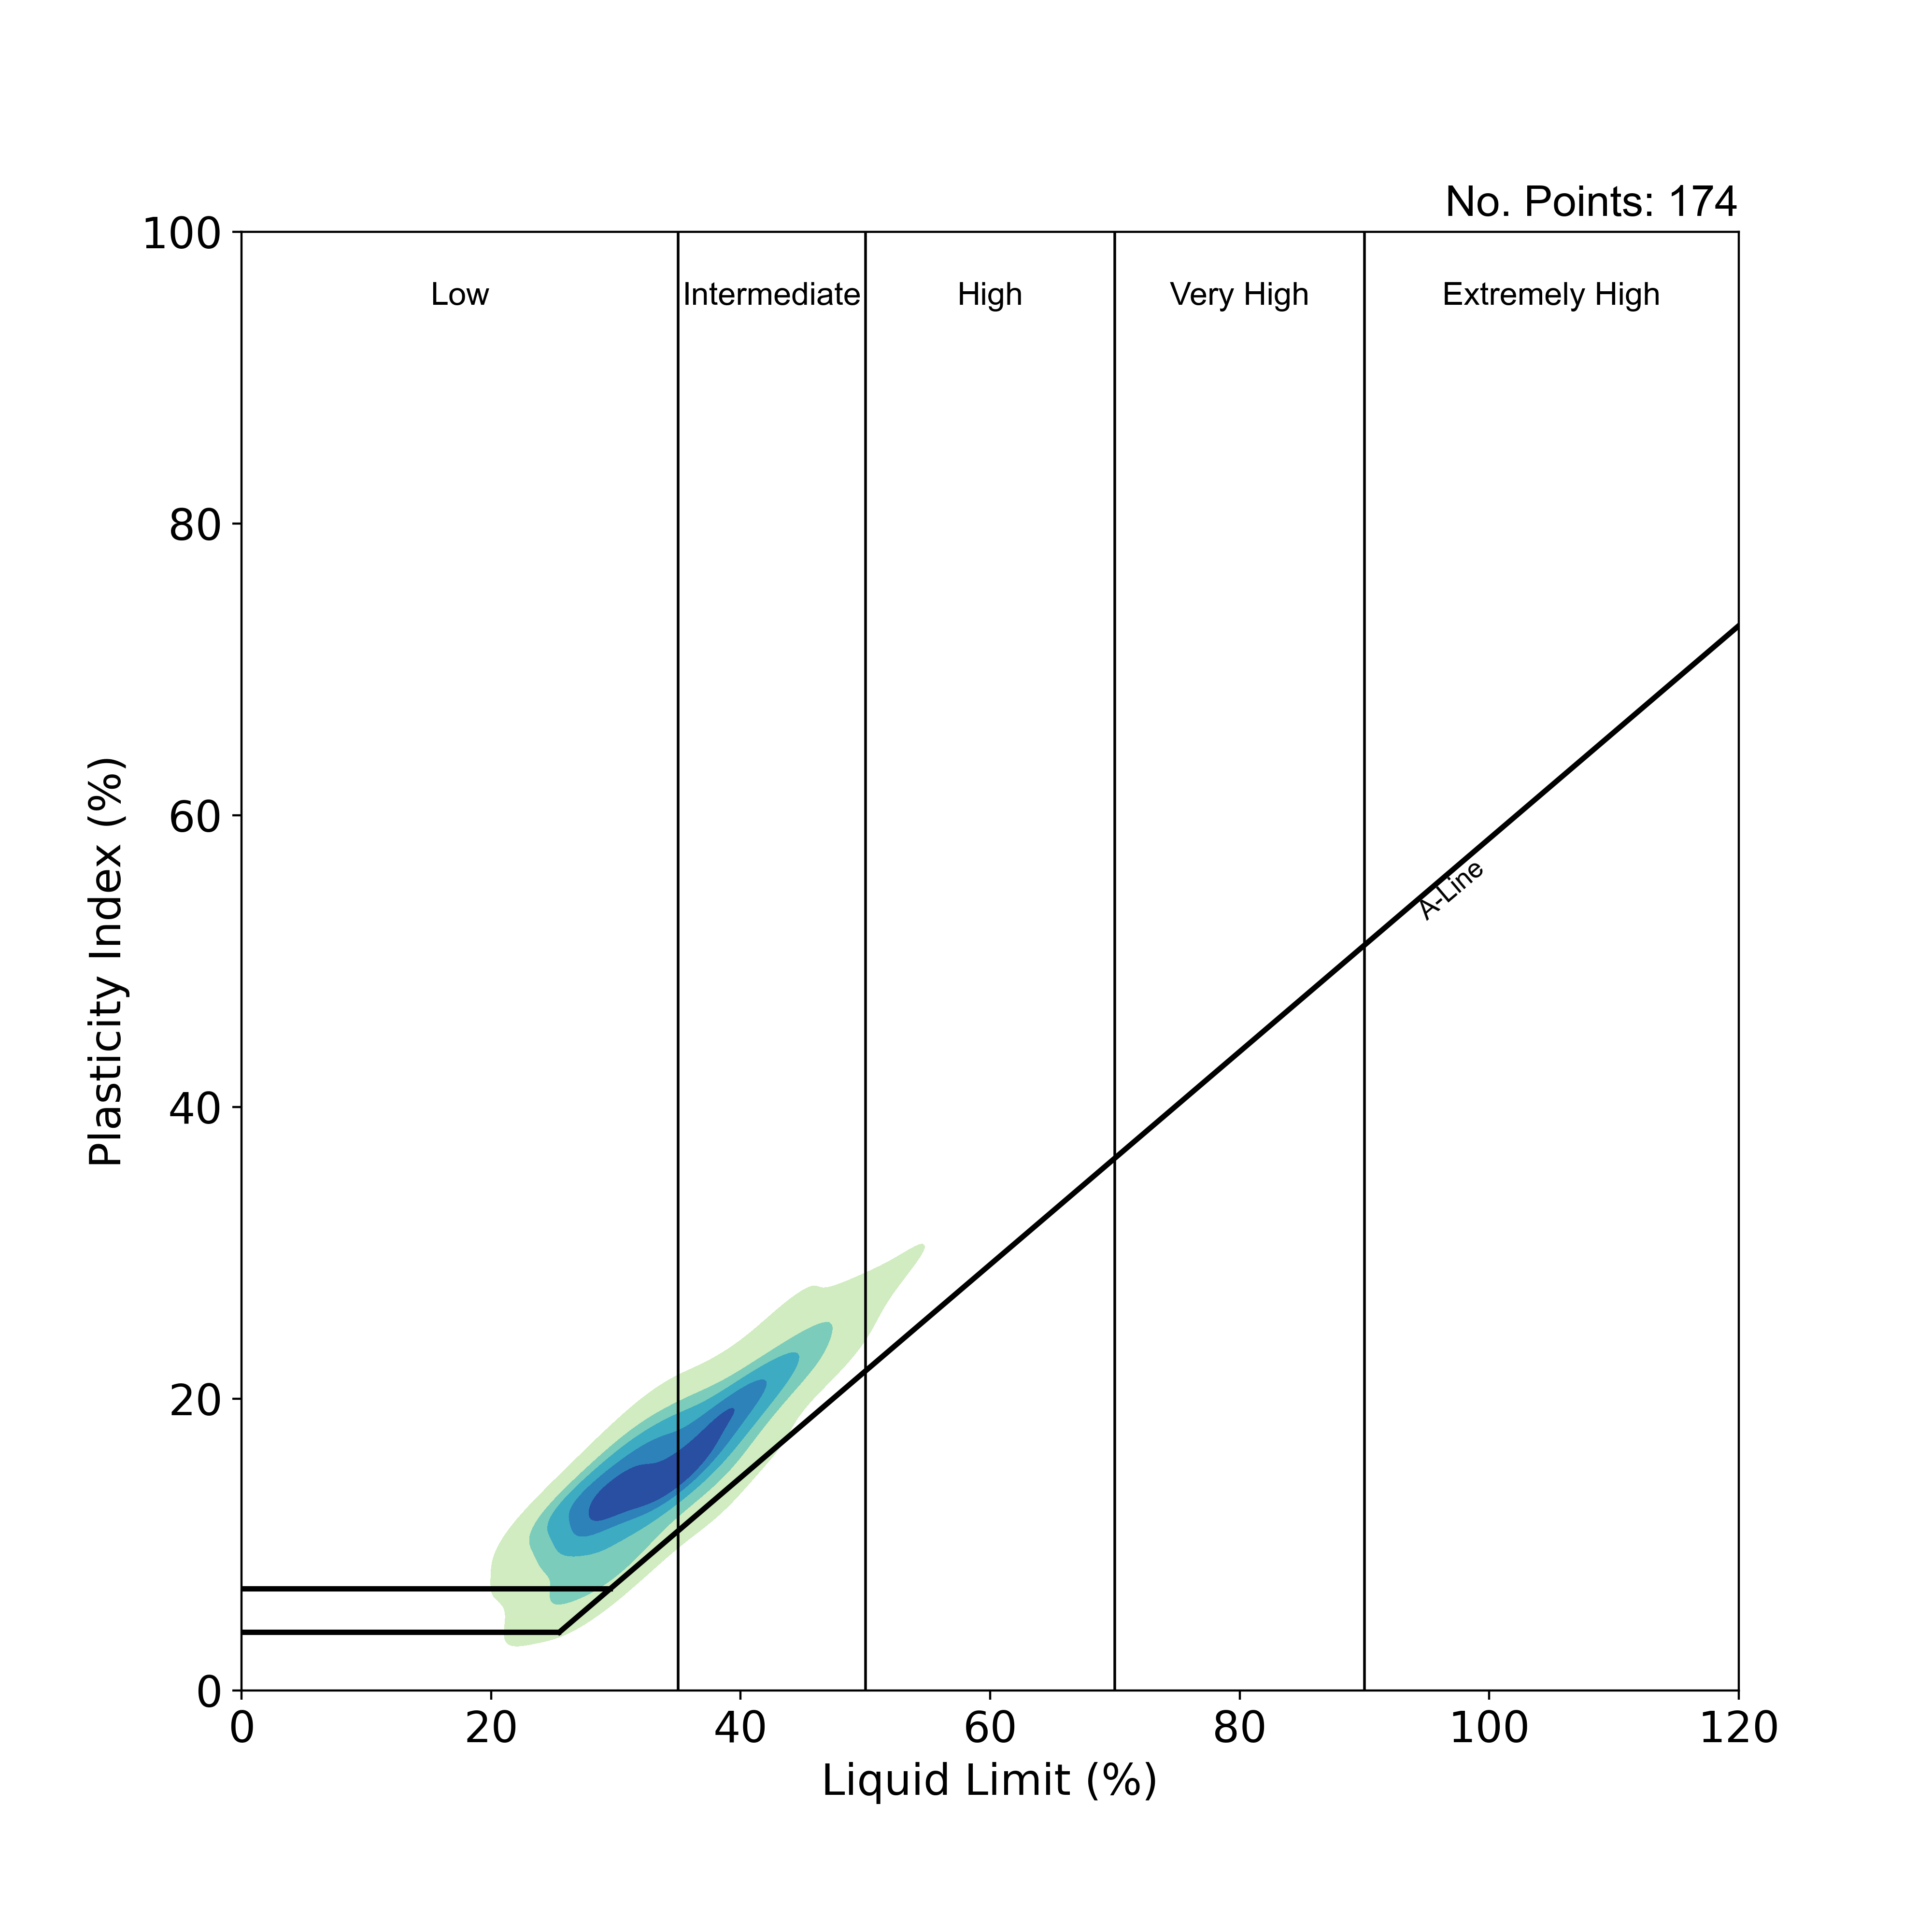
Geotechnical properties: classification tests
Casagrande plasticity plot summarising the distribution of plasticity results with a 2D kernel density estimation. Each colour represents a region of equal probability density (about 20 per cent for each area), with the darker colours representing higher values for probability density. BGS © UKRI.
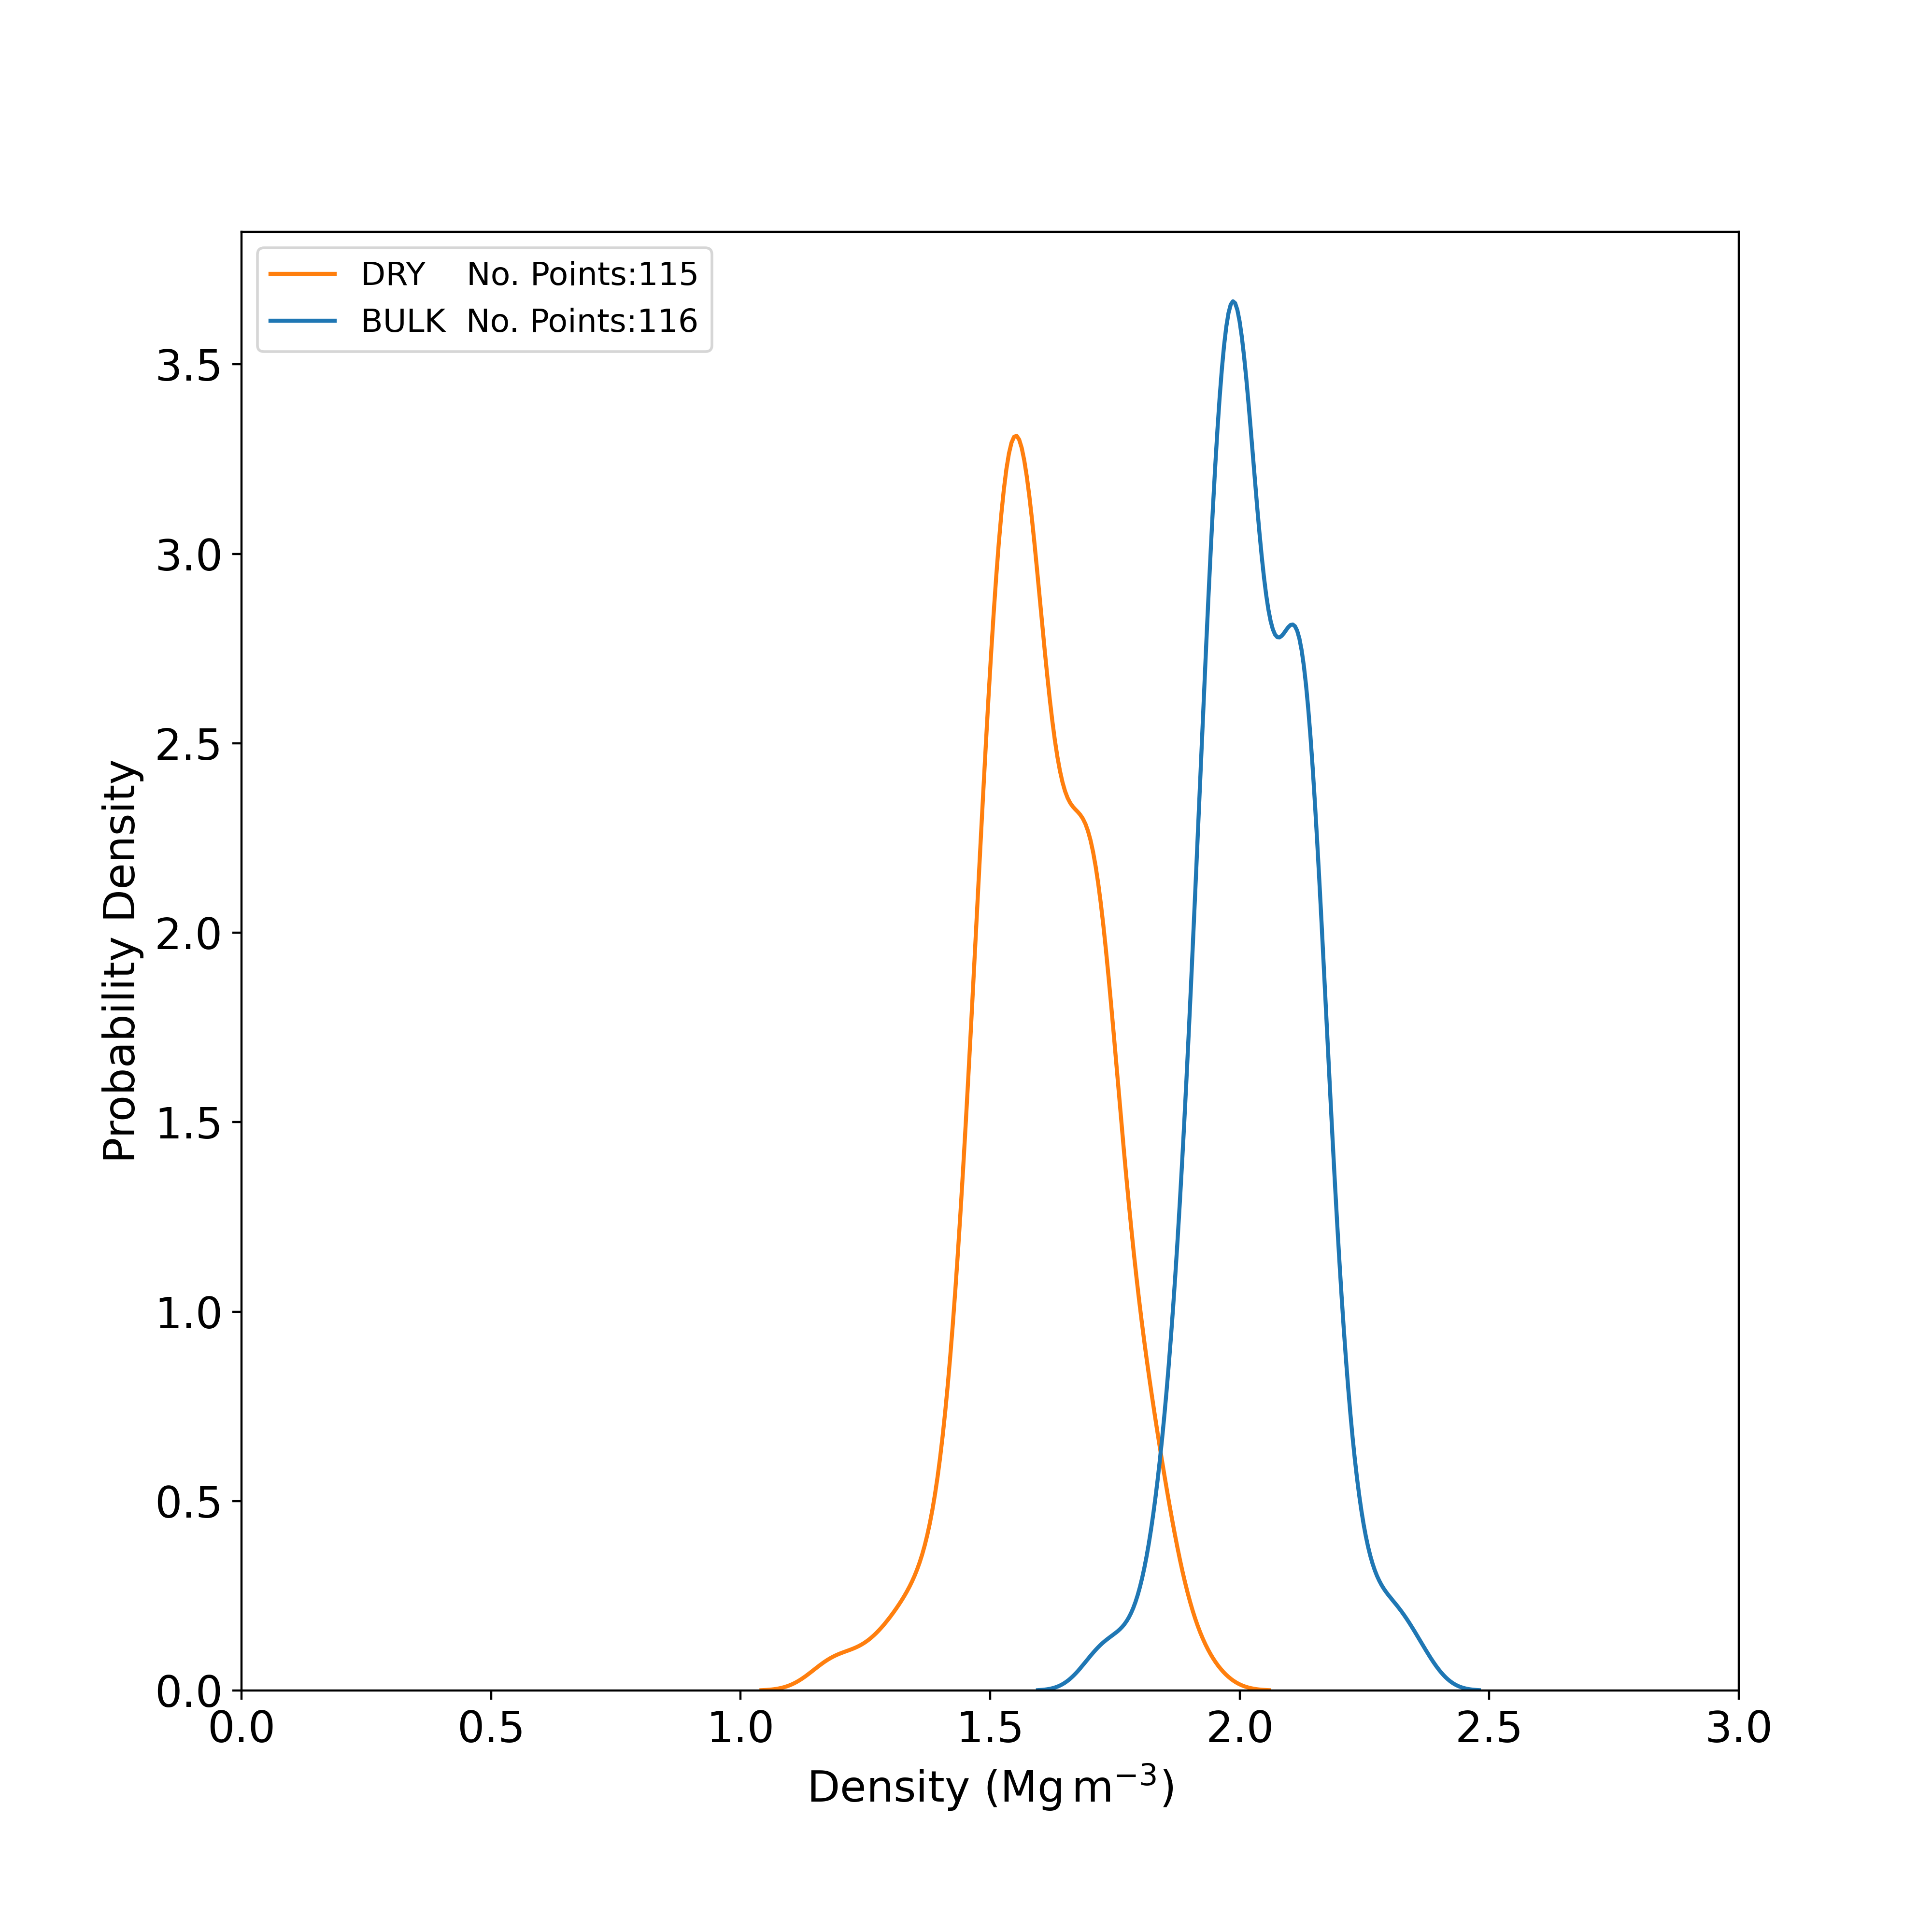
Geotechnical properties: classification tests
Kernel density plot showing the distribution of bulk density and dry density results obtained from laboratory tests. BGS © UKRI.
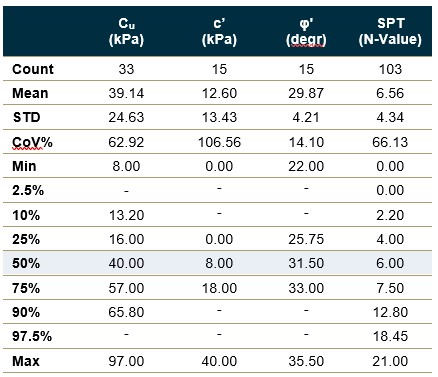
Geotechnical properties: strength tests
Statistical summaries of geotechnical strength properties from laboratory and in situ tests. STD – standard deviation; CoV% – coefficient of variation; Cu – undrained shear strength obtained from unconsolidated undrained triaxial tests; c’ – effective cohesion obtained from consolidated undrained triaxial tests with pore pressure measurements and consolidated drained triaxial tests; φ’ – effective internal friction angle obtained from consolidated undrained triaxial tests with pore pressure measurements and consolidated drained triaxial tests ; SPT – standard penetration test (number of tests with N-value > 50 or with no N-value = 3). Percentiles reported based on sample size; no summaries are provided where there are fewer than 5 samples. BGS © UKRI
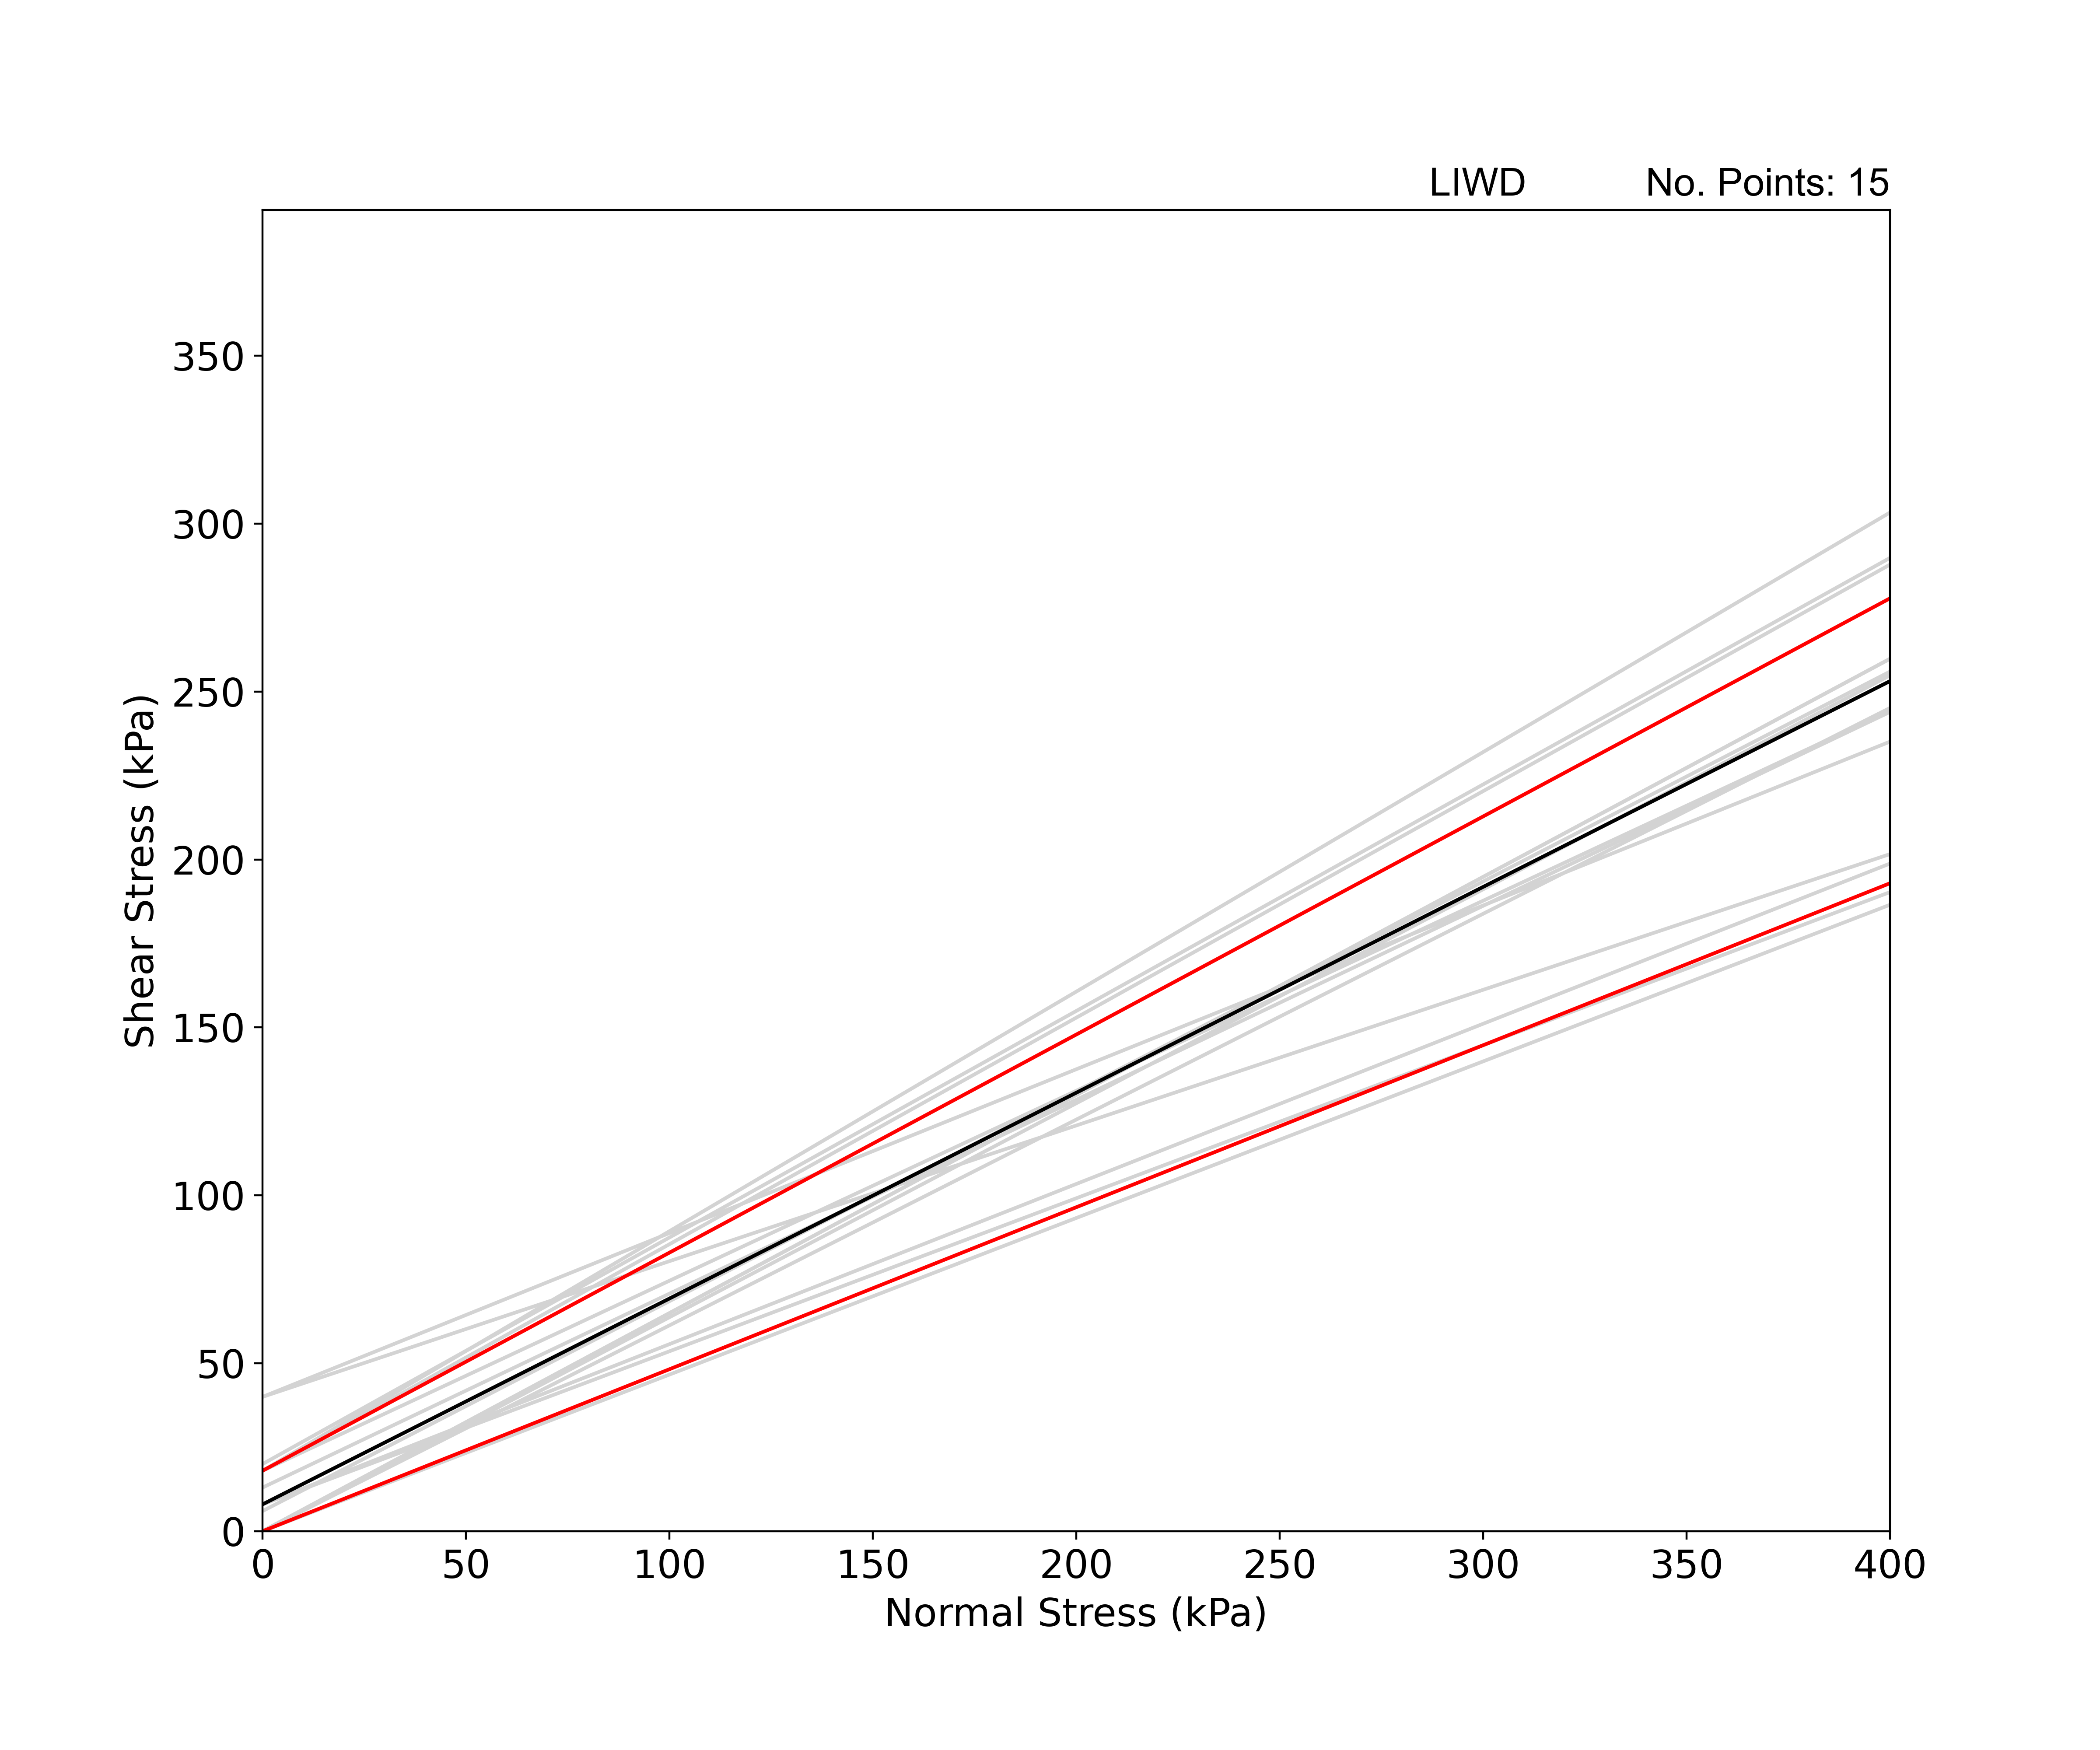
Geotechnical properties: strength tests
Mohr-Coulomb failure plot showing individual failure envelopes (light grey), median failure envelope (black) and 25th and 75th percentile failure envelopes (red) based on effective cohesion and phi values obtained from consolidated drained triaxial tests and consolidated undrained triaxial tests with pore pressure measurements. BGS © UKRI.
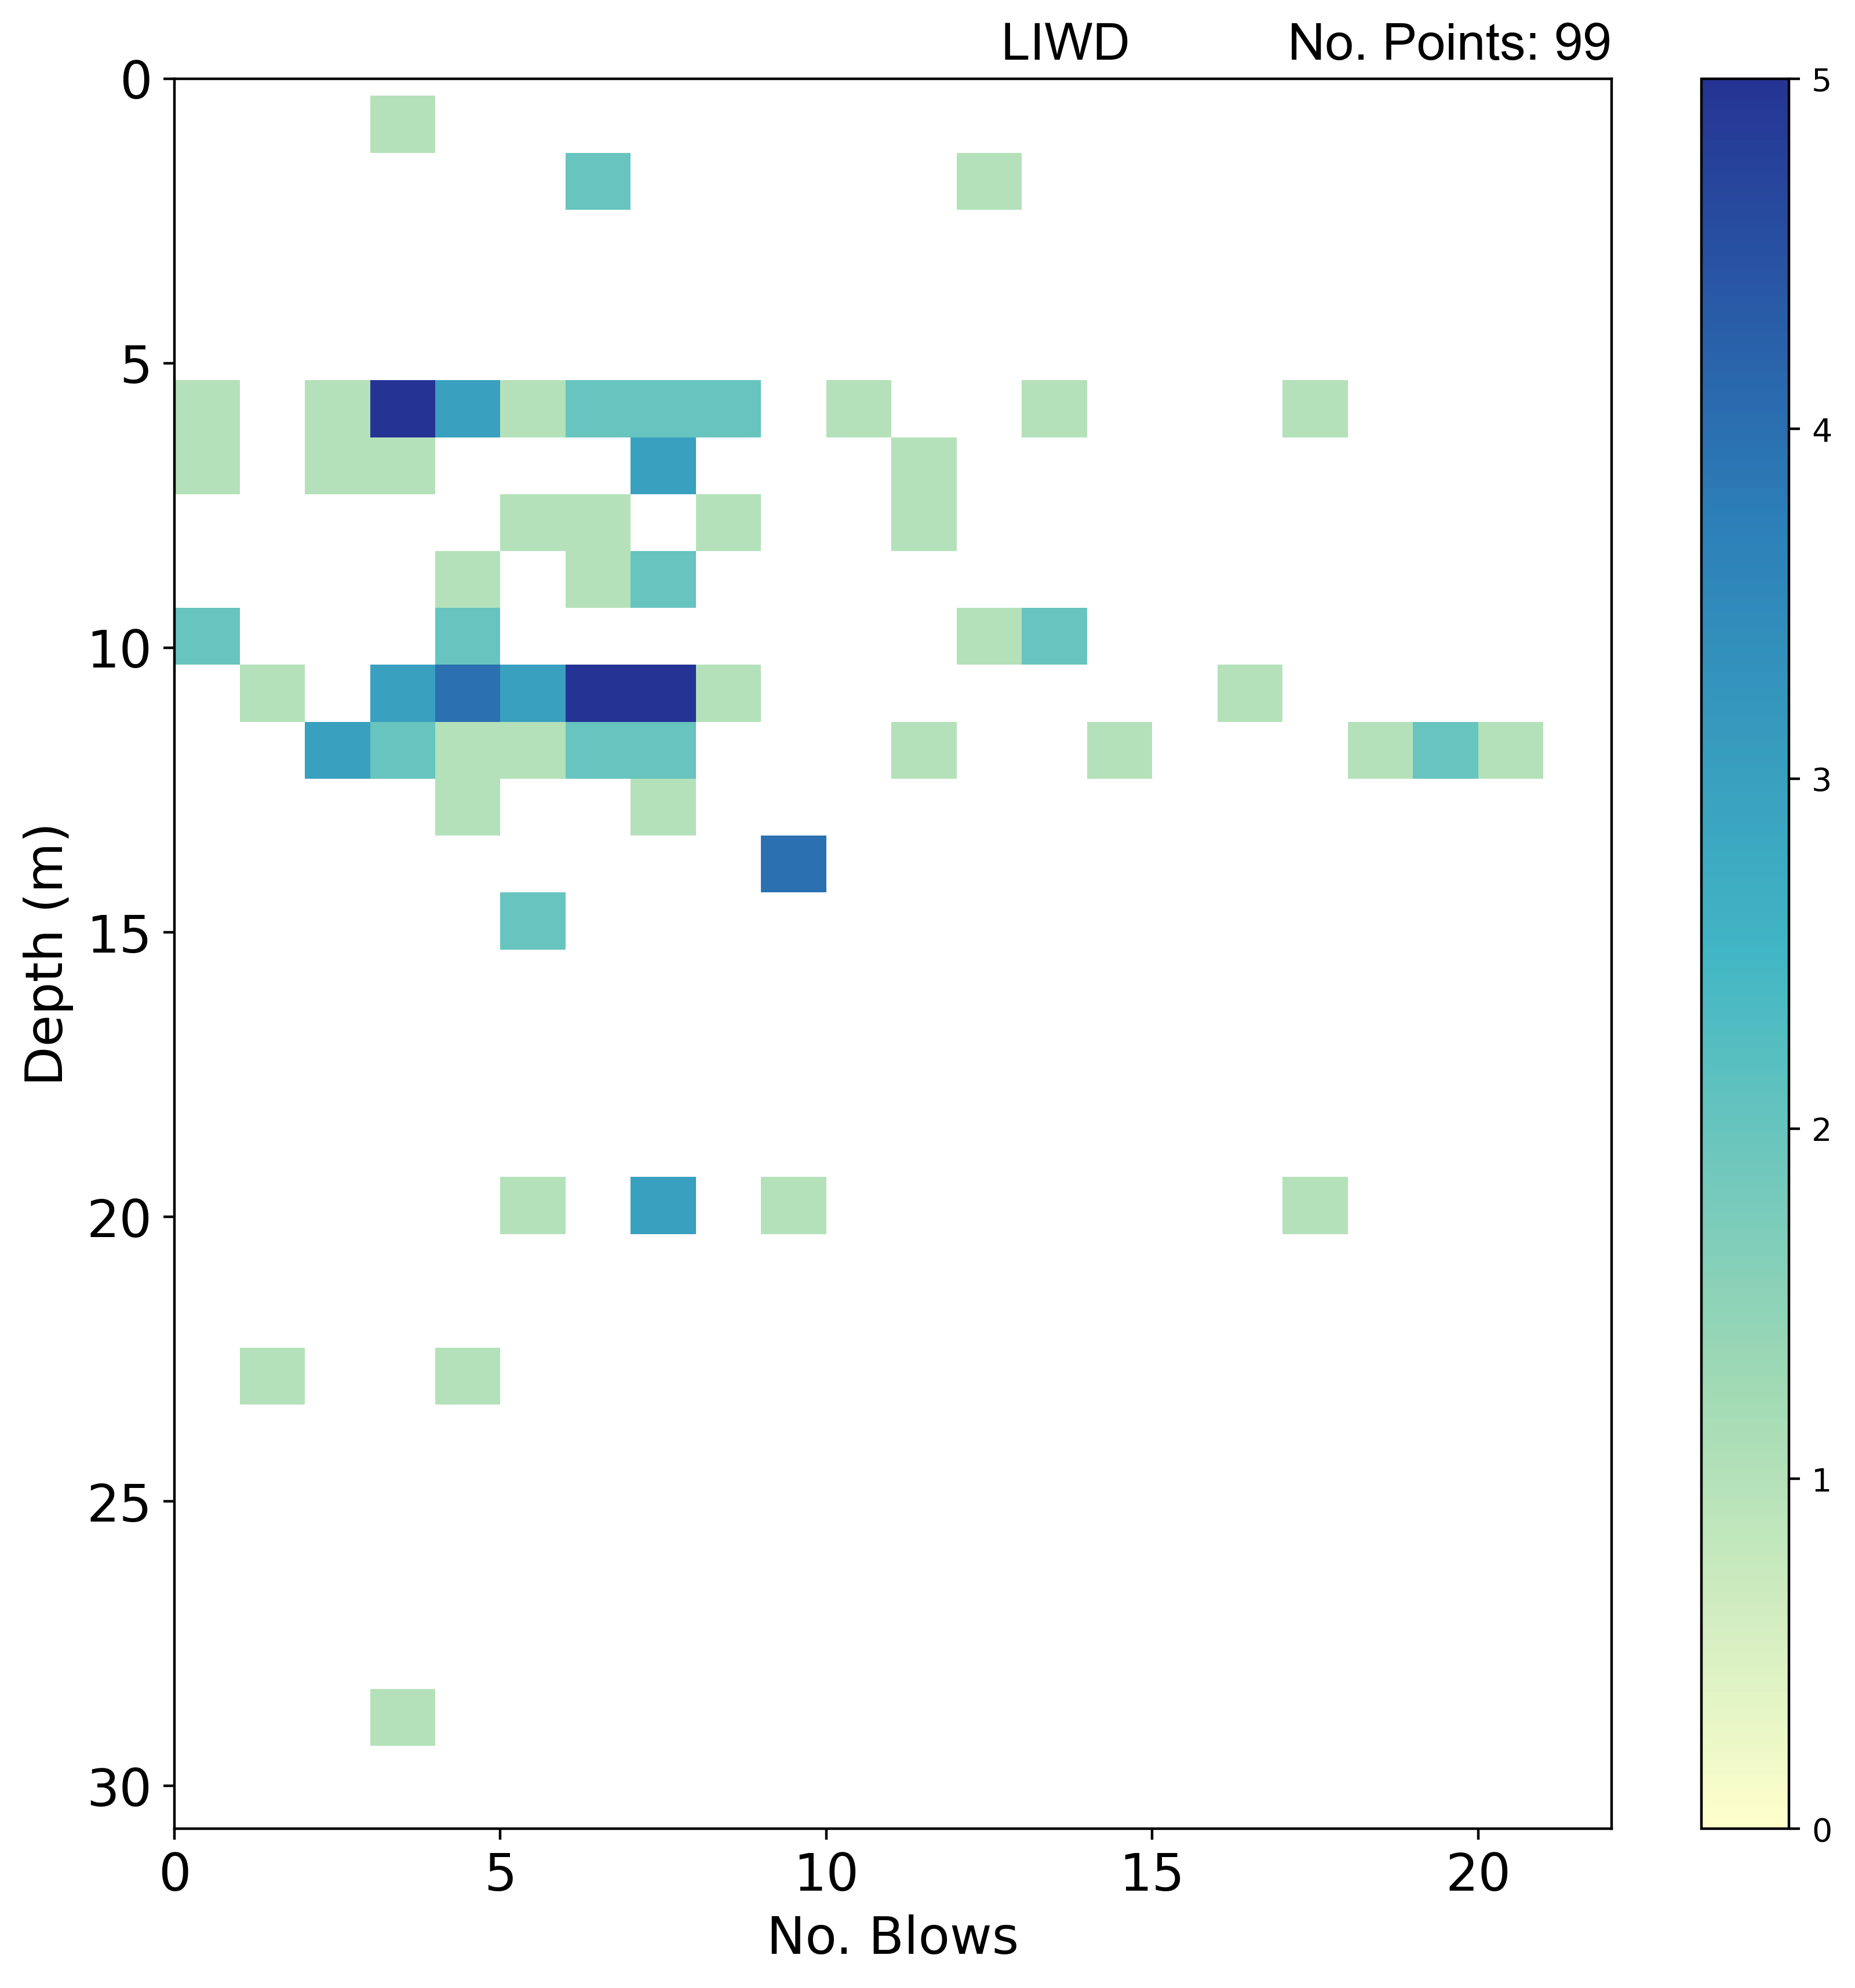
Geotechnical properties: strength tests
2D histogram summarising SPT N-value results with depth. Number of tests with N-value > 50 or with no N-value = 3. BGS © UKR
Paisley Clay Member (PAIS)
Geological descriptions
Pie chart summarising the dominant soil types (primary and secondary constituents) described in exploratory hole logs based on total metres logged. Descriptions have been simplified to remove tertiary constituents and a threshold of 1 per cent applied to aid graphical presentation. Soil types representing less than 1 per cent of the total logged are included in the ‘other’ category. BGS © UKRI.
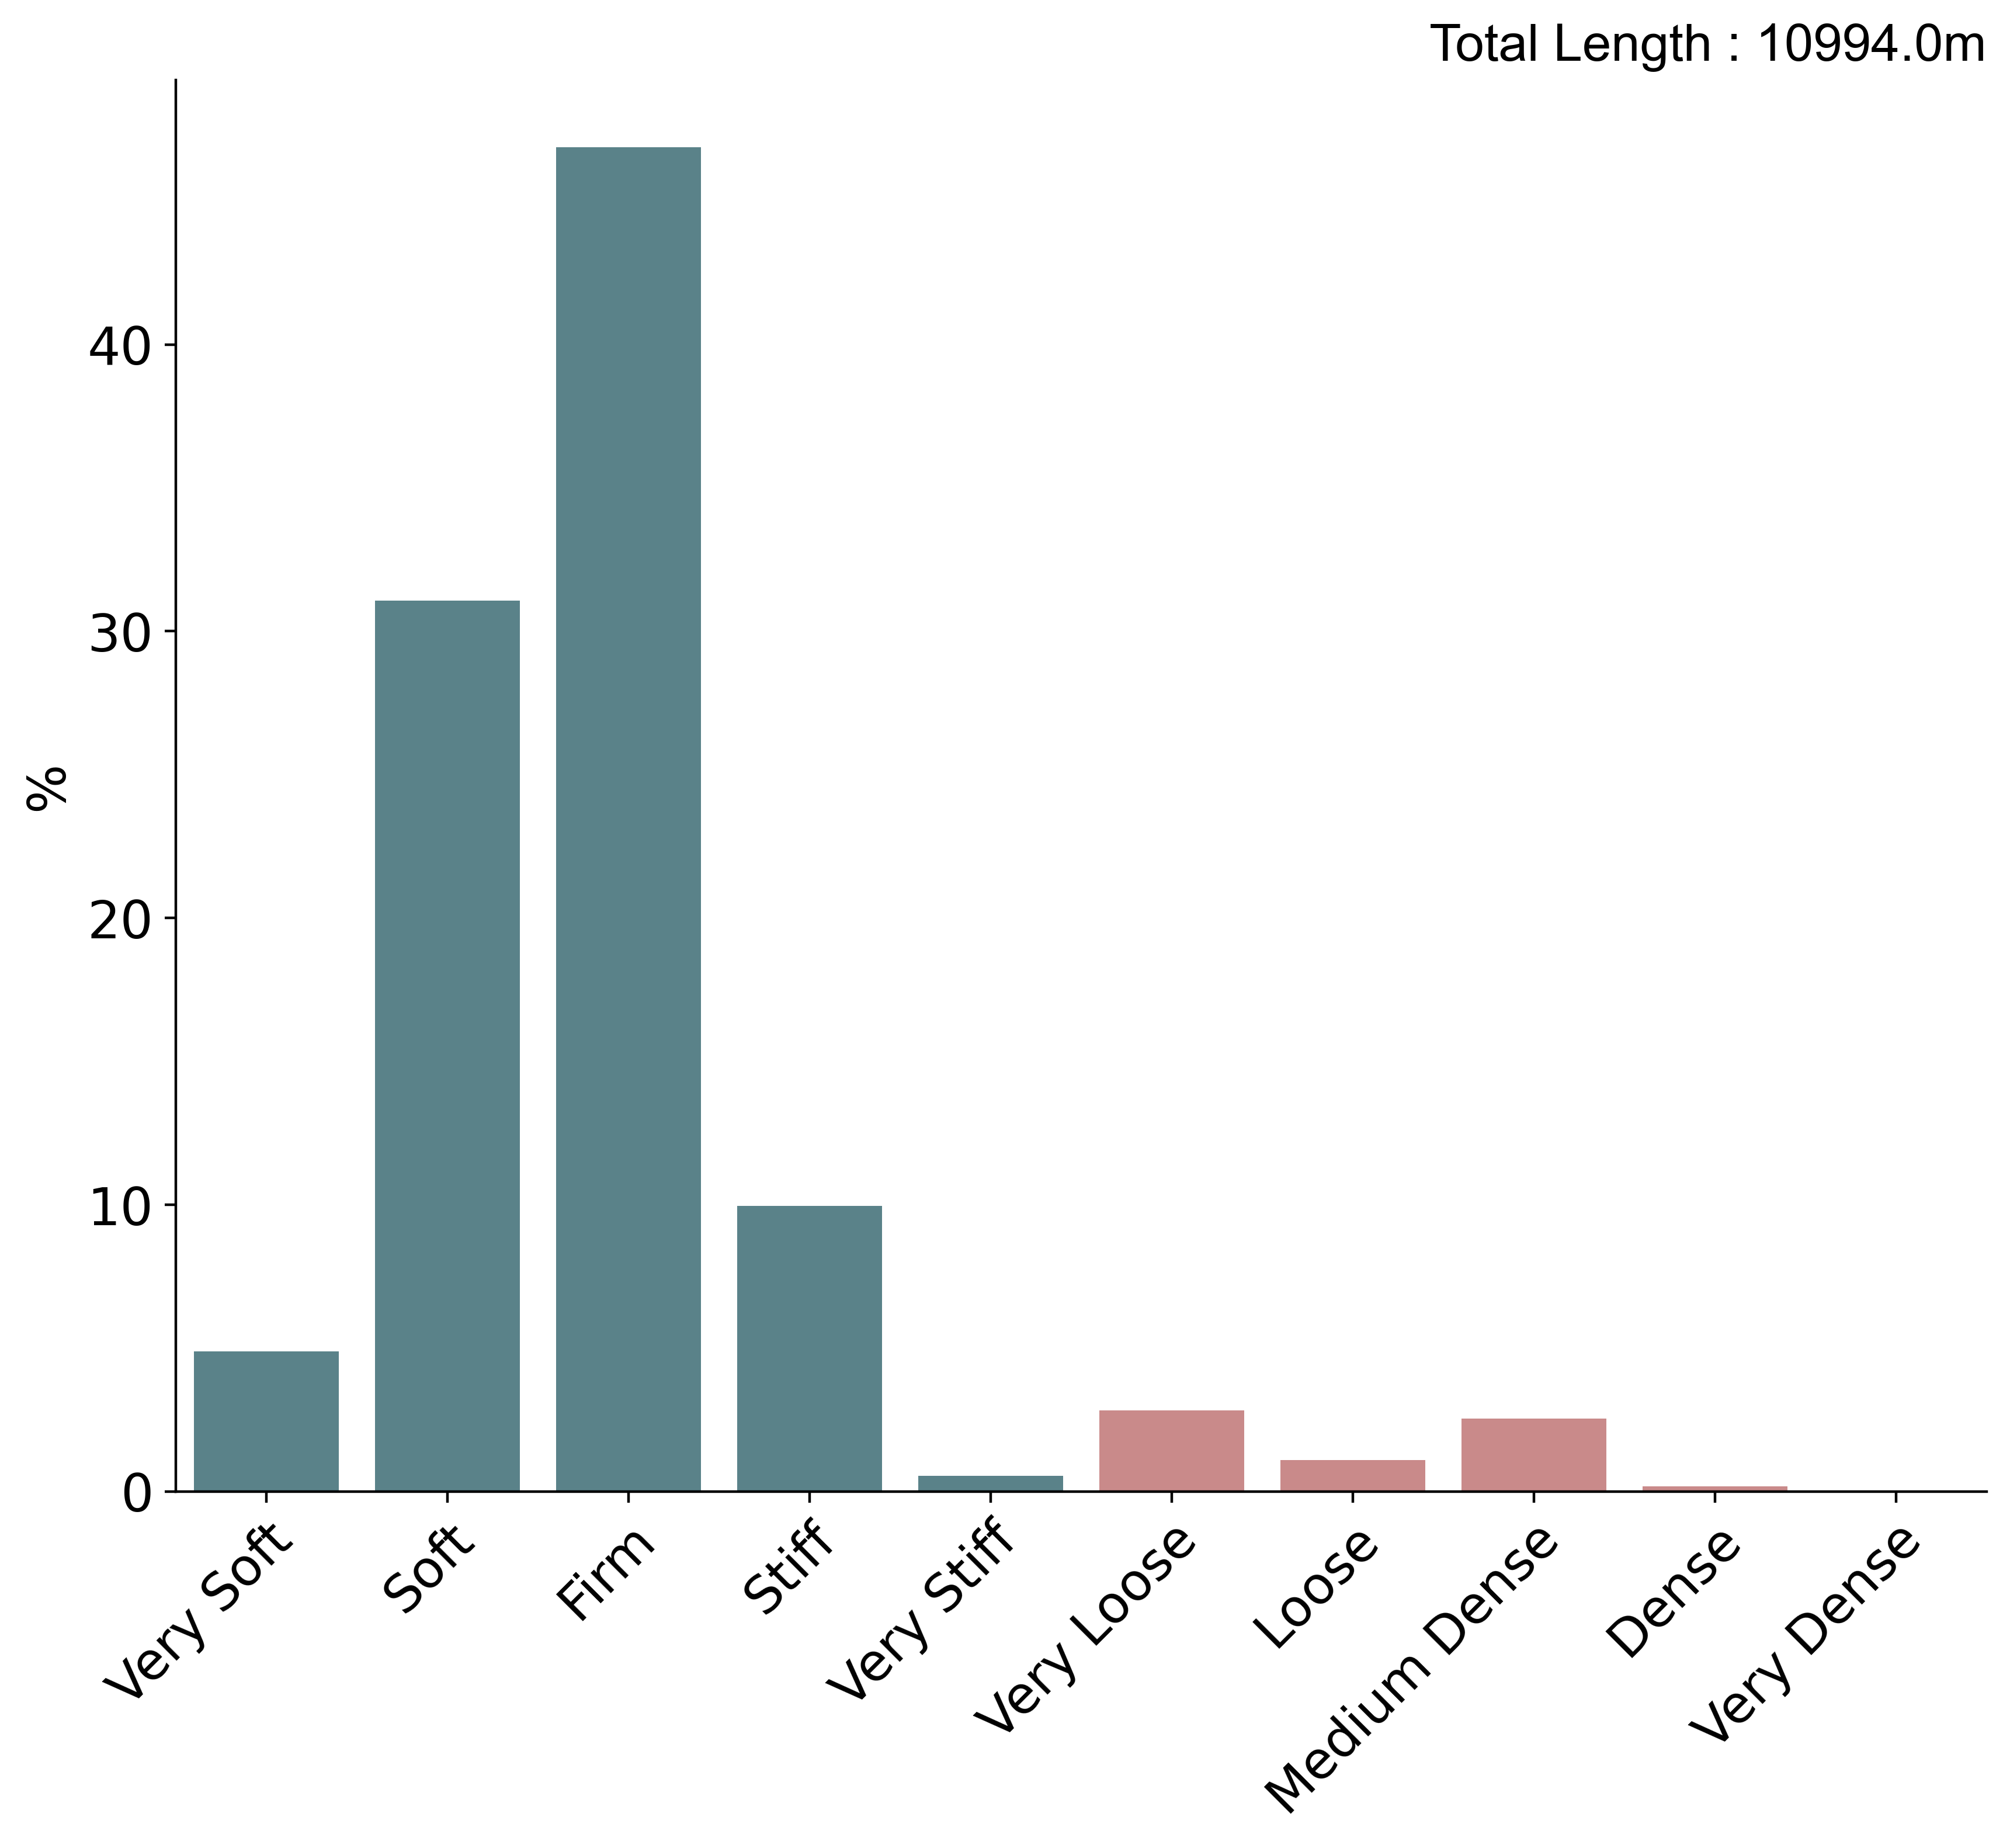
Geological descriptions
Histogram summarising the consistency and relative density described in exploratory hole logs based on total metres logged. BGS © UKRI.
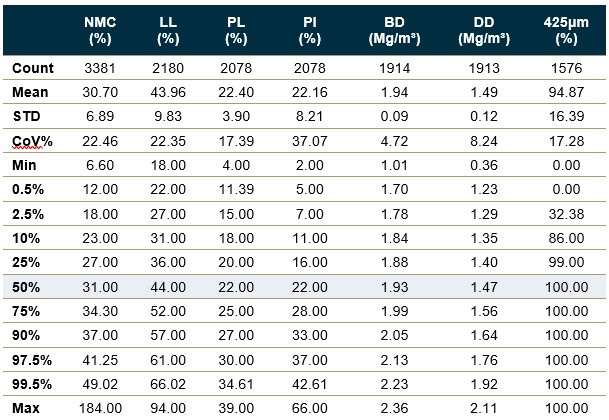
Geotechnical properties: classification tests
Statistical summaries of geotechnical index properties from laboratory tests. STD – standard deviation; CoV% – coefficient of variation; NMC – natural moisture content; LL – liquid limit; PL – plastic limit; PI – plasticity index; BD – bulk density; DD – dry density425 μm – percentage of sample by mass passing 425 μm sieve. Percentiles reported based on sample size; no summaries are provided where there are fewer than 5 samples. BGS © UKRI
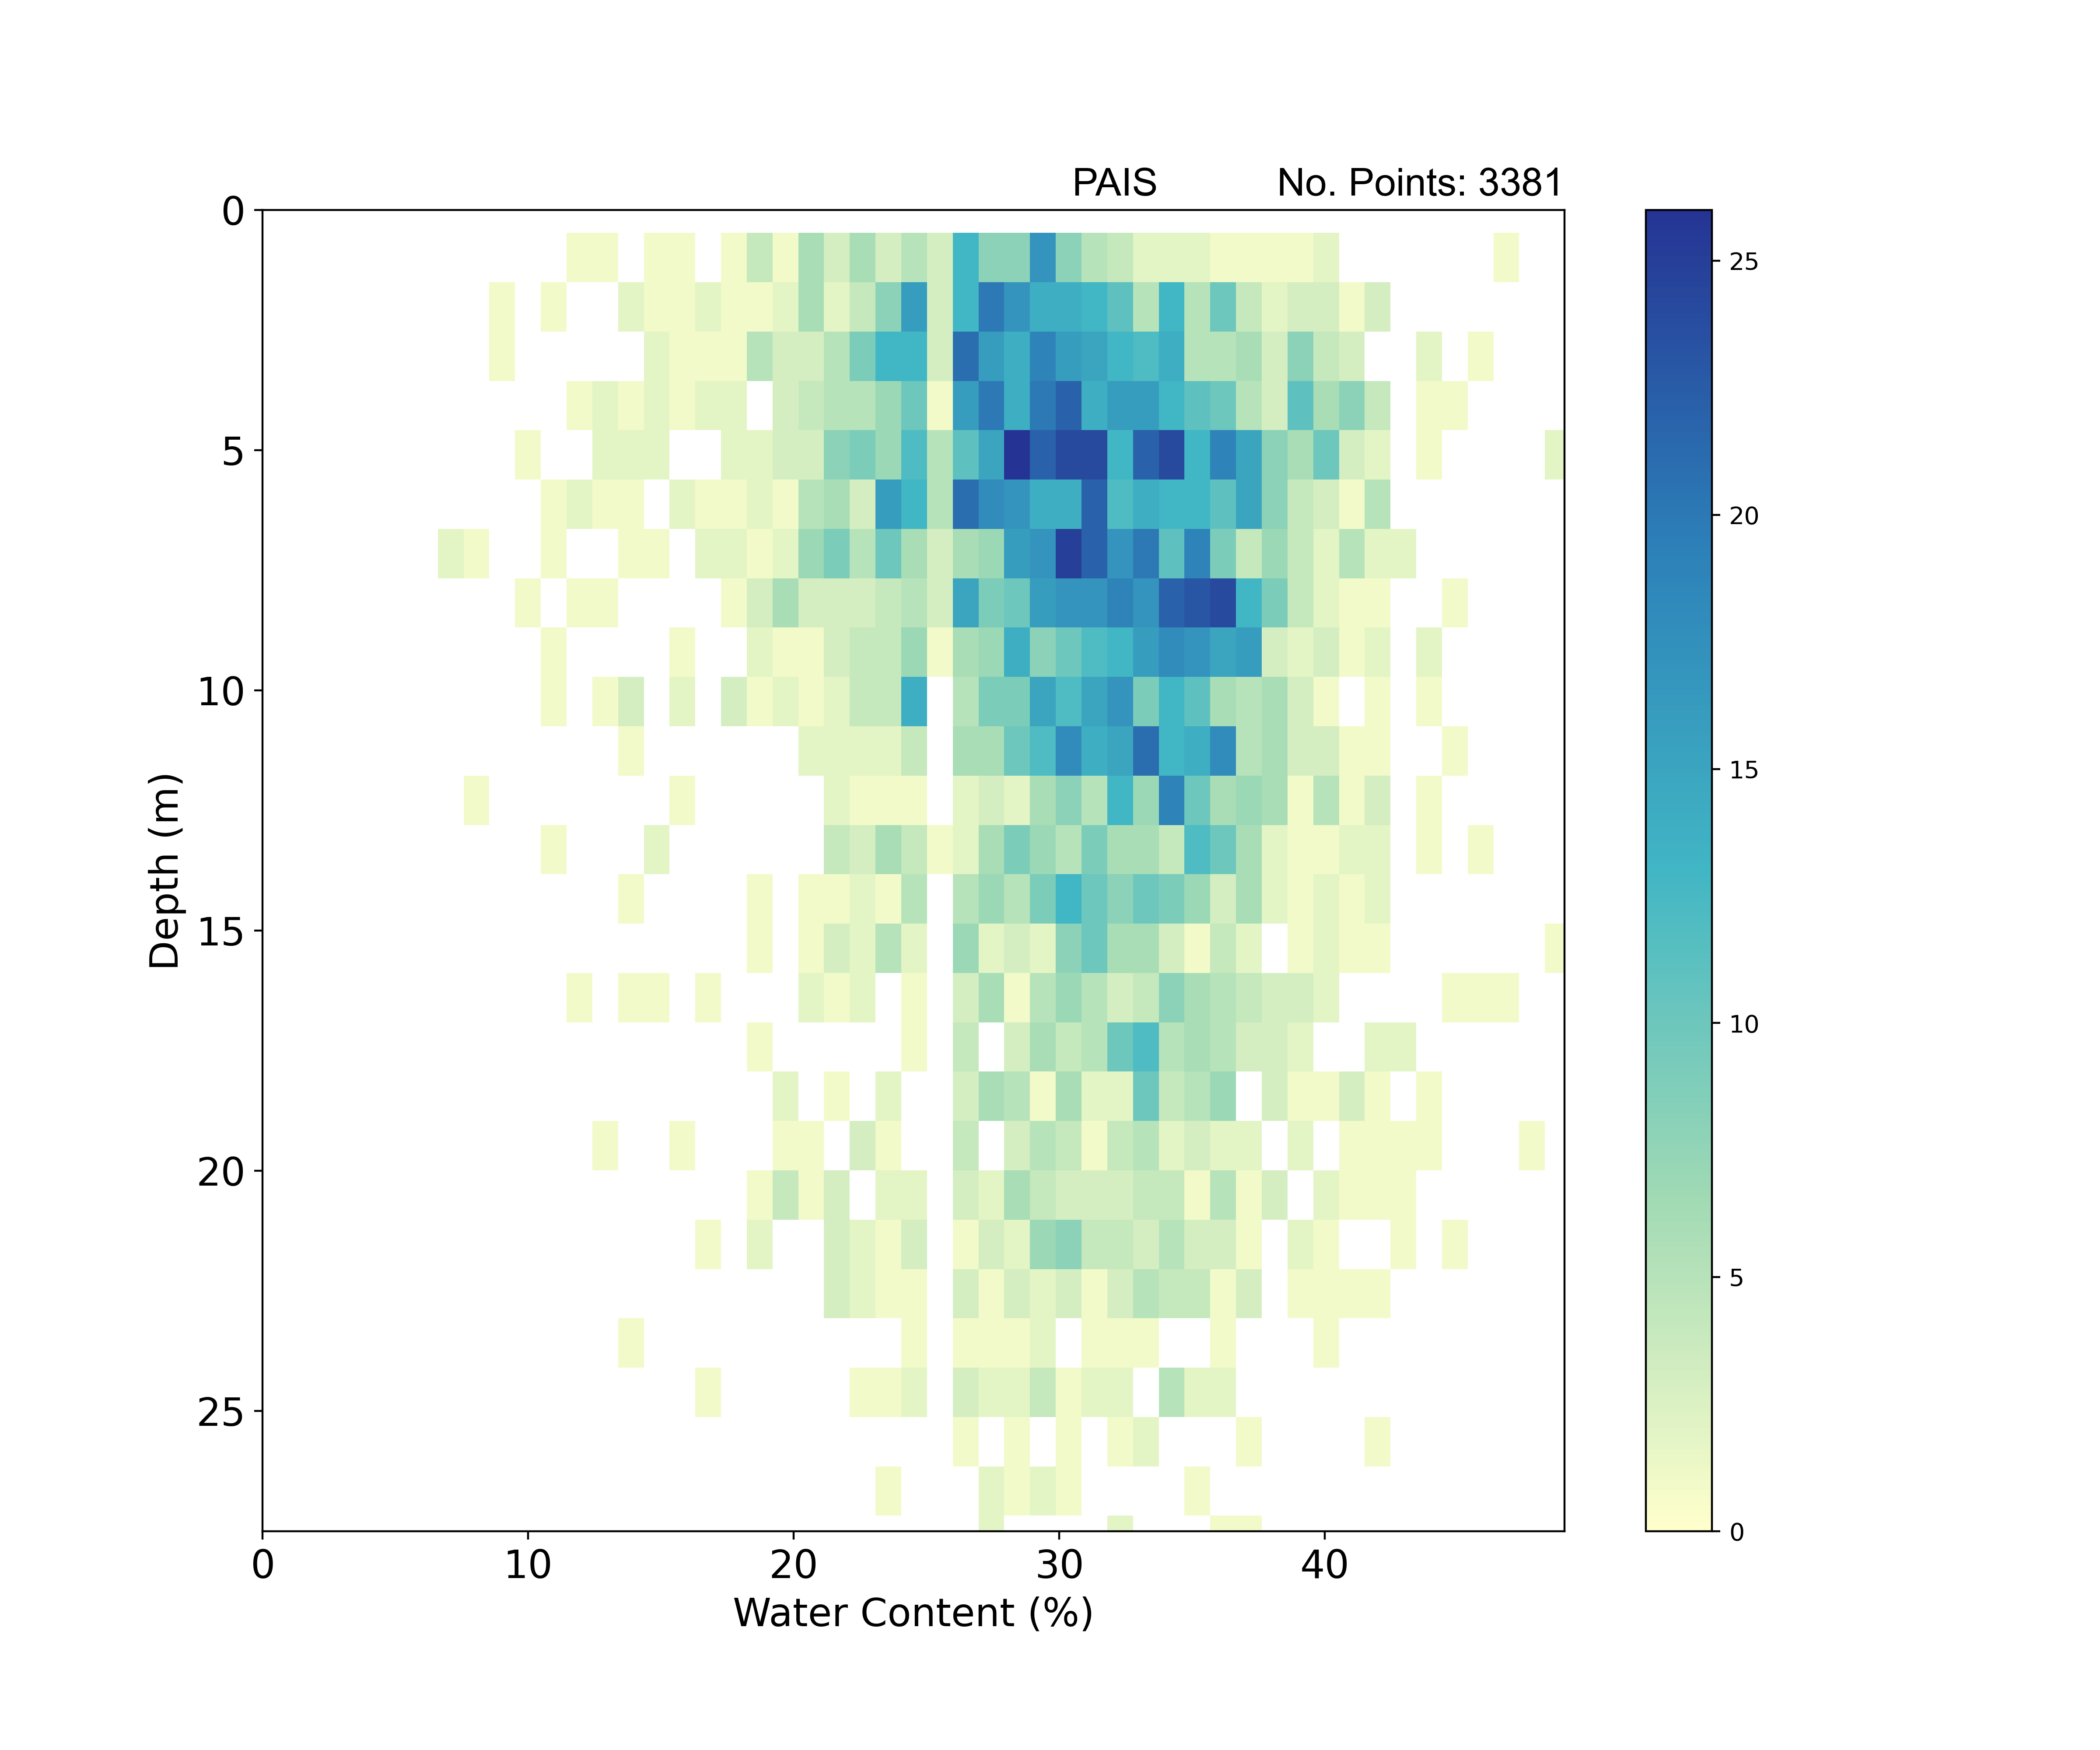
Geotechnical properties: classification tests
2D histogram plot summarising water content with depth. BGS © UKRI.
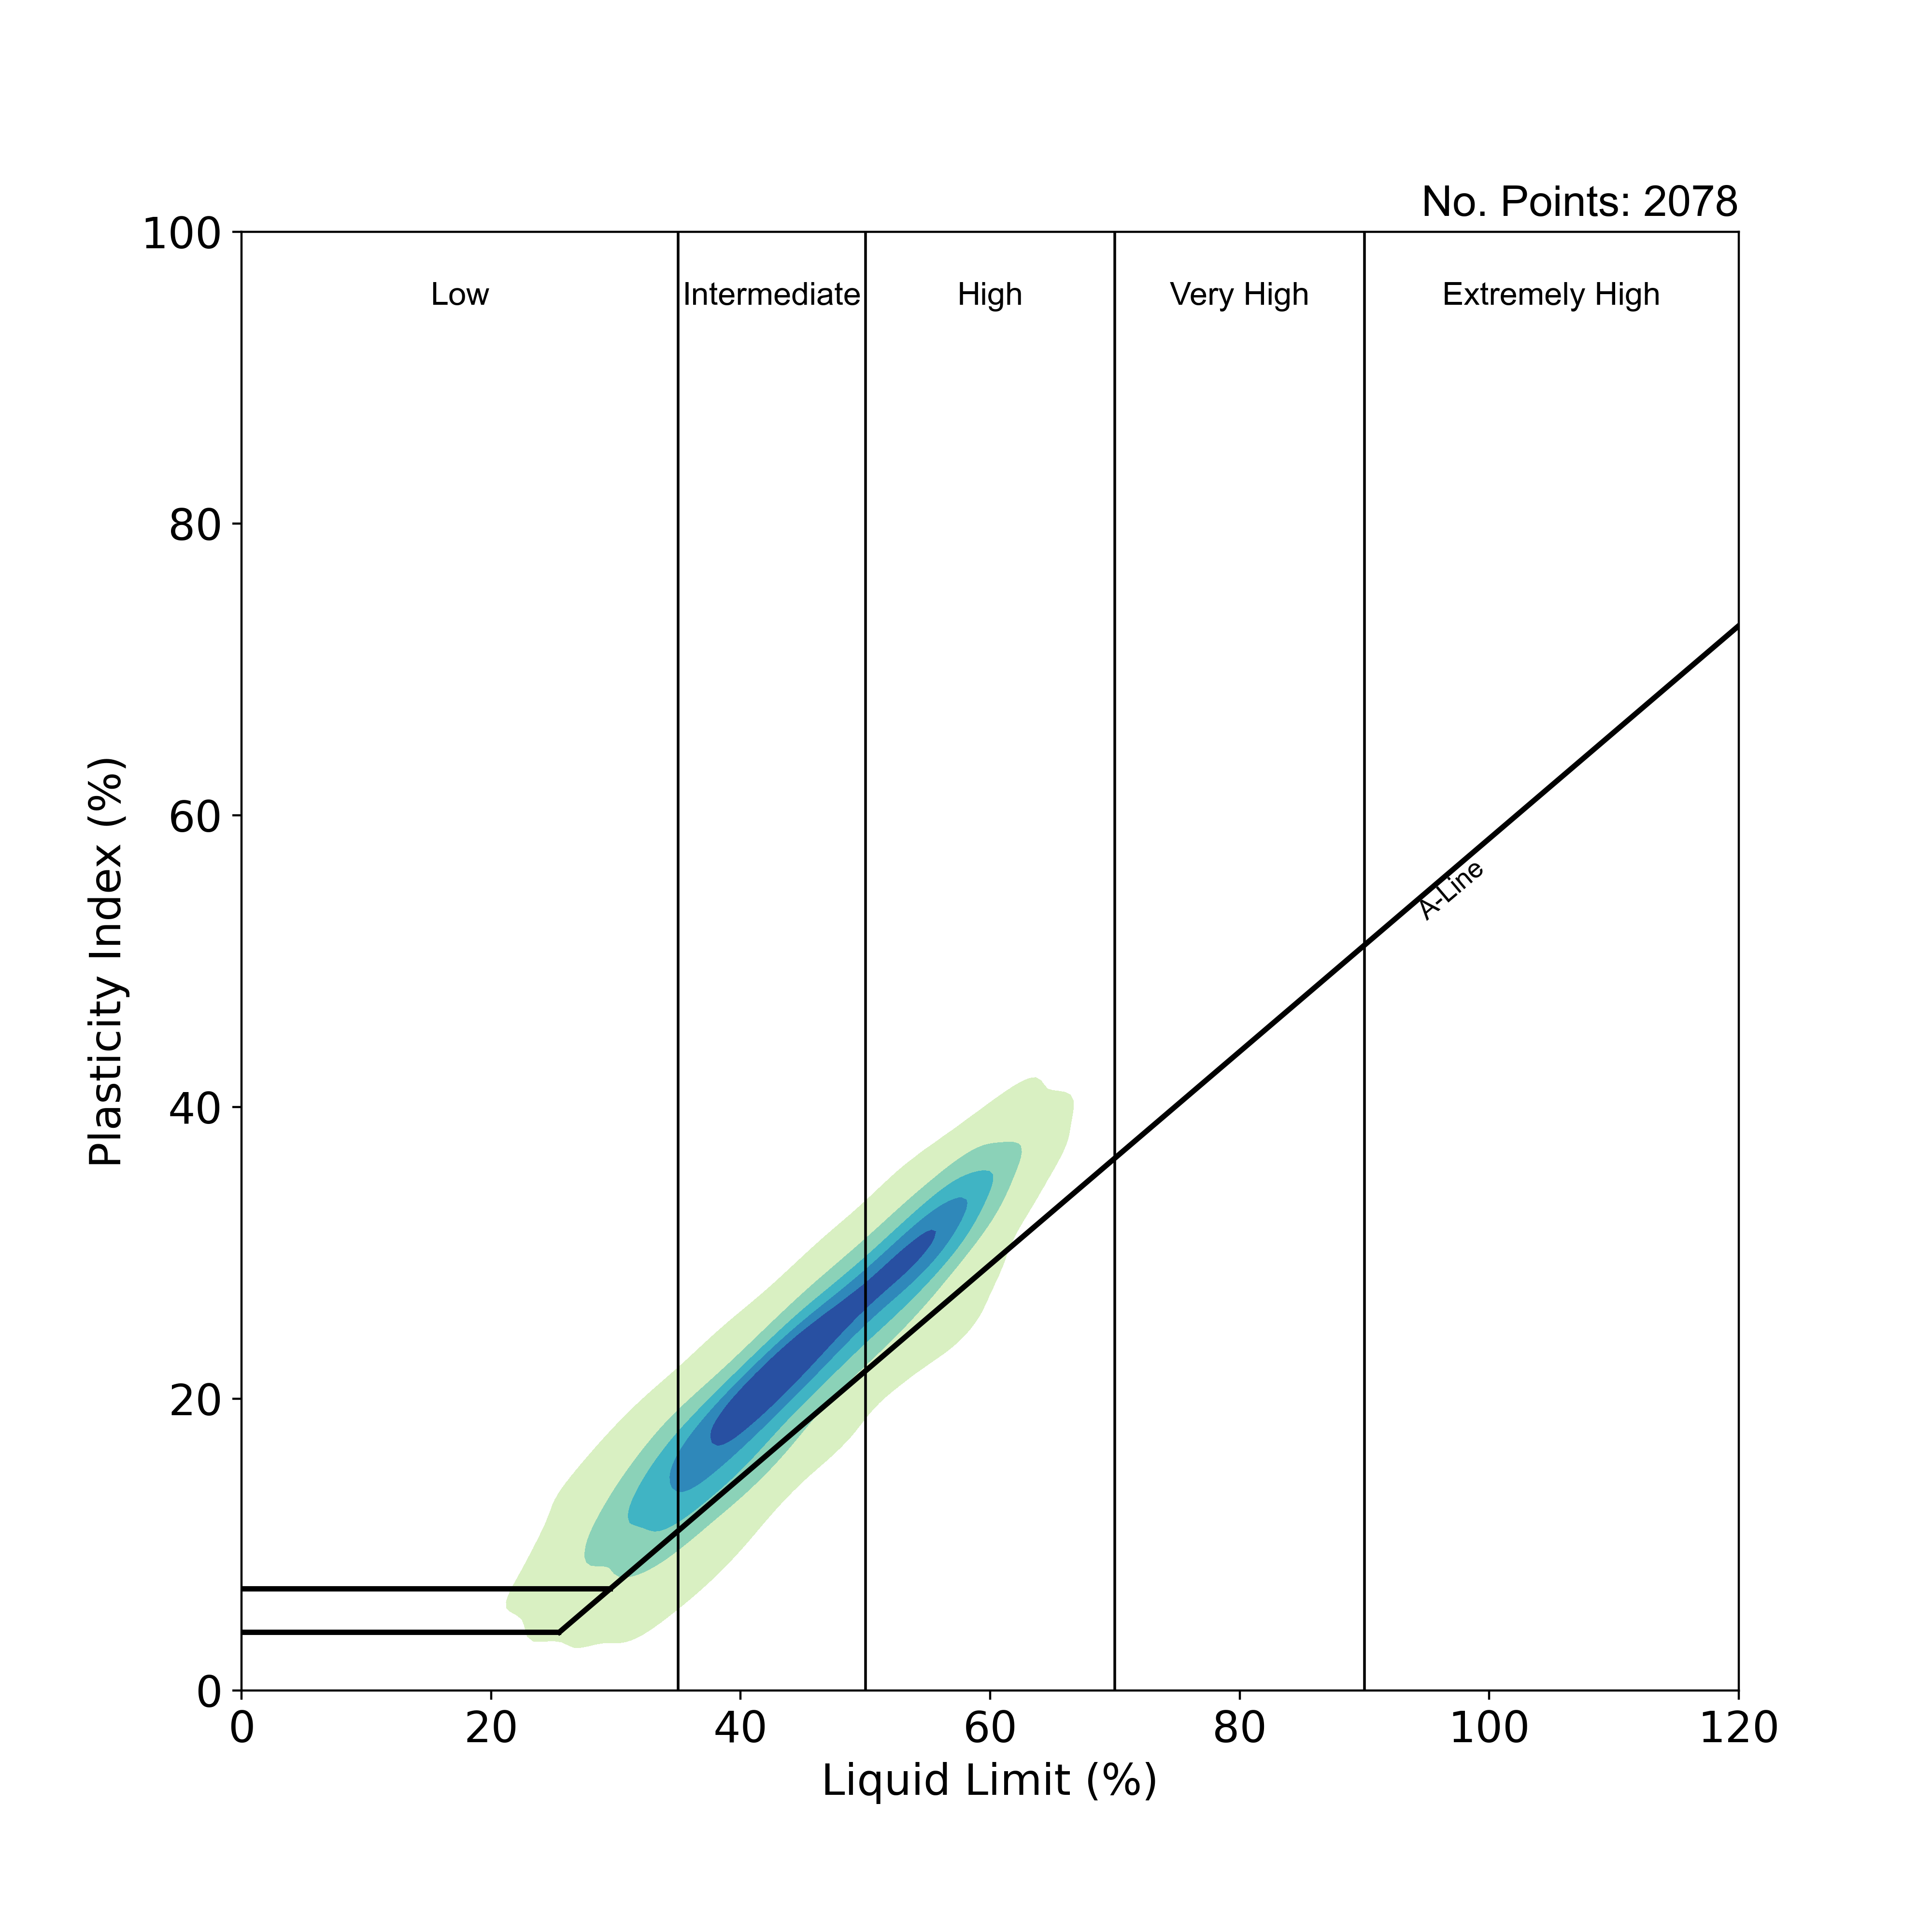
Geotechnical properties: classification tests
Casagrande plasticity plot summarising the distribution of plasticity results with a 2D kernel density estimation. Each colour represents a region of equal probability density (about 20 per cent for each area), with the darker colours representing higher values for probability density. BGS © UKRI.
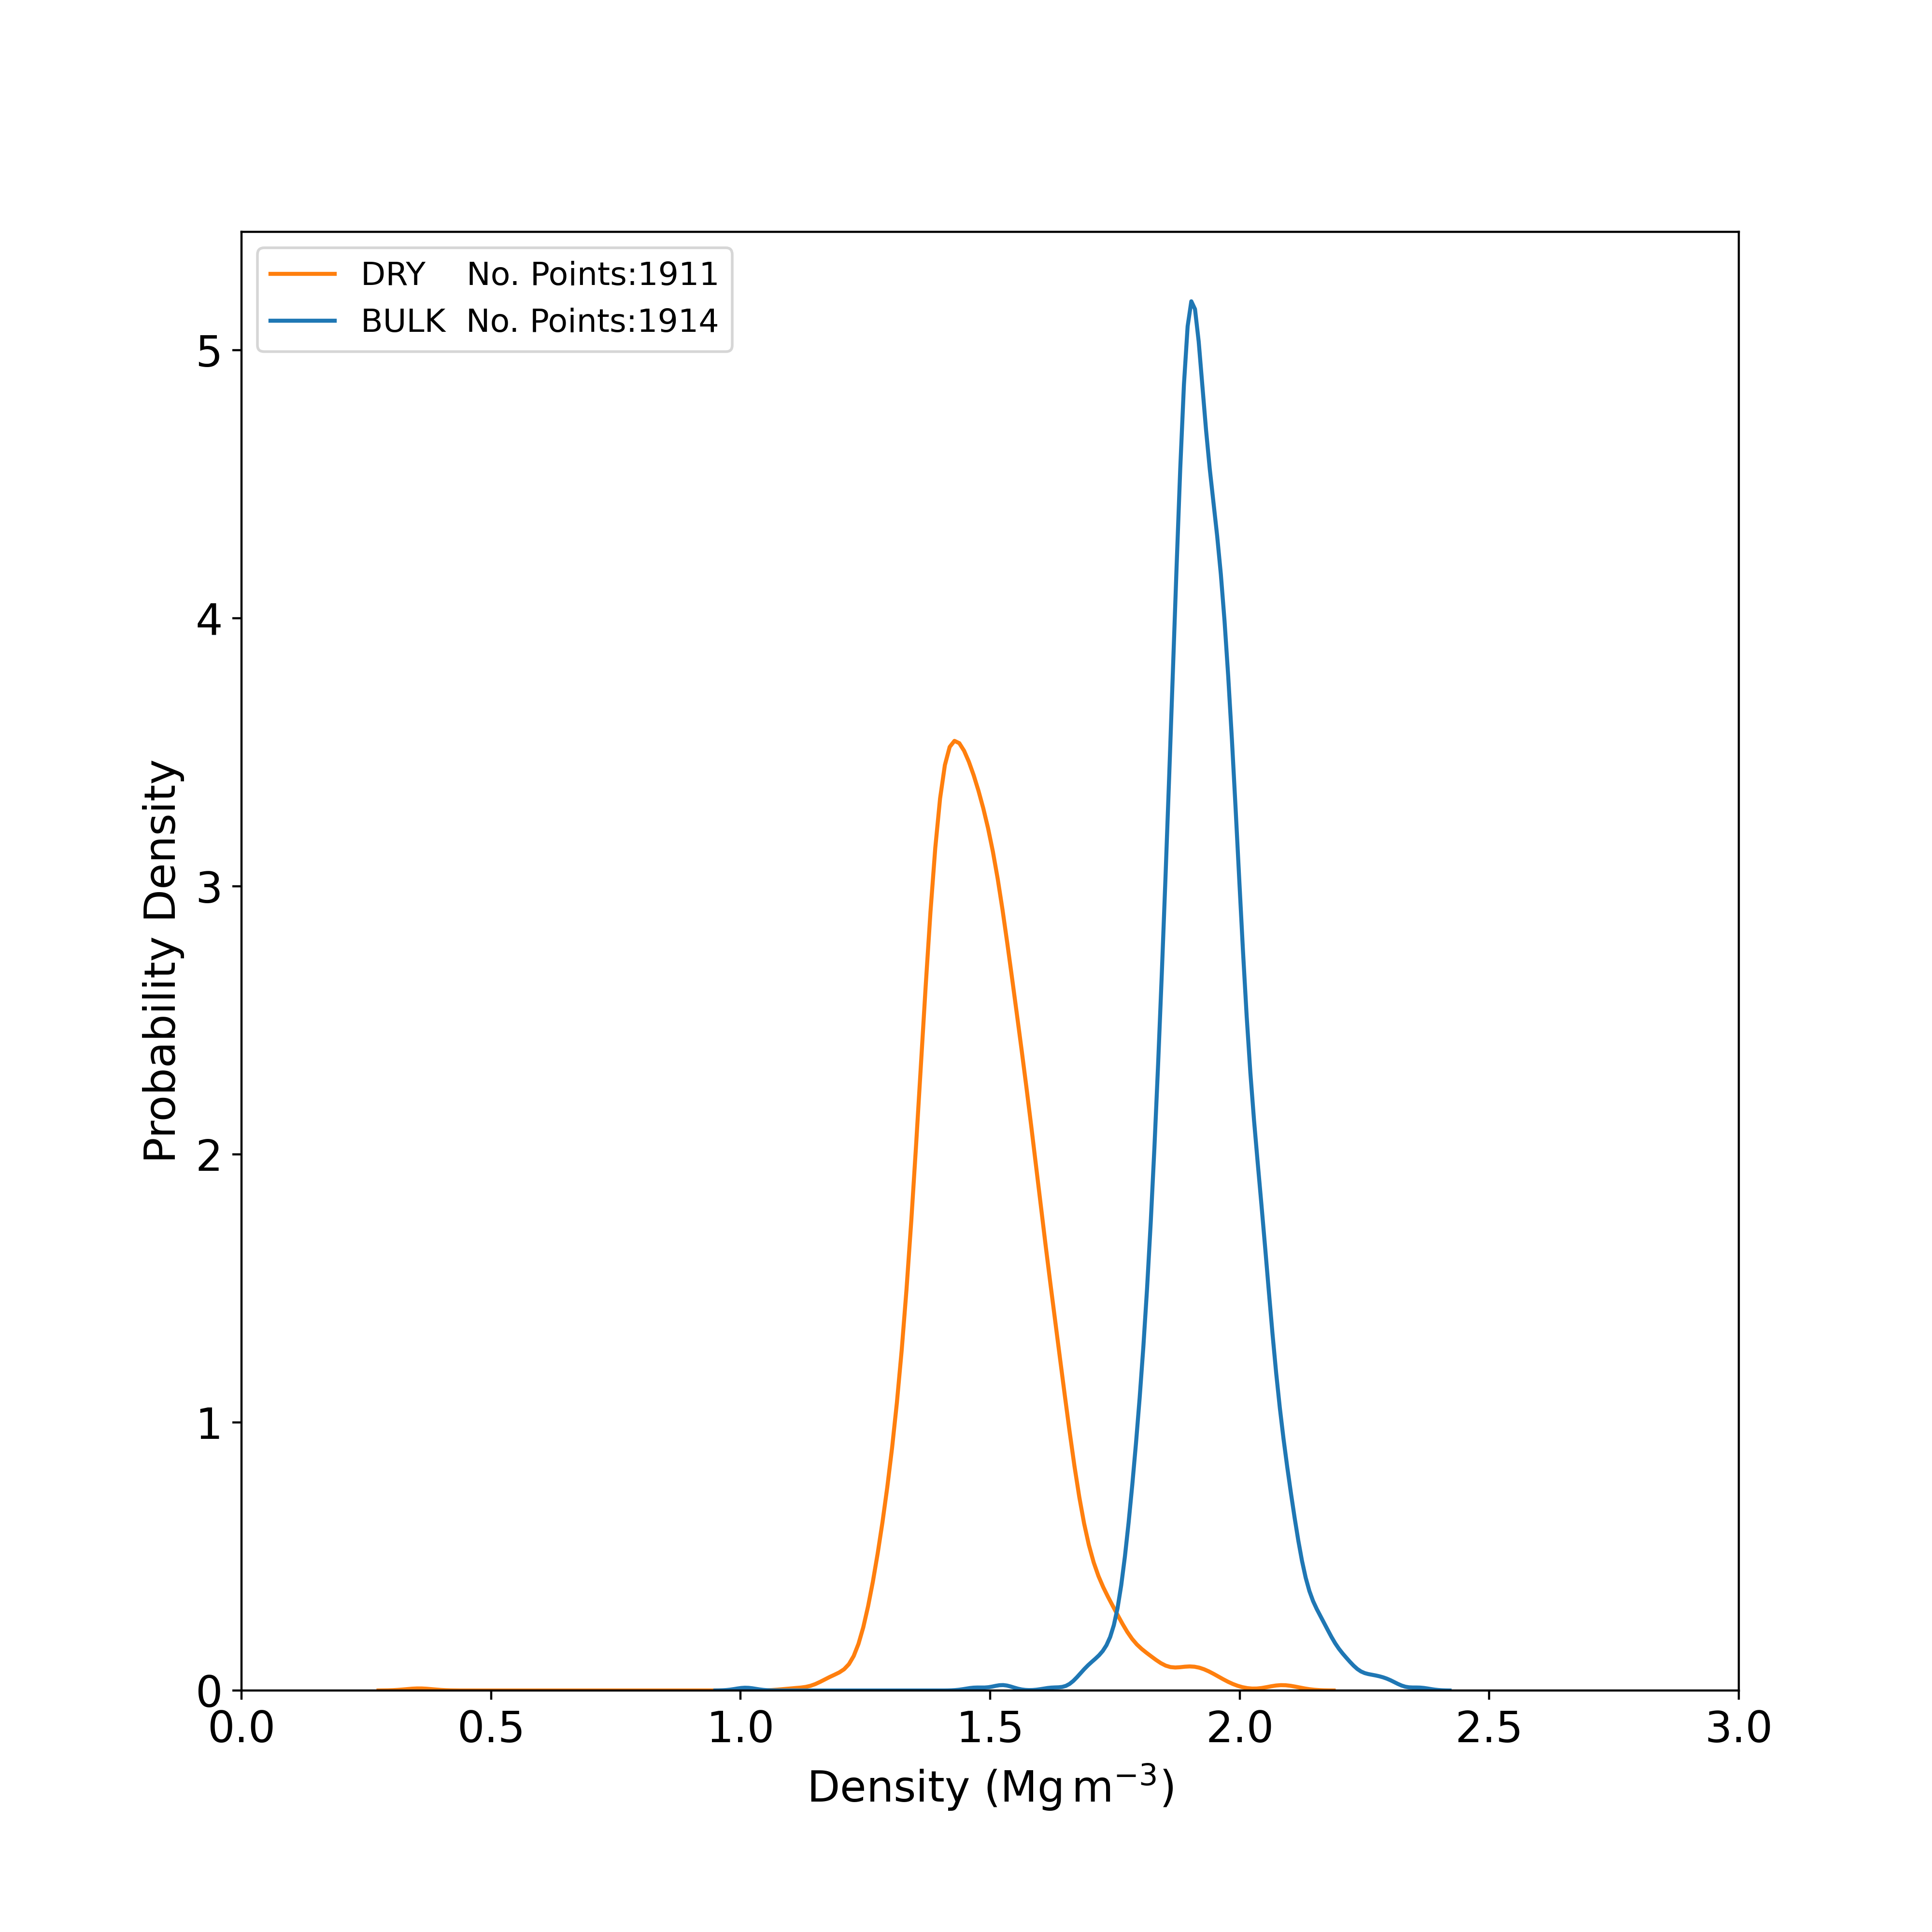
Geotechnical properties: classification tests
Kernel density plot showing the distribution of bulk density and dry density results obtained from laboratory tests. BGS © UKRI.
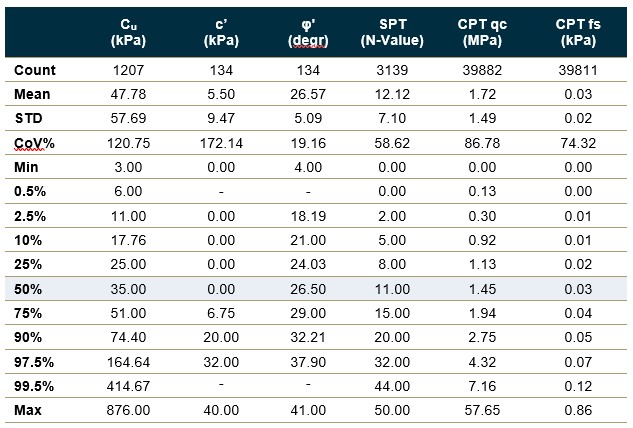
Geotechnical properties: strength tests
Statistical summaries of geotechnical strength properties from laboratory and in situ tests. STD – standard deviation; CoV% – coefficient of variation; Cu – undrained shear strength obtained from unconsolidated undrained triaxial tests; c’ – effective cohesion obtained from consolidated undrained triaxial tests with pore pressure measurements and consolidated drained triaxial tests; φ’ – effective internal friction angle obtained from consolidated undrained triaxial tests with pore pressure measurements and consolidated drained triaxial tests ; SPT – standard penetration test (number of tests with N-value > 50 or with no N-value = 150); CPT qc – cone penetration test resistance; CPT fs – cone penetration test friction (negative friction values removed for statistical analysis) . Percentiles reported based on sample size; no summaries are provided where there are fewer than 5 samples. BGS © UKRI
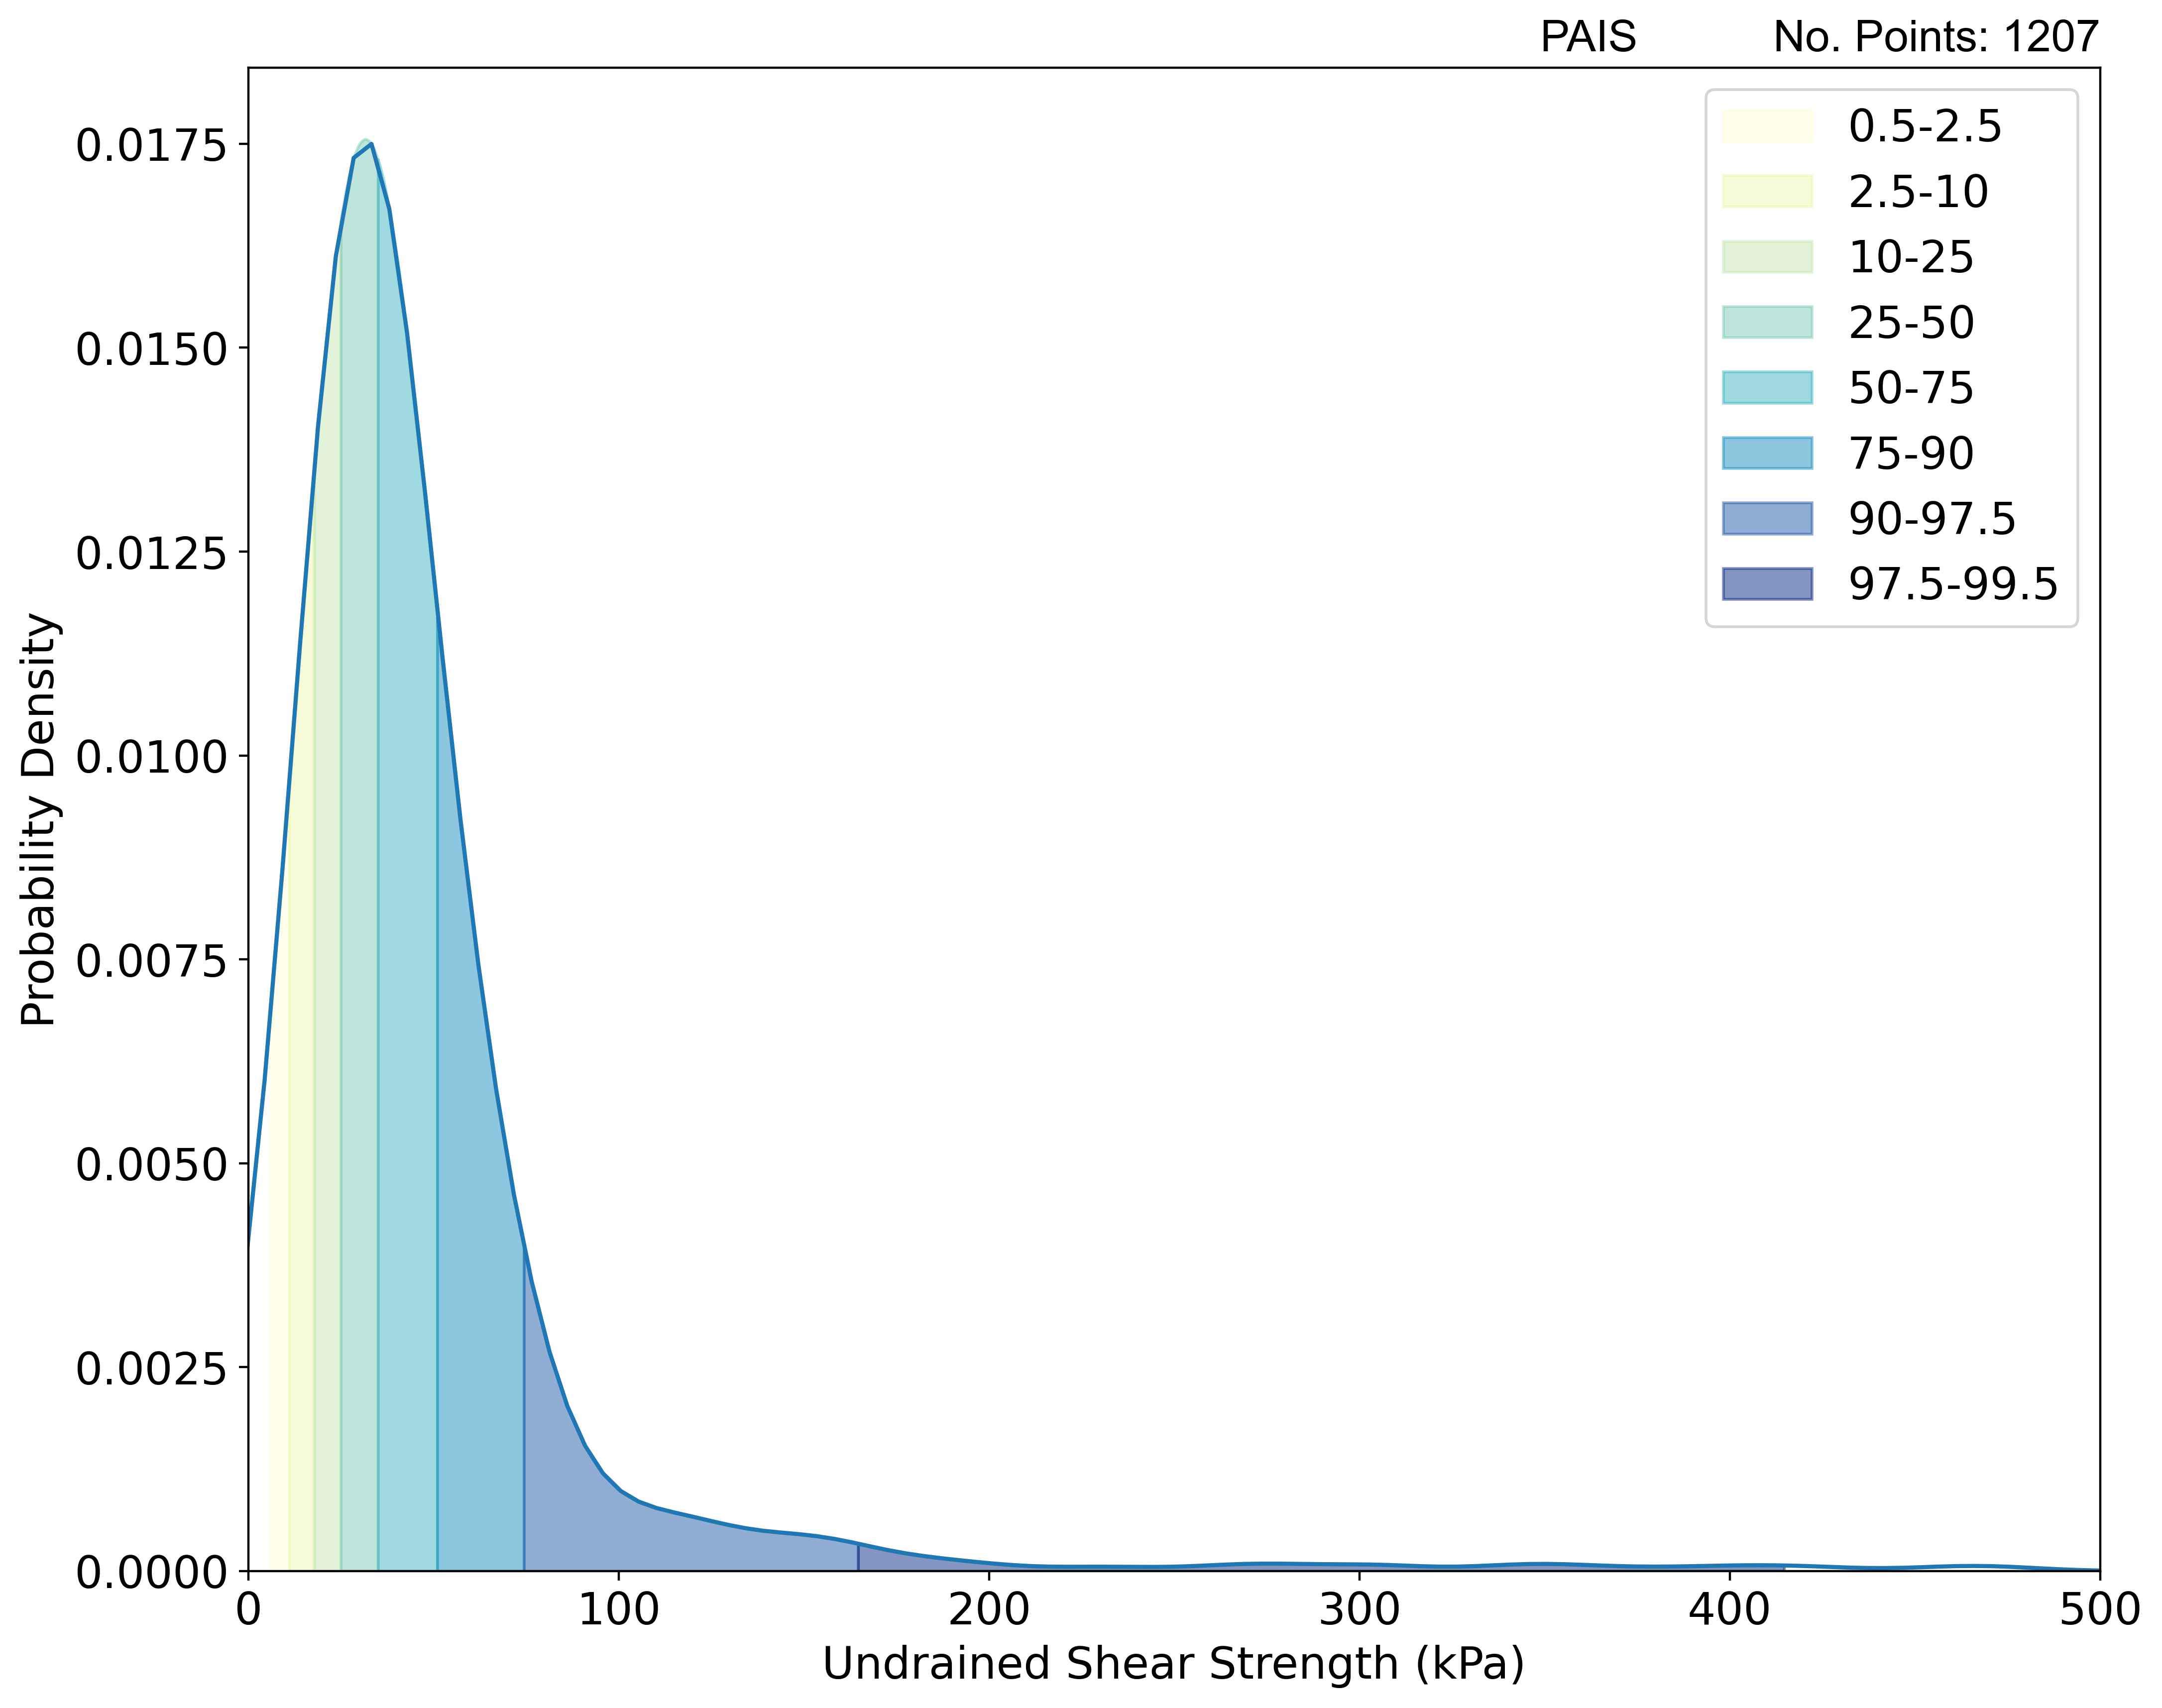
Geotechnical properties: strength tests
Kernel density plot showing the distribution of undrained shear strength results obtained from unconsolidated undrained triaxial laboratory tests with percentile ranges from statistical analysis superimposed as coloured segments. BGS © UKRI.
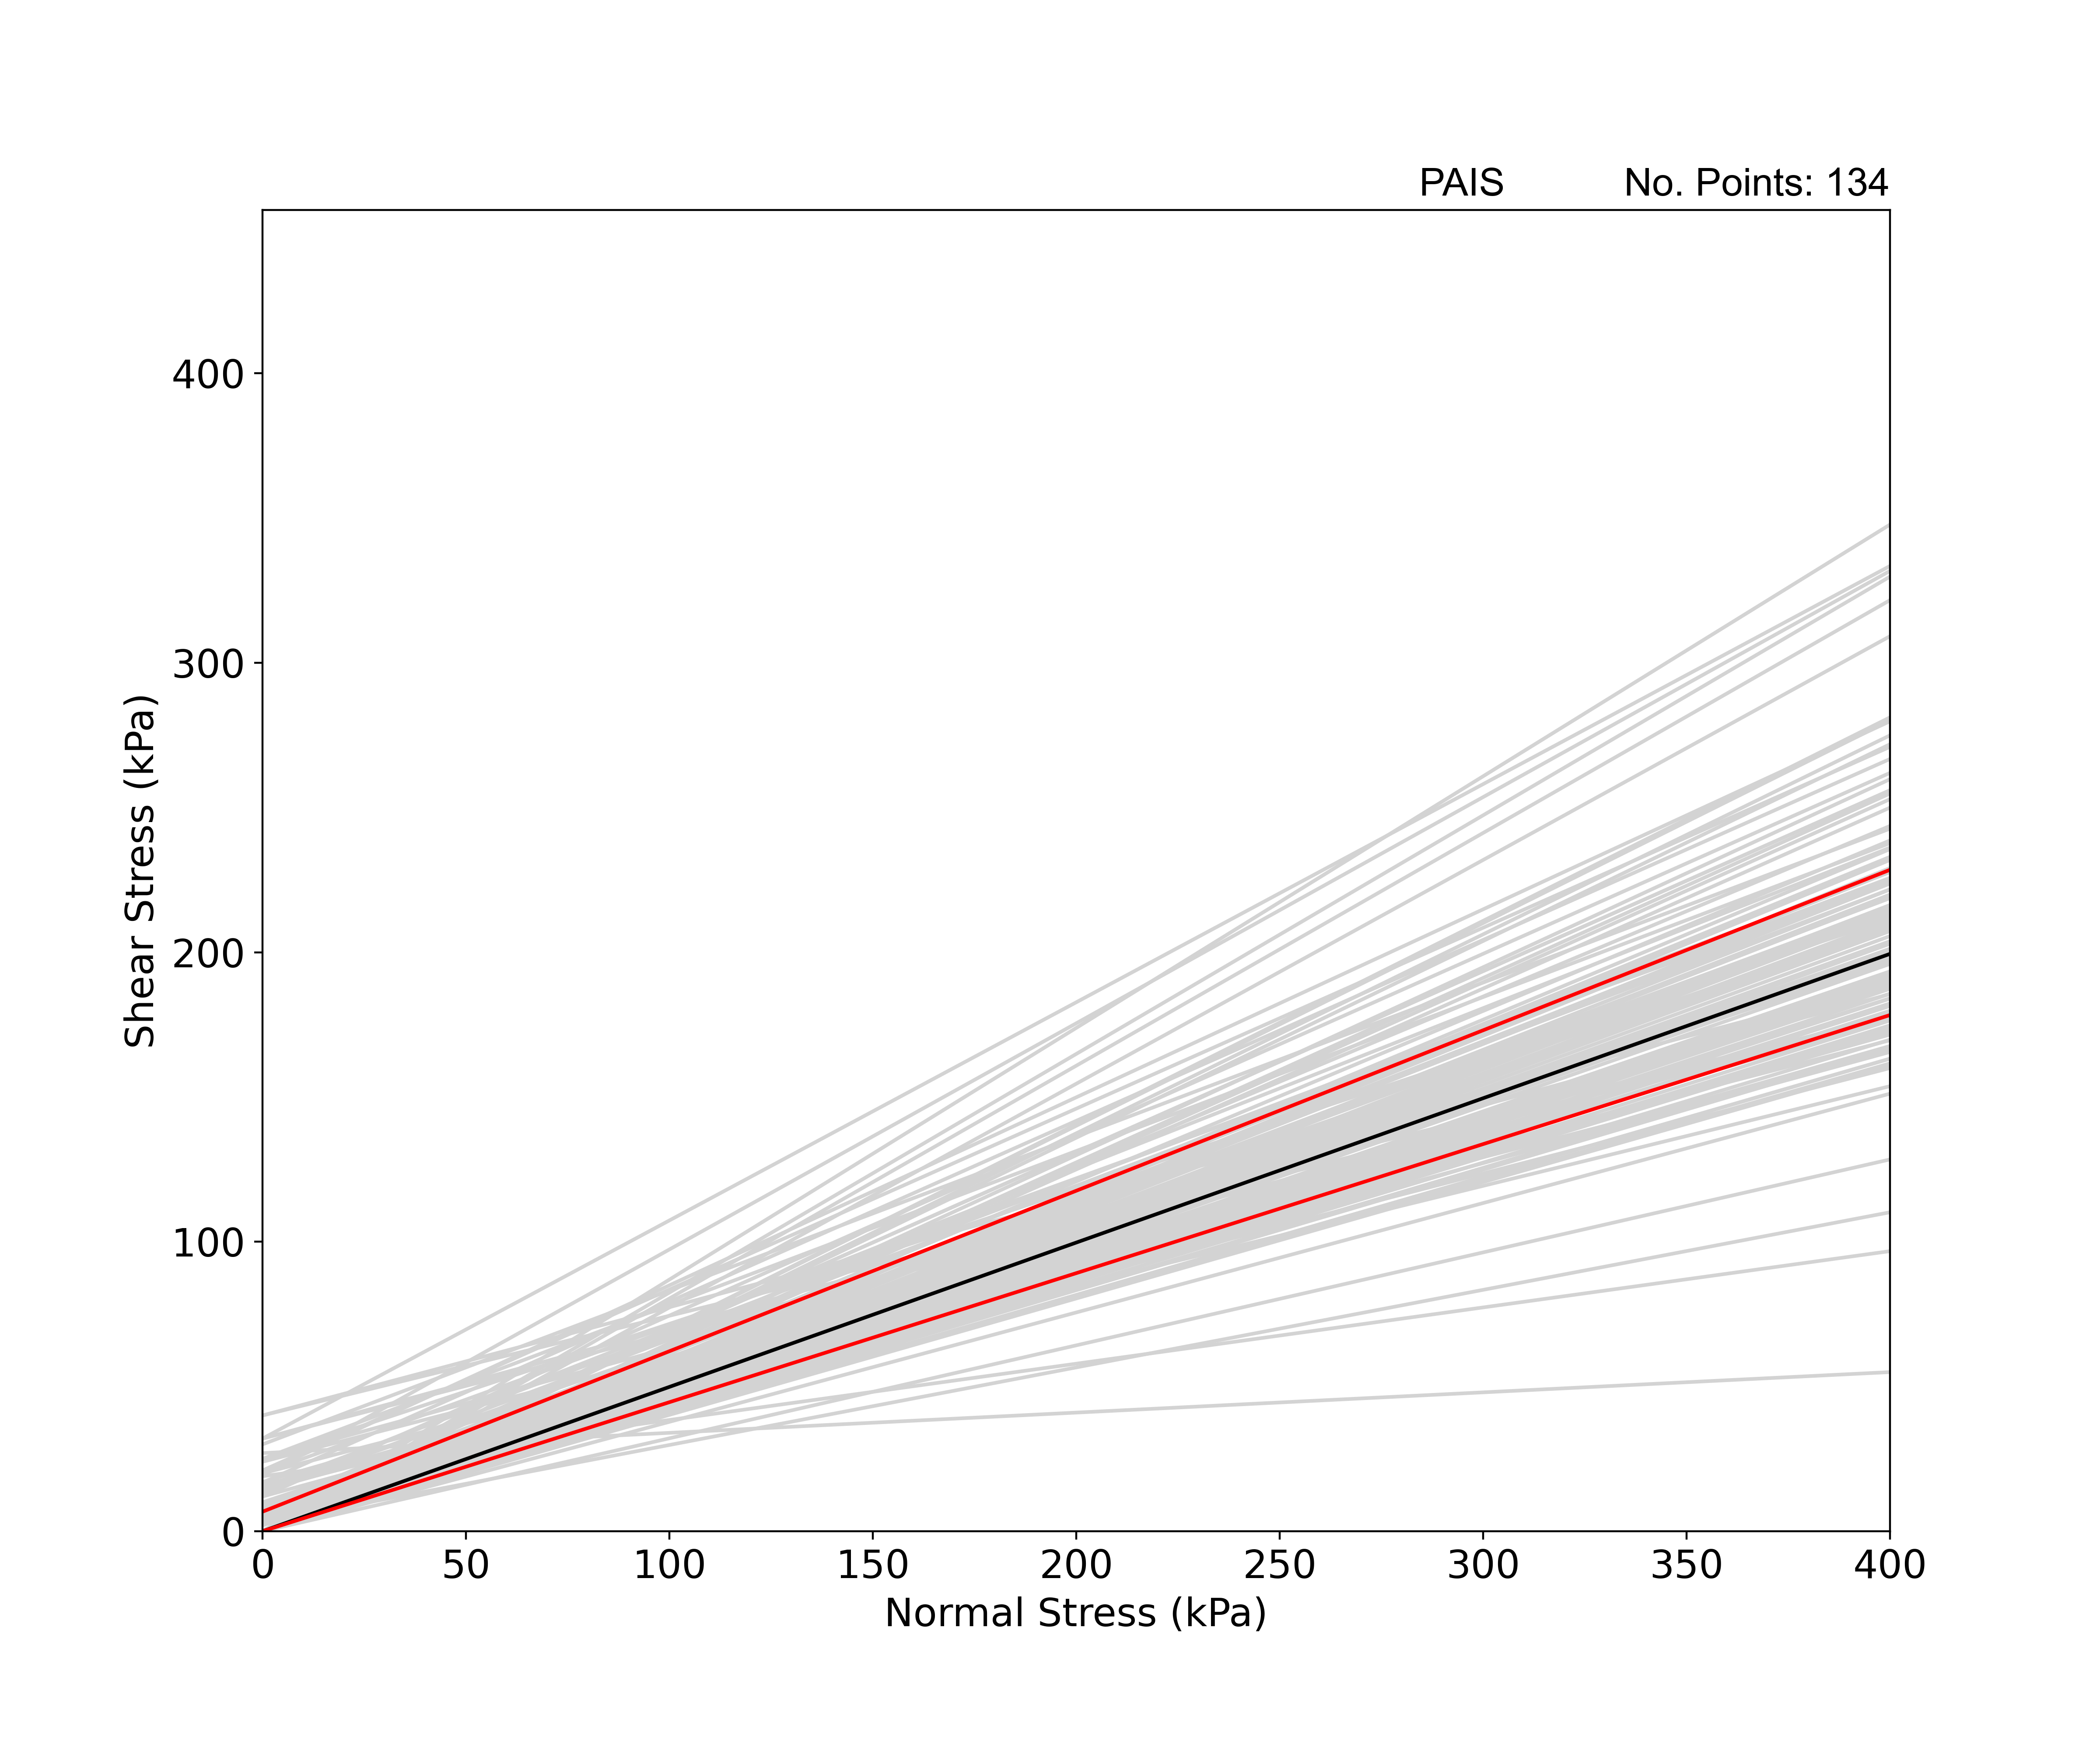
Geotechnical properties: strength tests
Mohr-Coulomb failure plot showing individual failure envelopes (light grey), median failure envelope (black) and 25th and 75th percentile failure envelopes (red) based on effective cohesion and phi values obtained from consolidated drained triaxial tests and consolidated undrained triaxial tests with pore pressure measurements. BGS © UKRI.
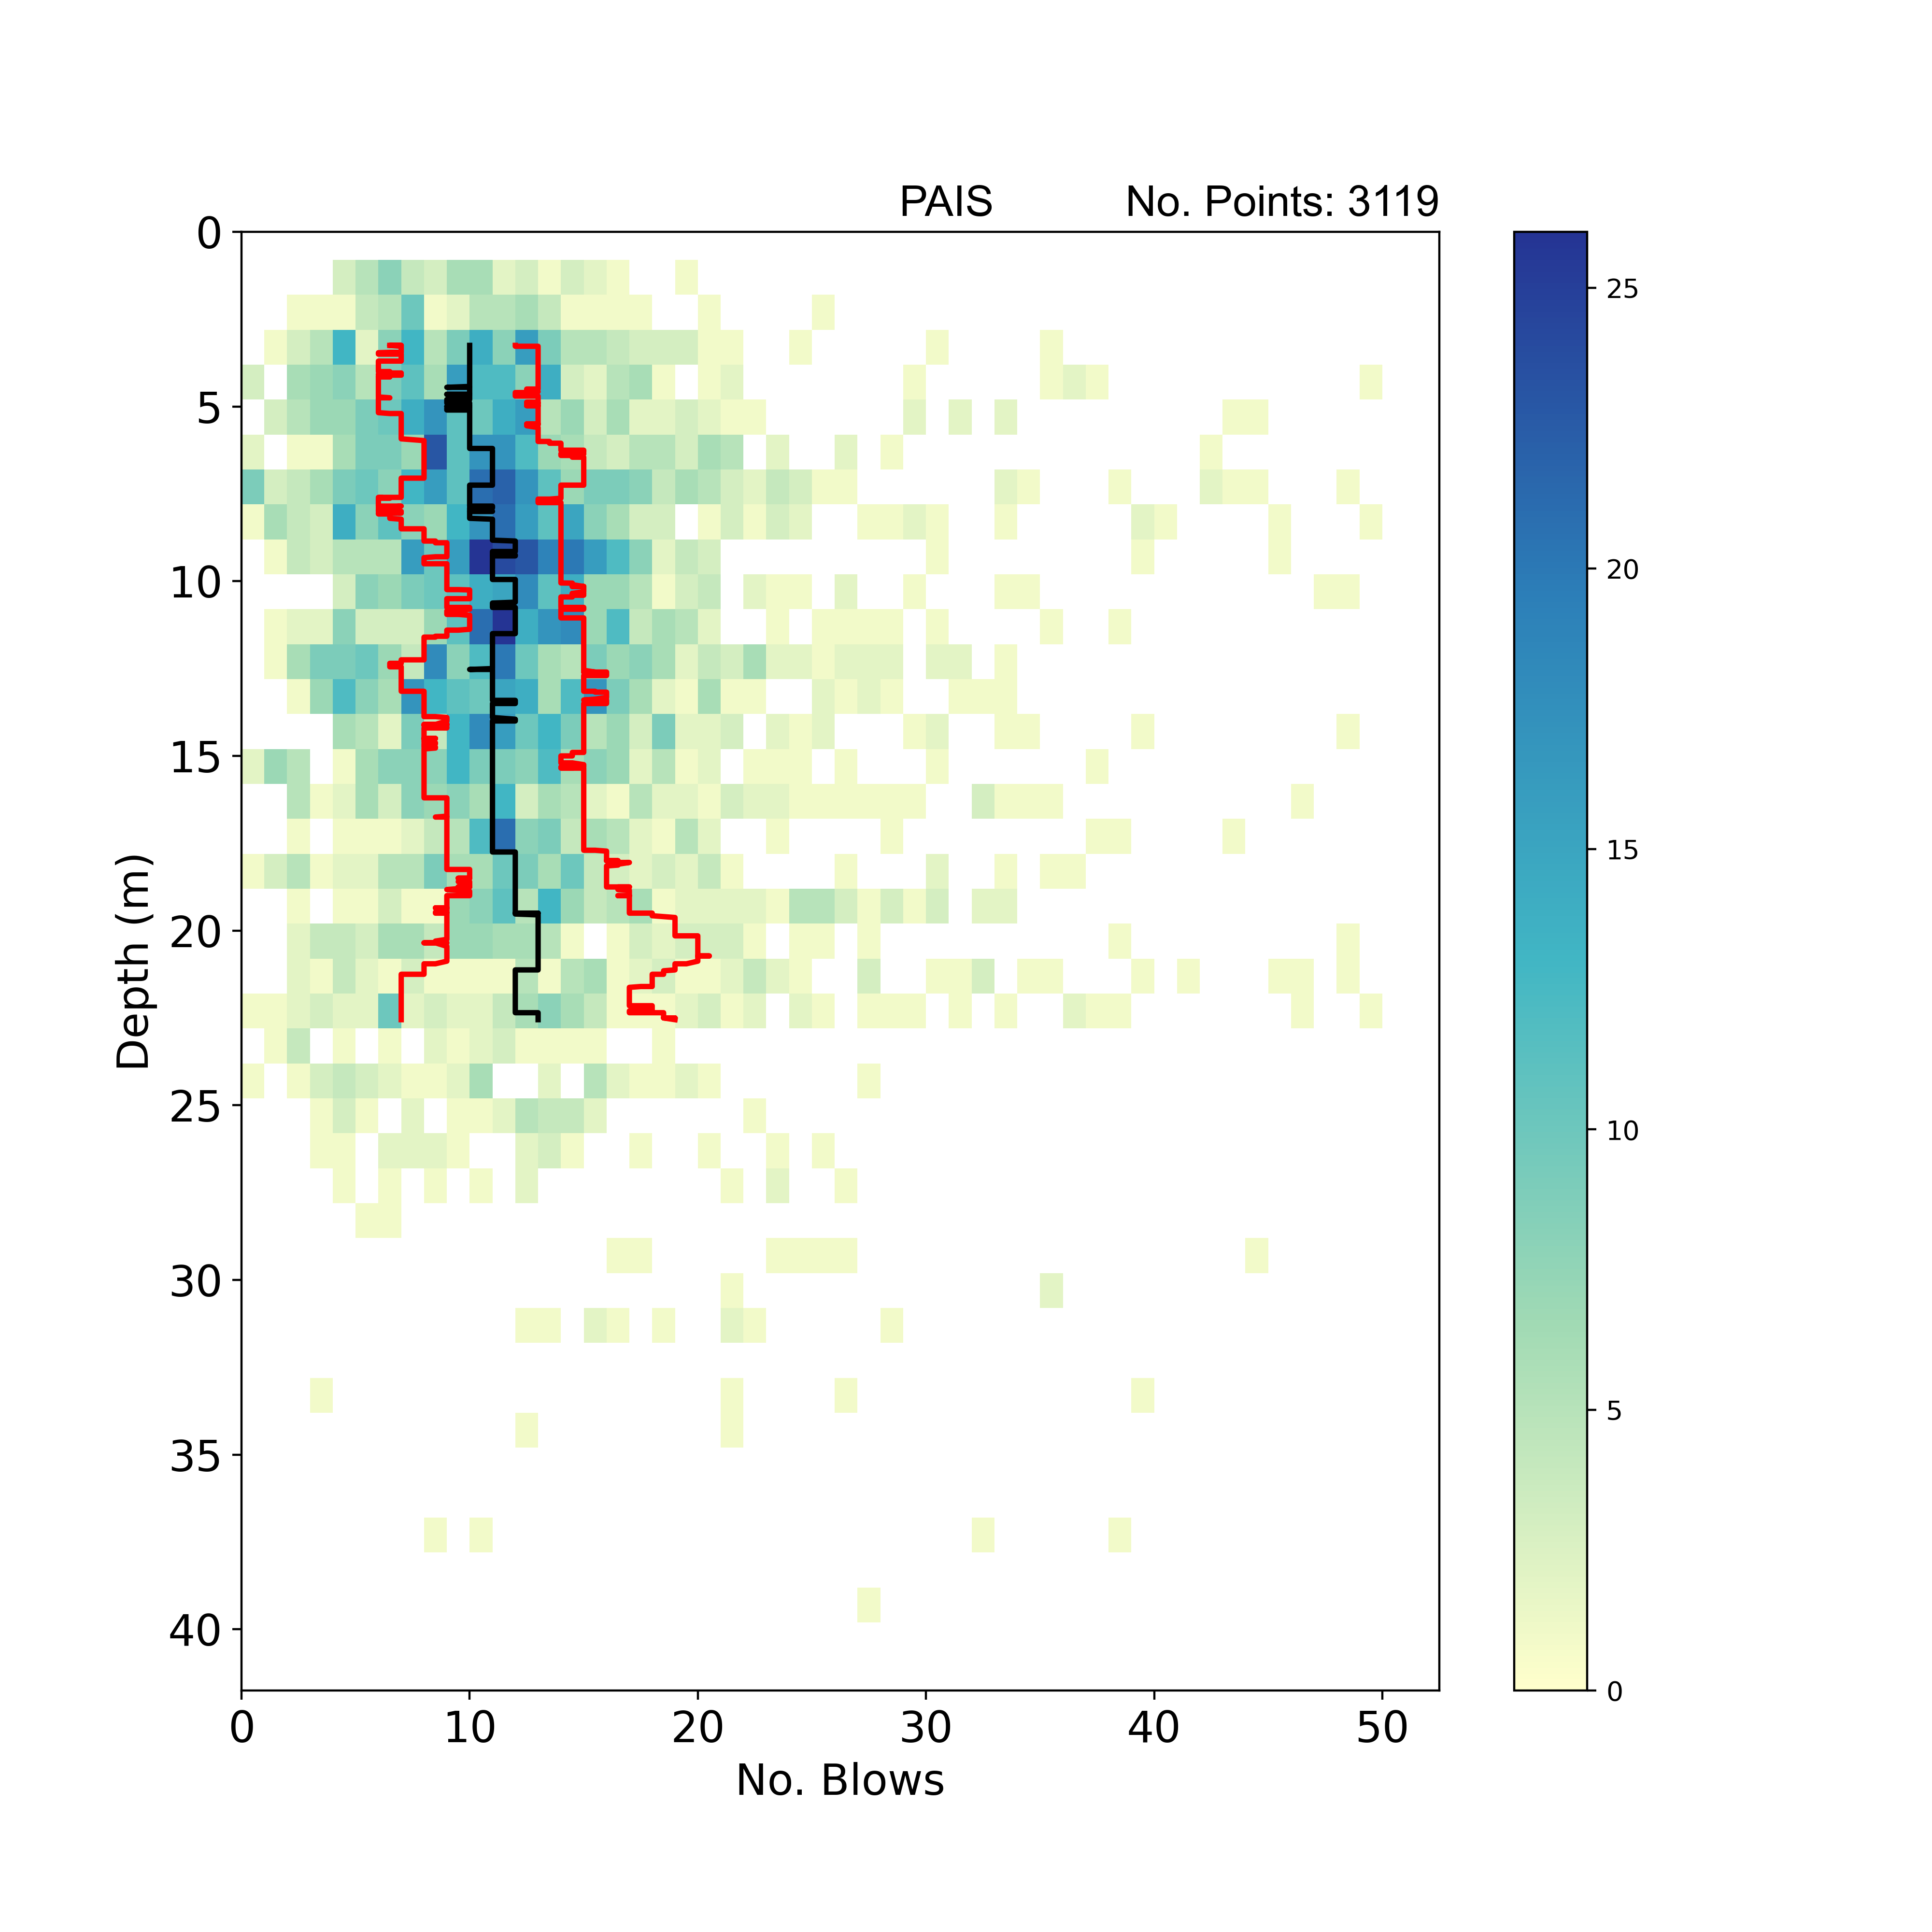
Geotechnical properties: strength tests
2D histogram summarising SPT N-value results with depth. Black line: SPT N-value with depth trend using a rolling window median (window width = 10 per cent sample number); red lines: SPT N-value with depth trend using a rolling window of 25th and 75th percentile (window width = 10 per cent sample number). Number of tests with N-value > 50 or with no N-value = 150. BGS © UKRI.
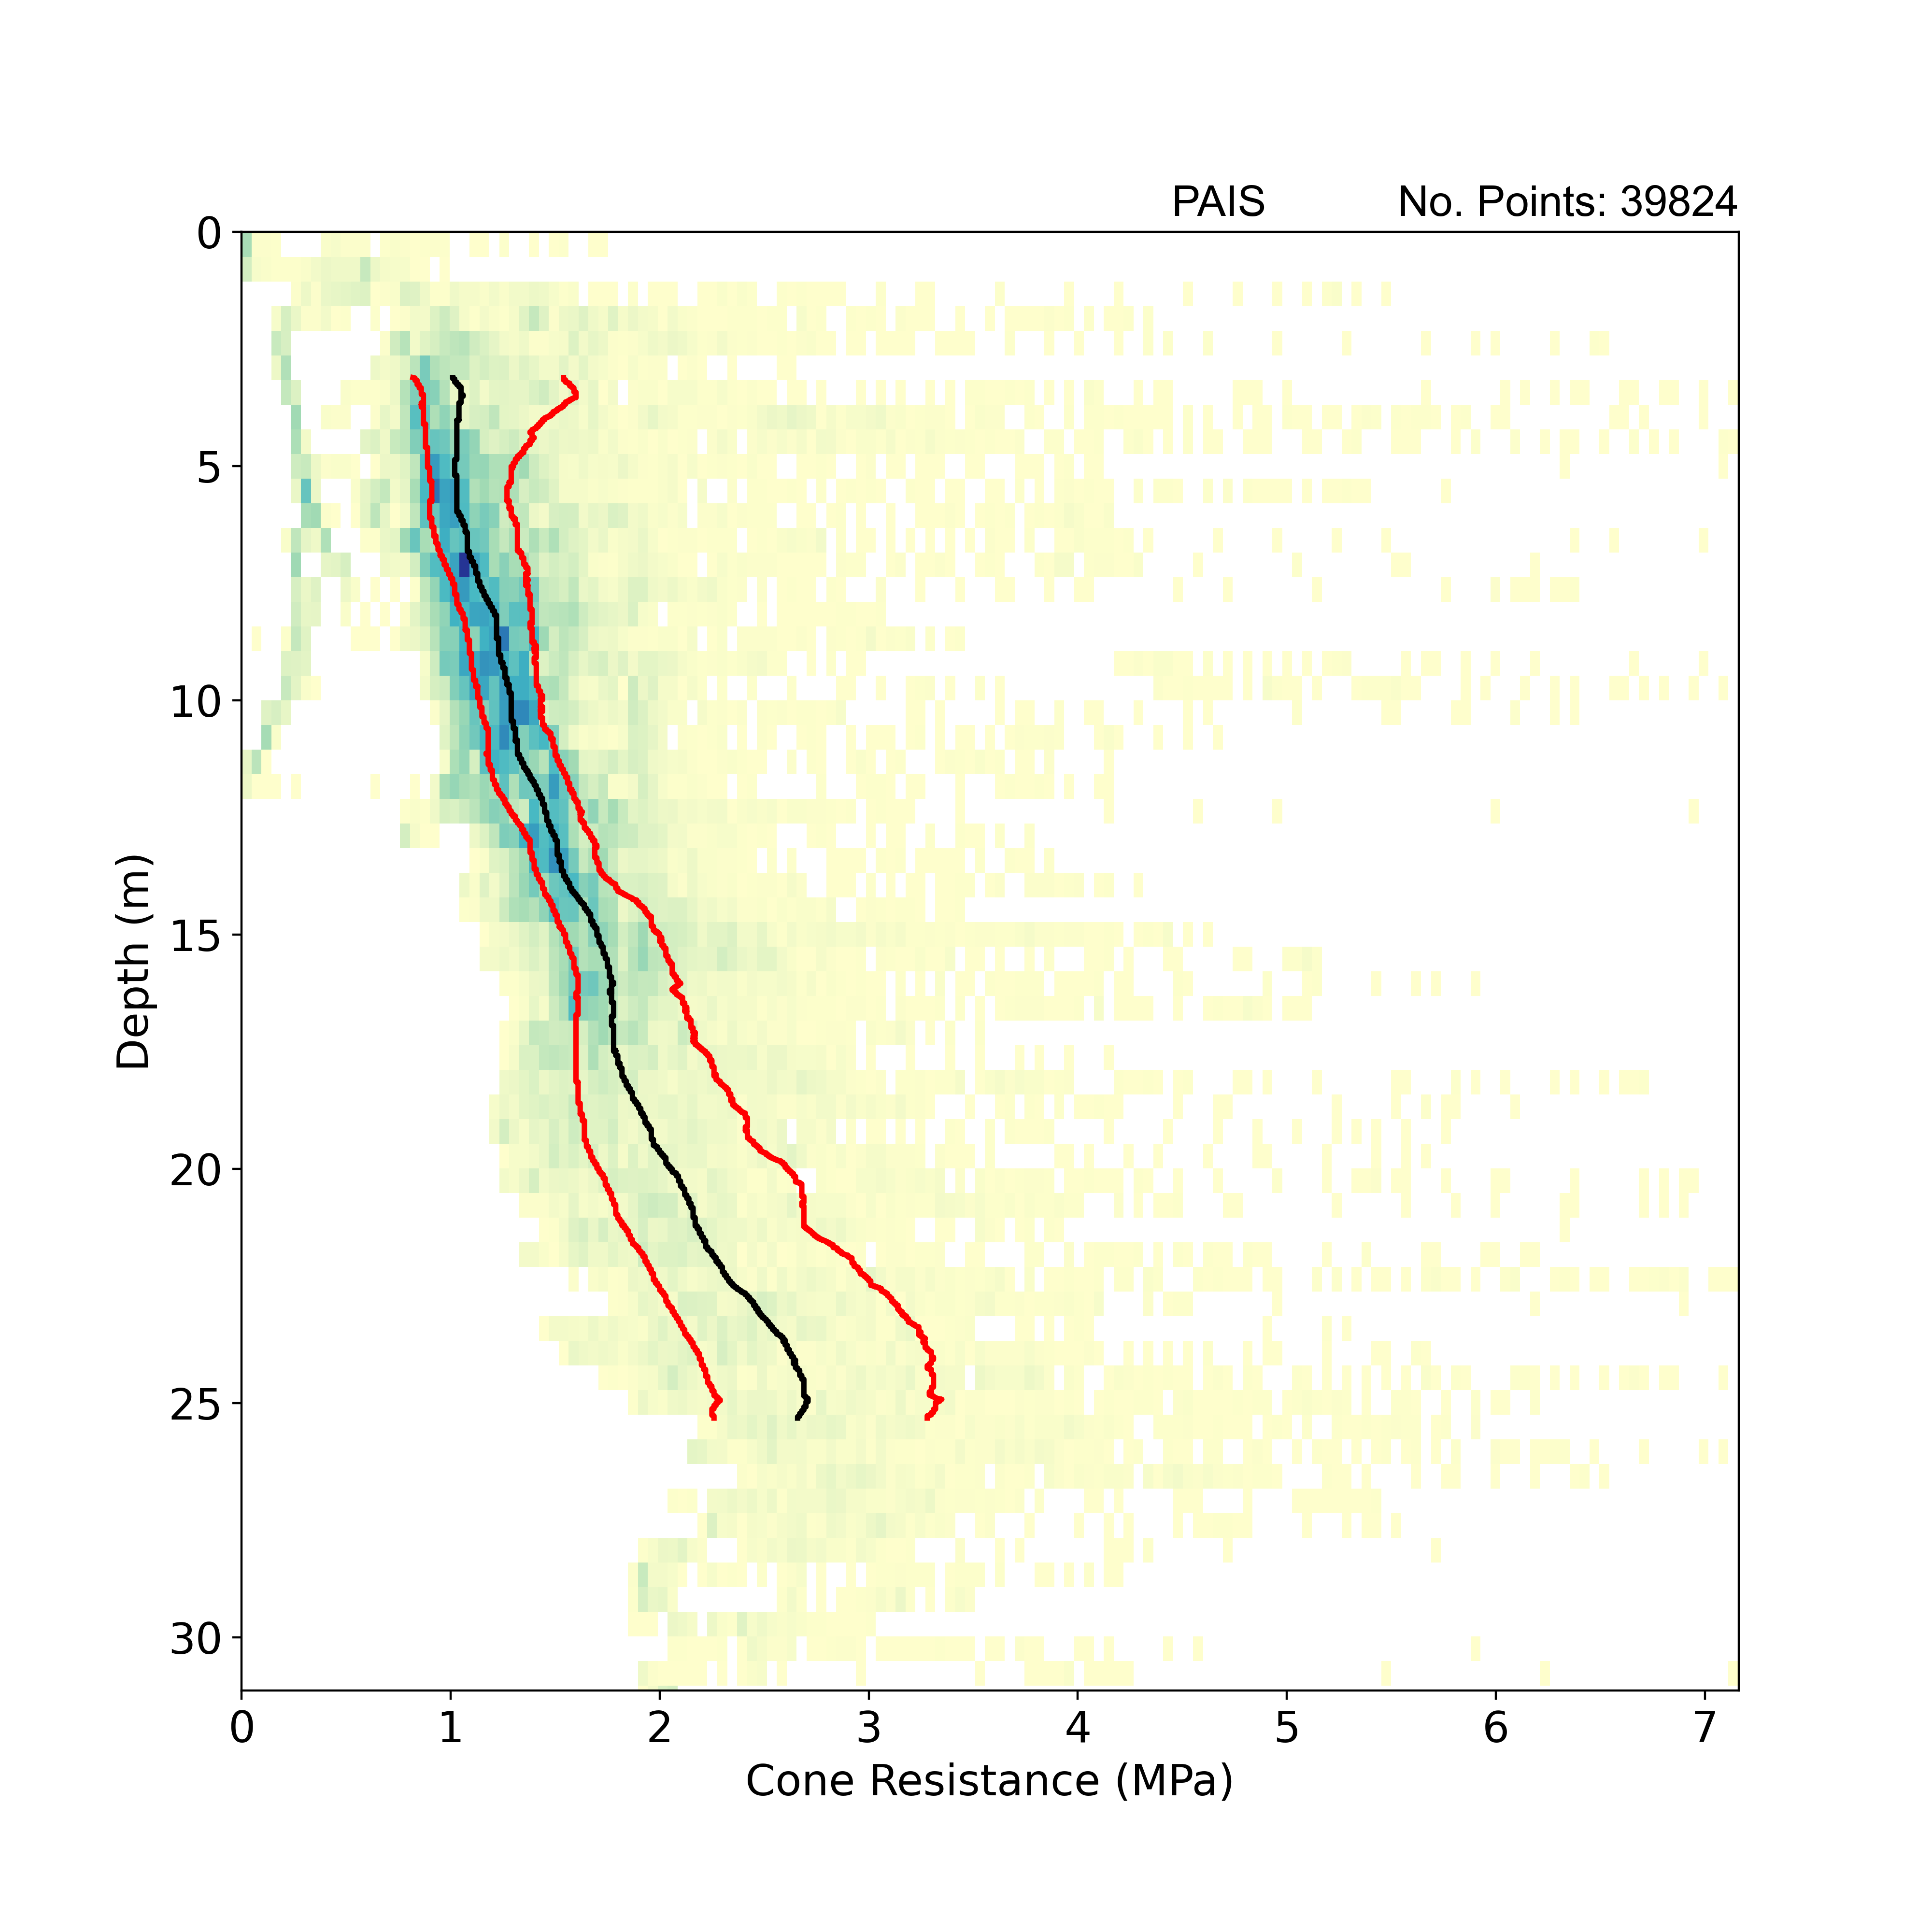
Geotechnical properties: strength tests
2D histogram summarising cone resistance with depth obtained from static cone penetration tests. Black line: cone resistance with depth trend using a rolling window median (window width = 10 per cent sample number); red lines: cone resistance with depth trend using a rolling window of 25th and 75th percentile (window width = 10 per cent sample number). BGS © UKRI.
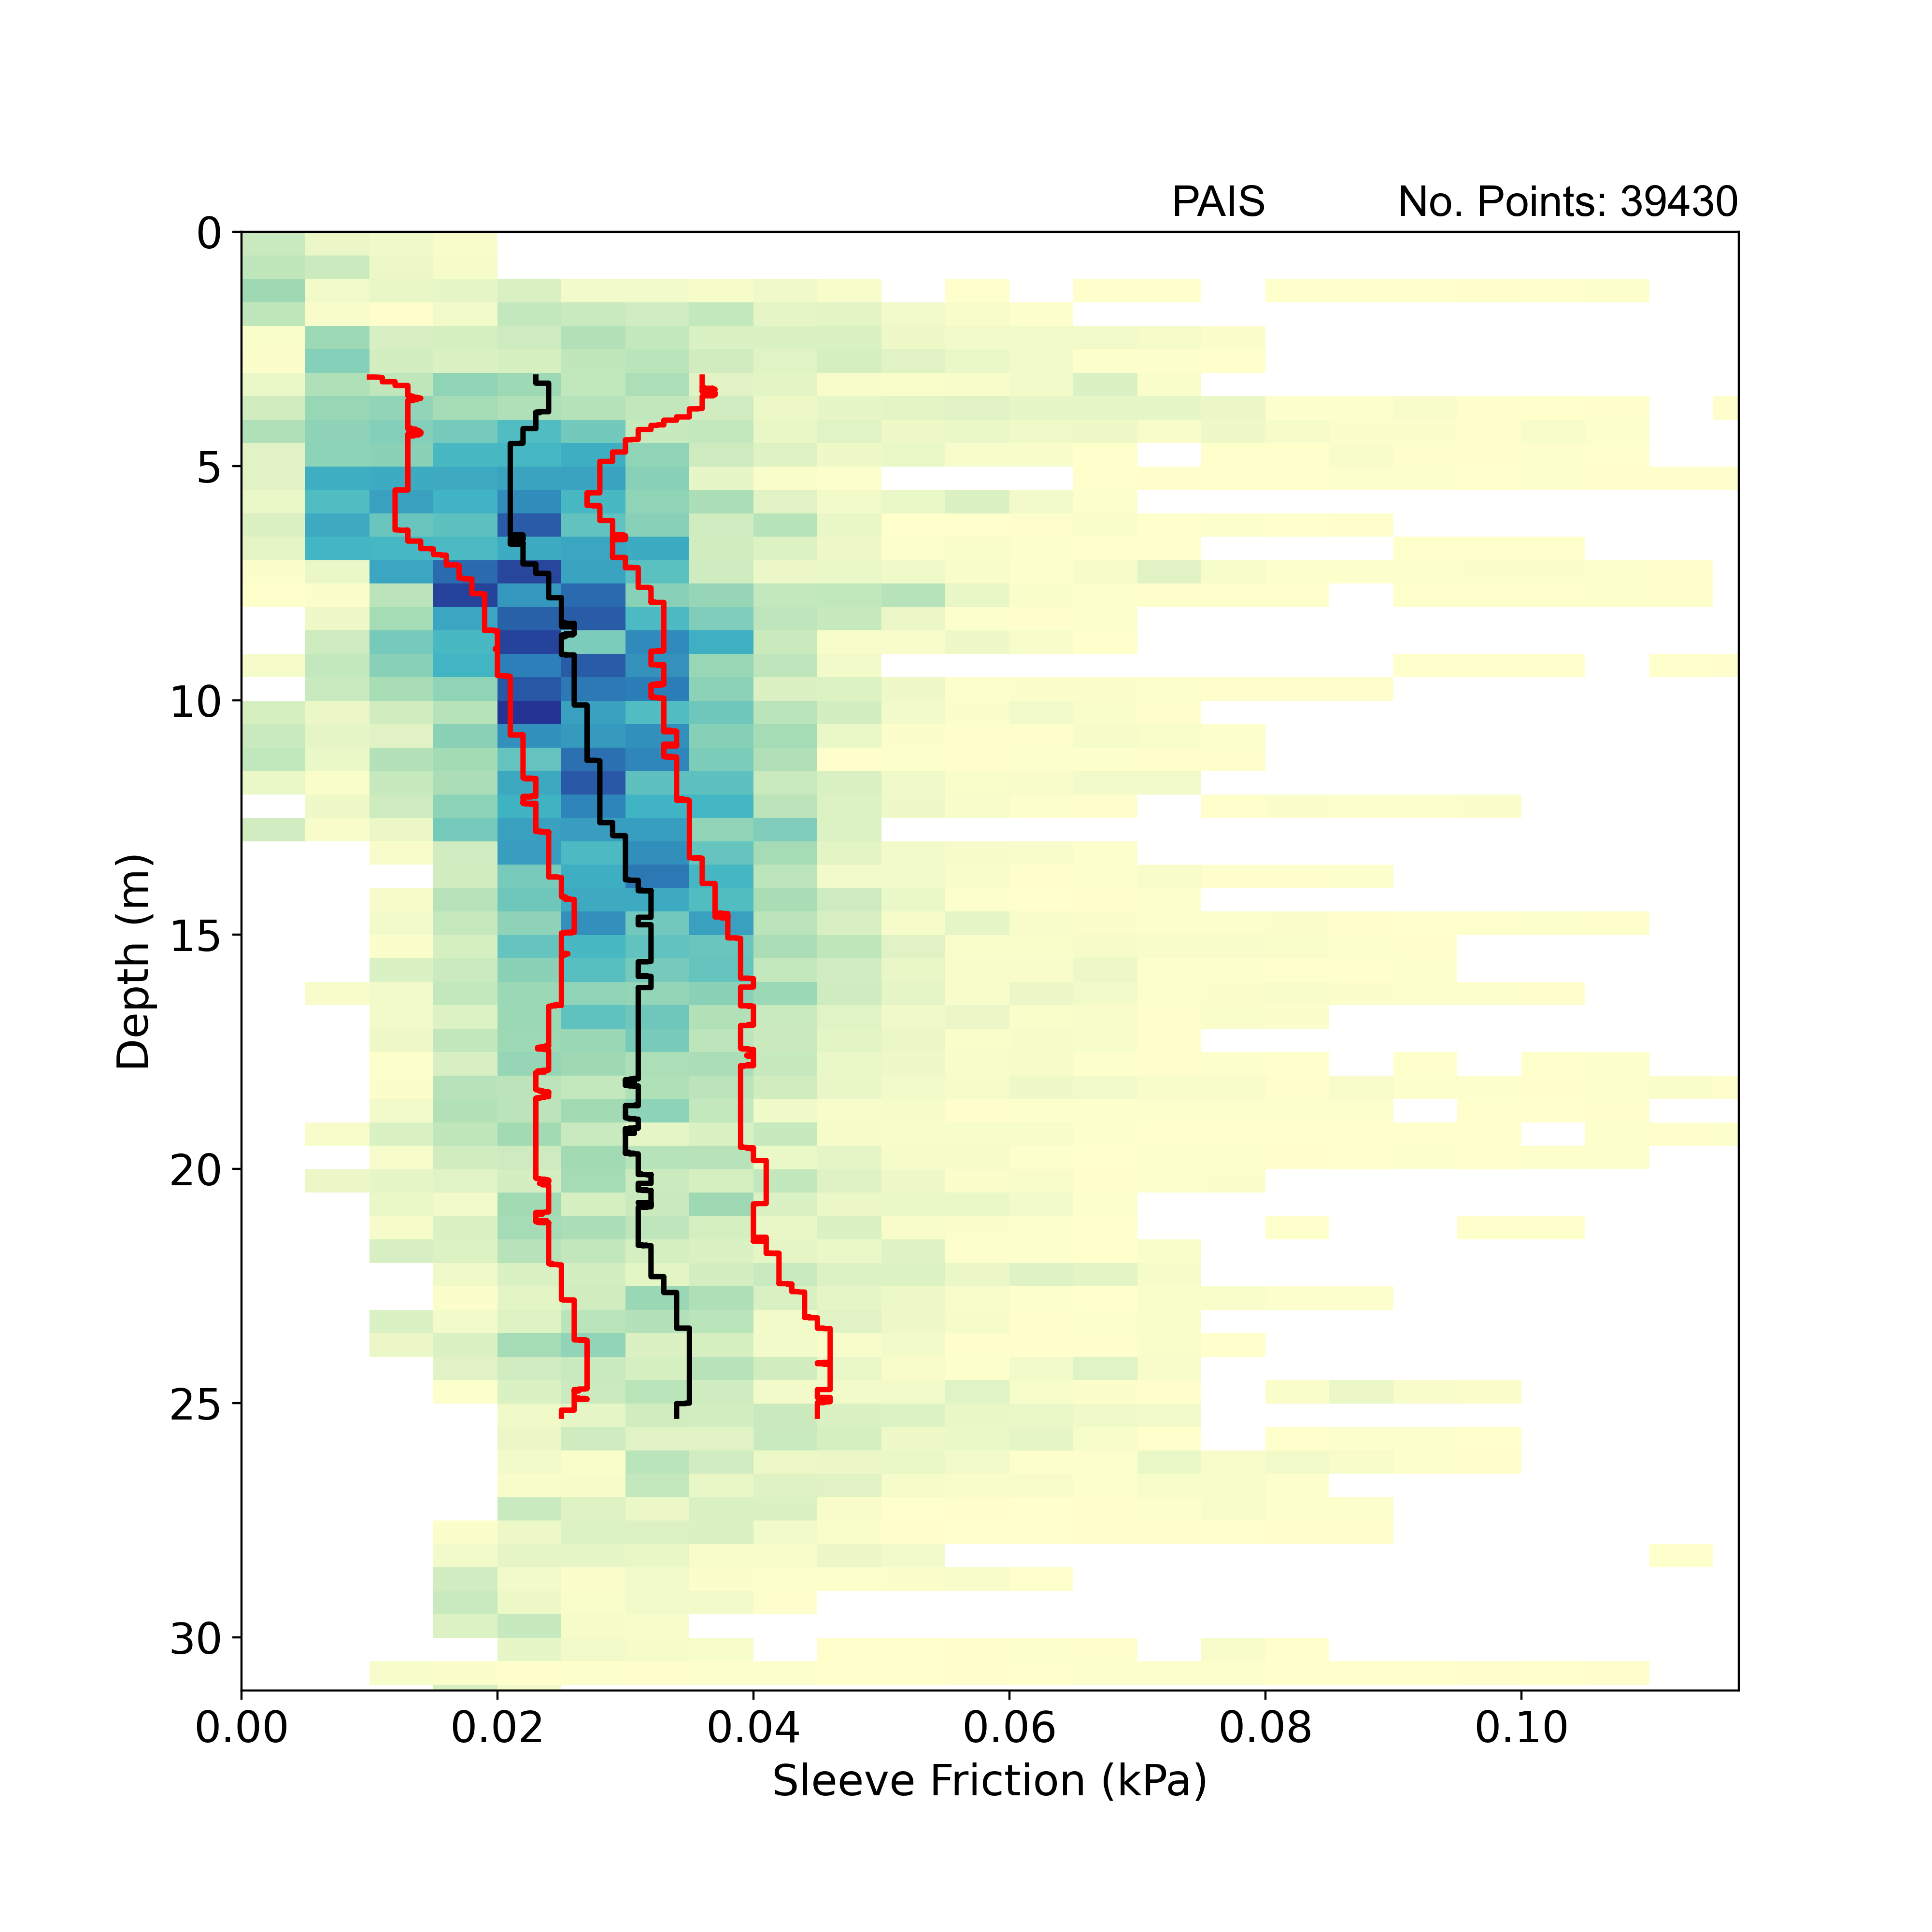
Geotechnical properties: strength tests
2D histogram summarising sleeve friction with depth obtained from static cone penetration tests. Black line: sleeve friction with depth trend using a rolling window median (window width = 10 per cent sample number); red lines: sleeve friction with depth trend using a rolling window of 25th and 75th percentile (window width = 10 per cent sample number). BGS © UKRI.
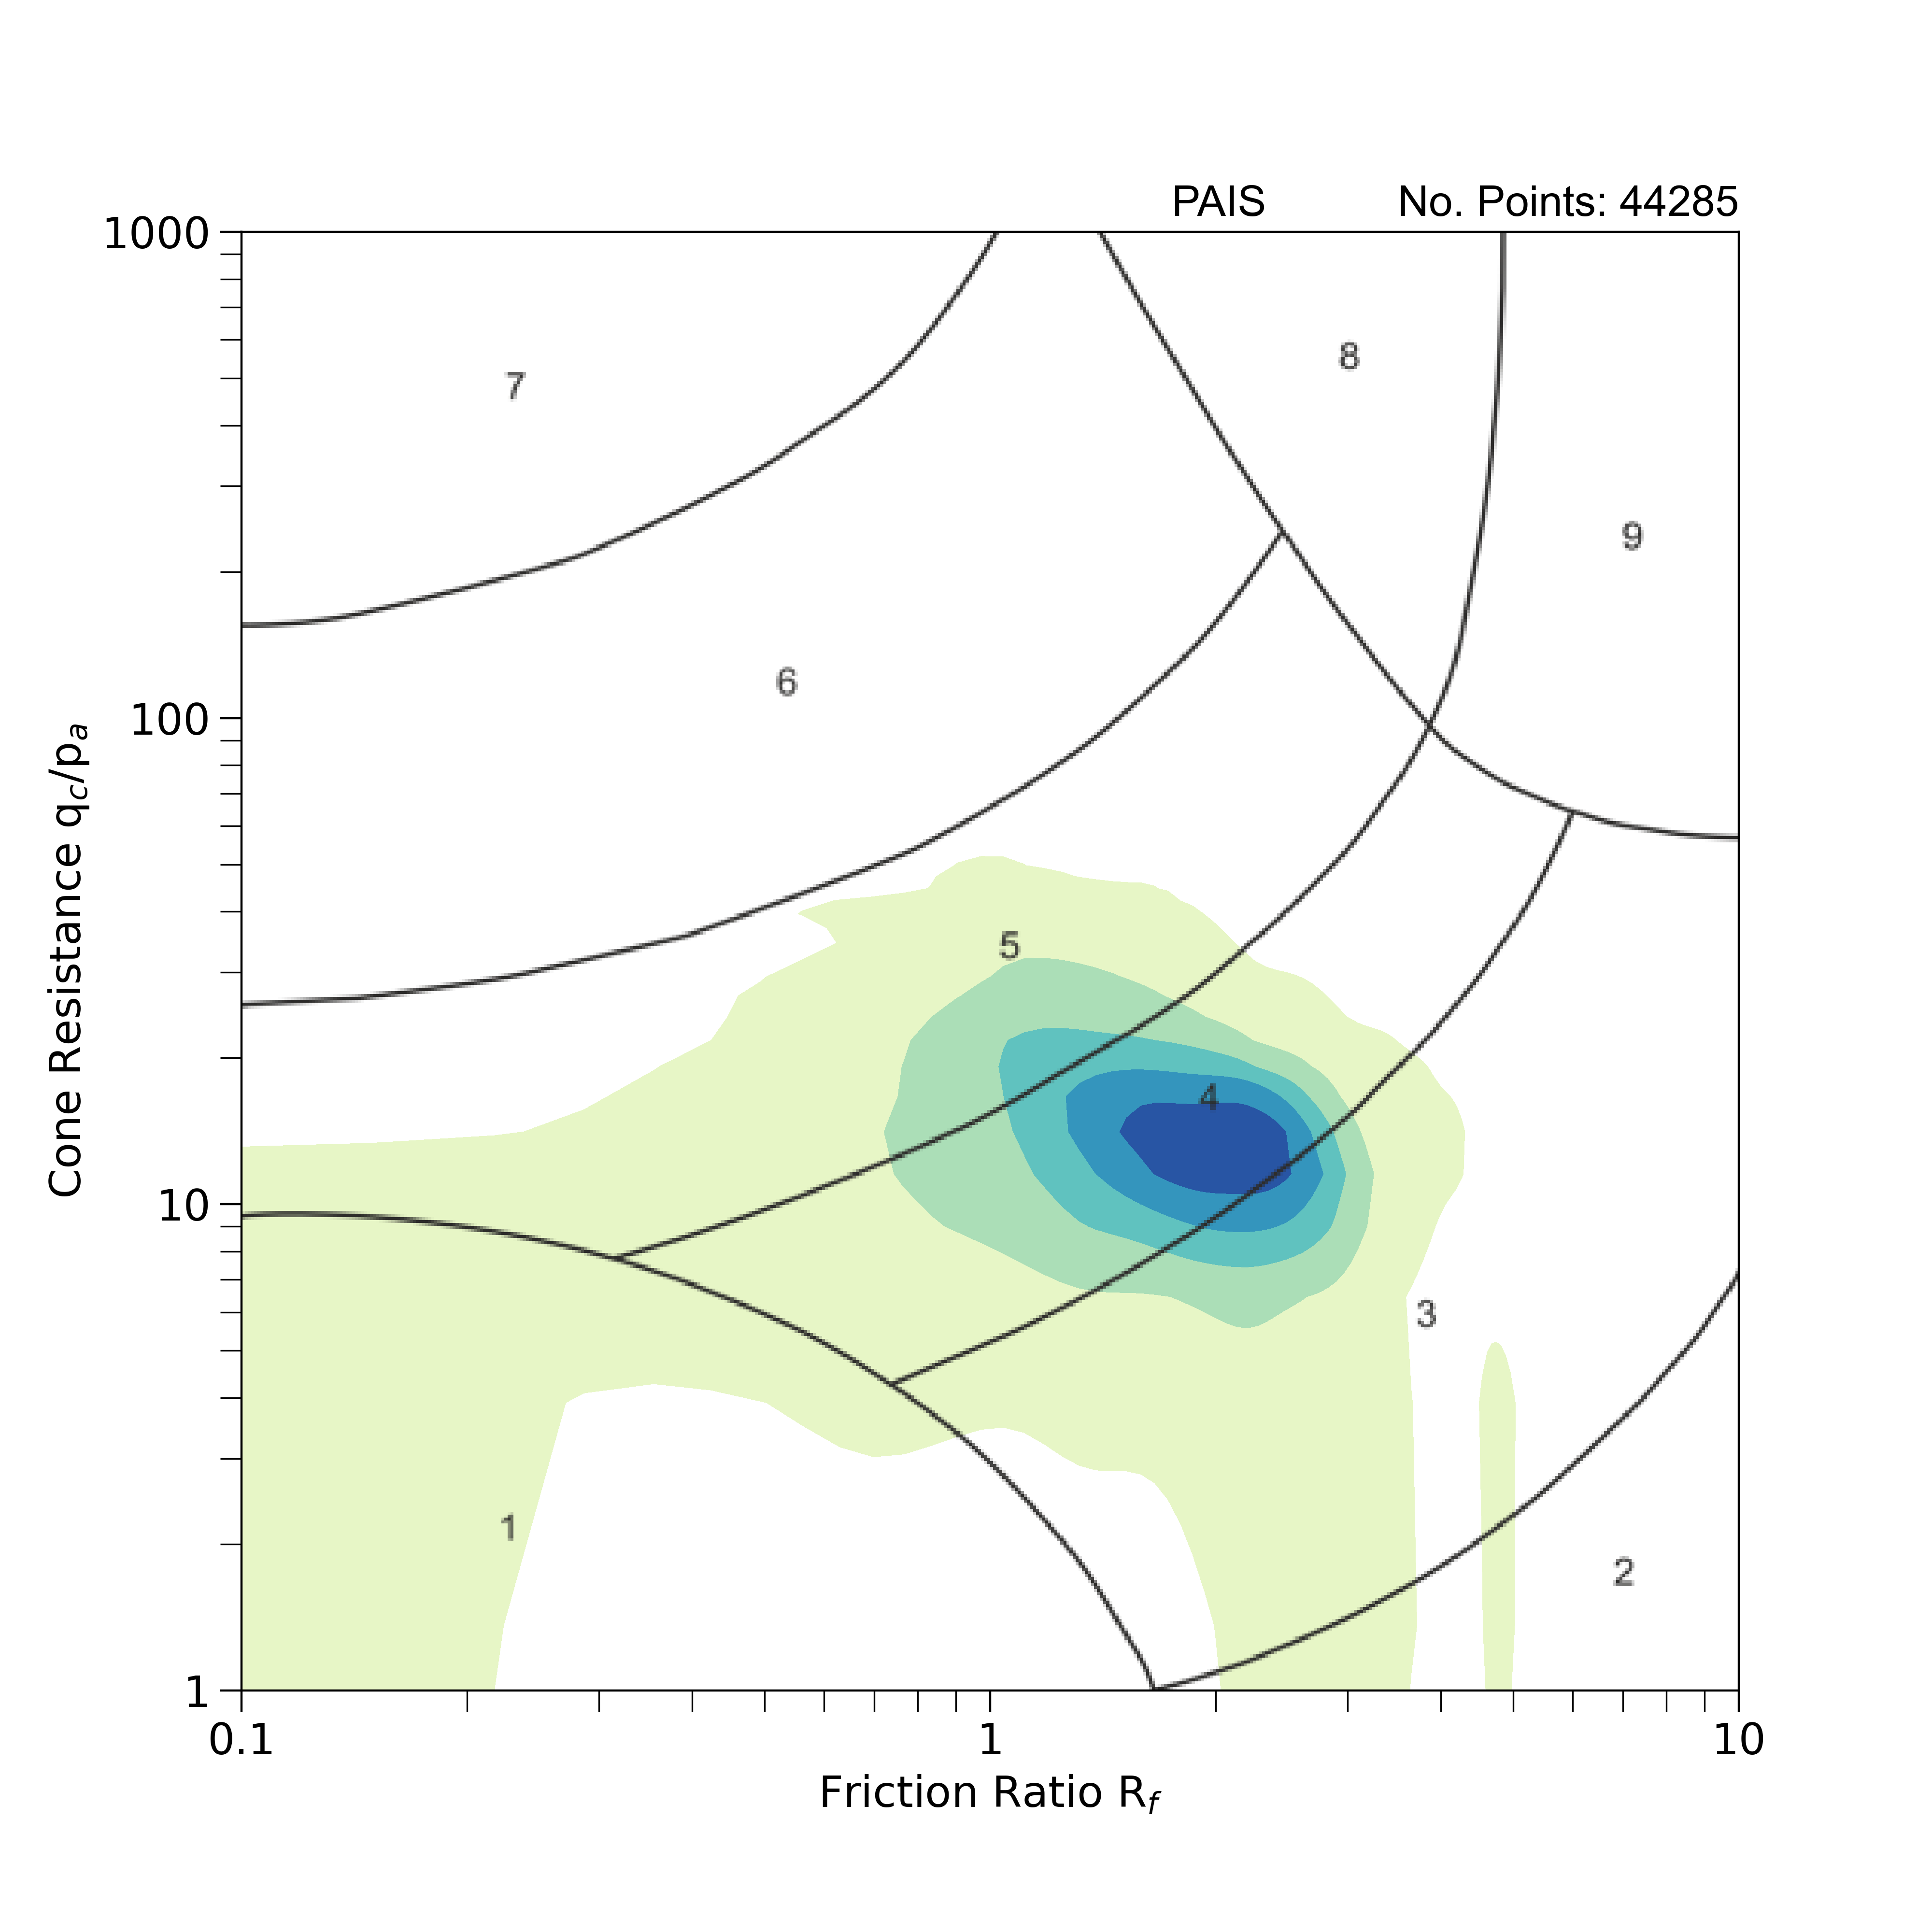
Geotechnical properties: strength tests
Non-normalised soil behaviour type chart after Robertson (2010) with 2D kernel density estimation of dimensionless cone resistance and friction ratio obtained from cone penetration tests. 1: sensitive fine-grained; 2: clay — organic soil; 3: clays — clay to silty clay; 4: silt mixtures — clayey silt and silty clay; 5: sand mixtures — silty sand to sandy silt; 6: sands — cleans sands to silty sands; 7: dense sand to gravelly sand; 8: stiff sand to clayey sand (overconsolidated or cemented); 9: stiff fine-grained (overconsolidated or cemented). BGS © UKRI.
Peat (PEAT)
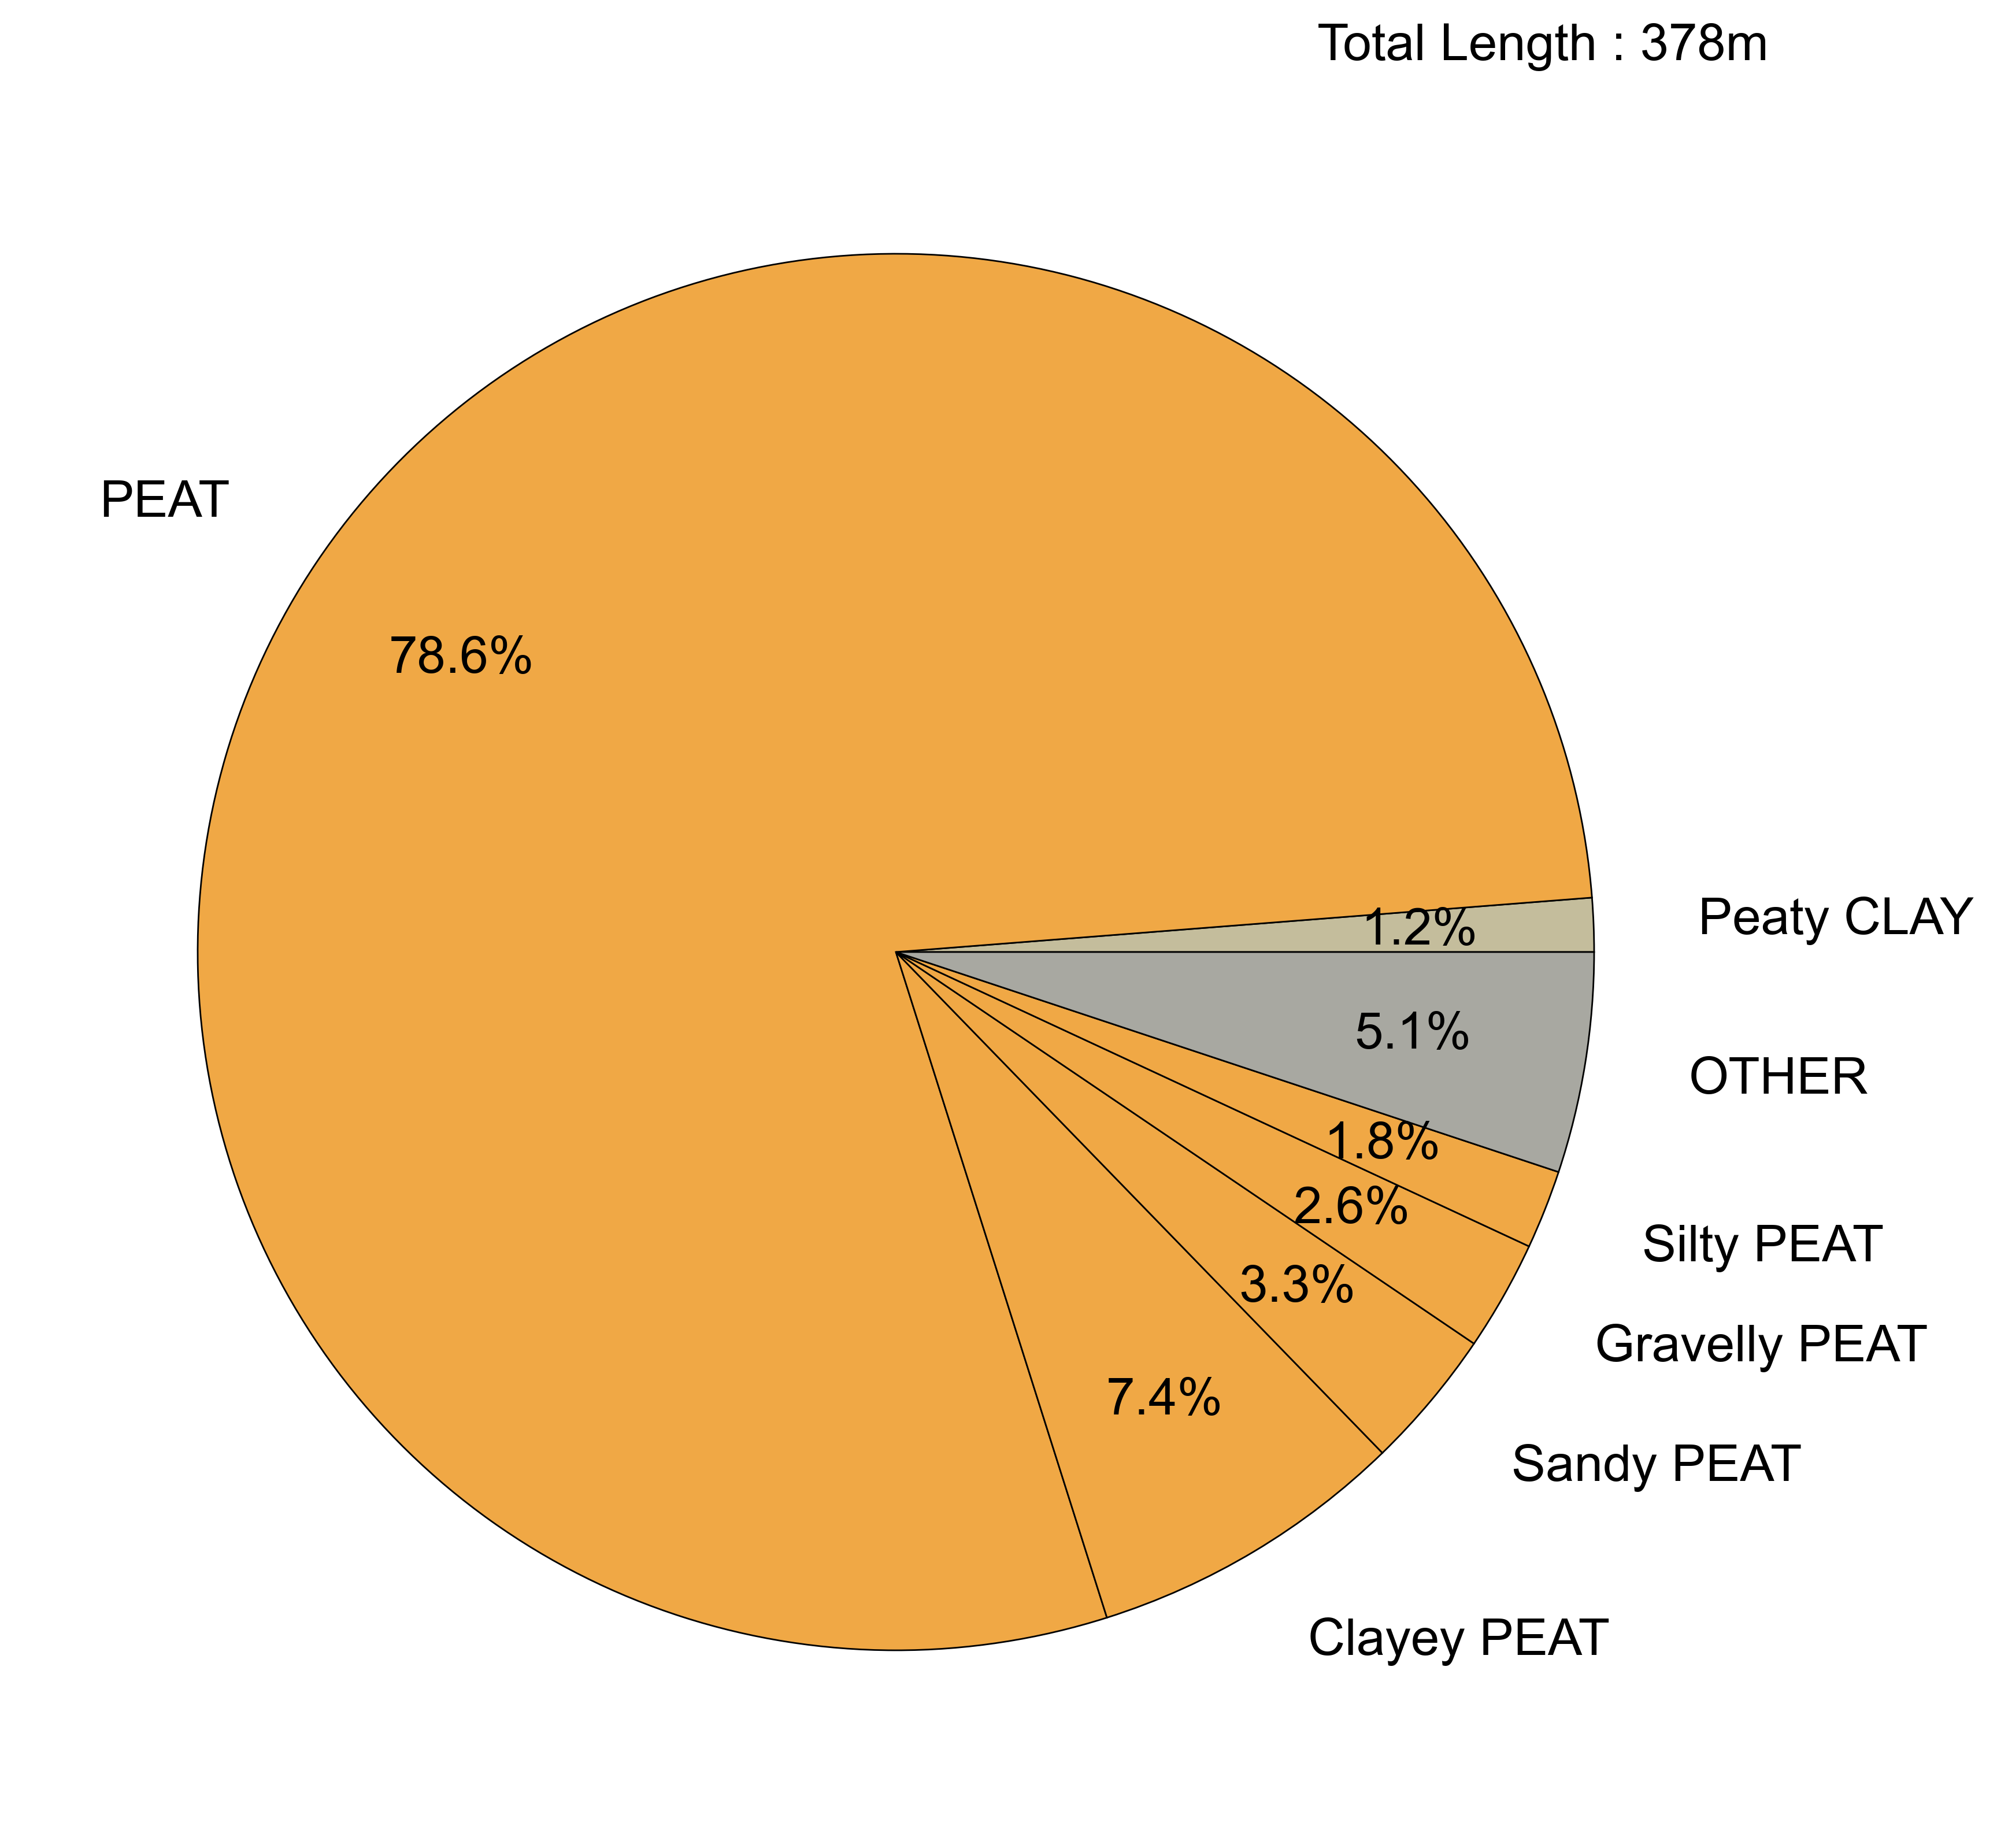
Geological descriptions
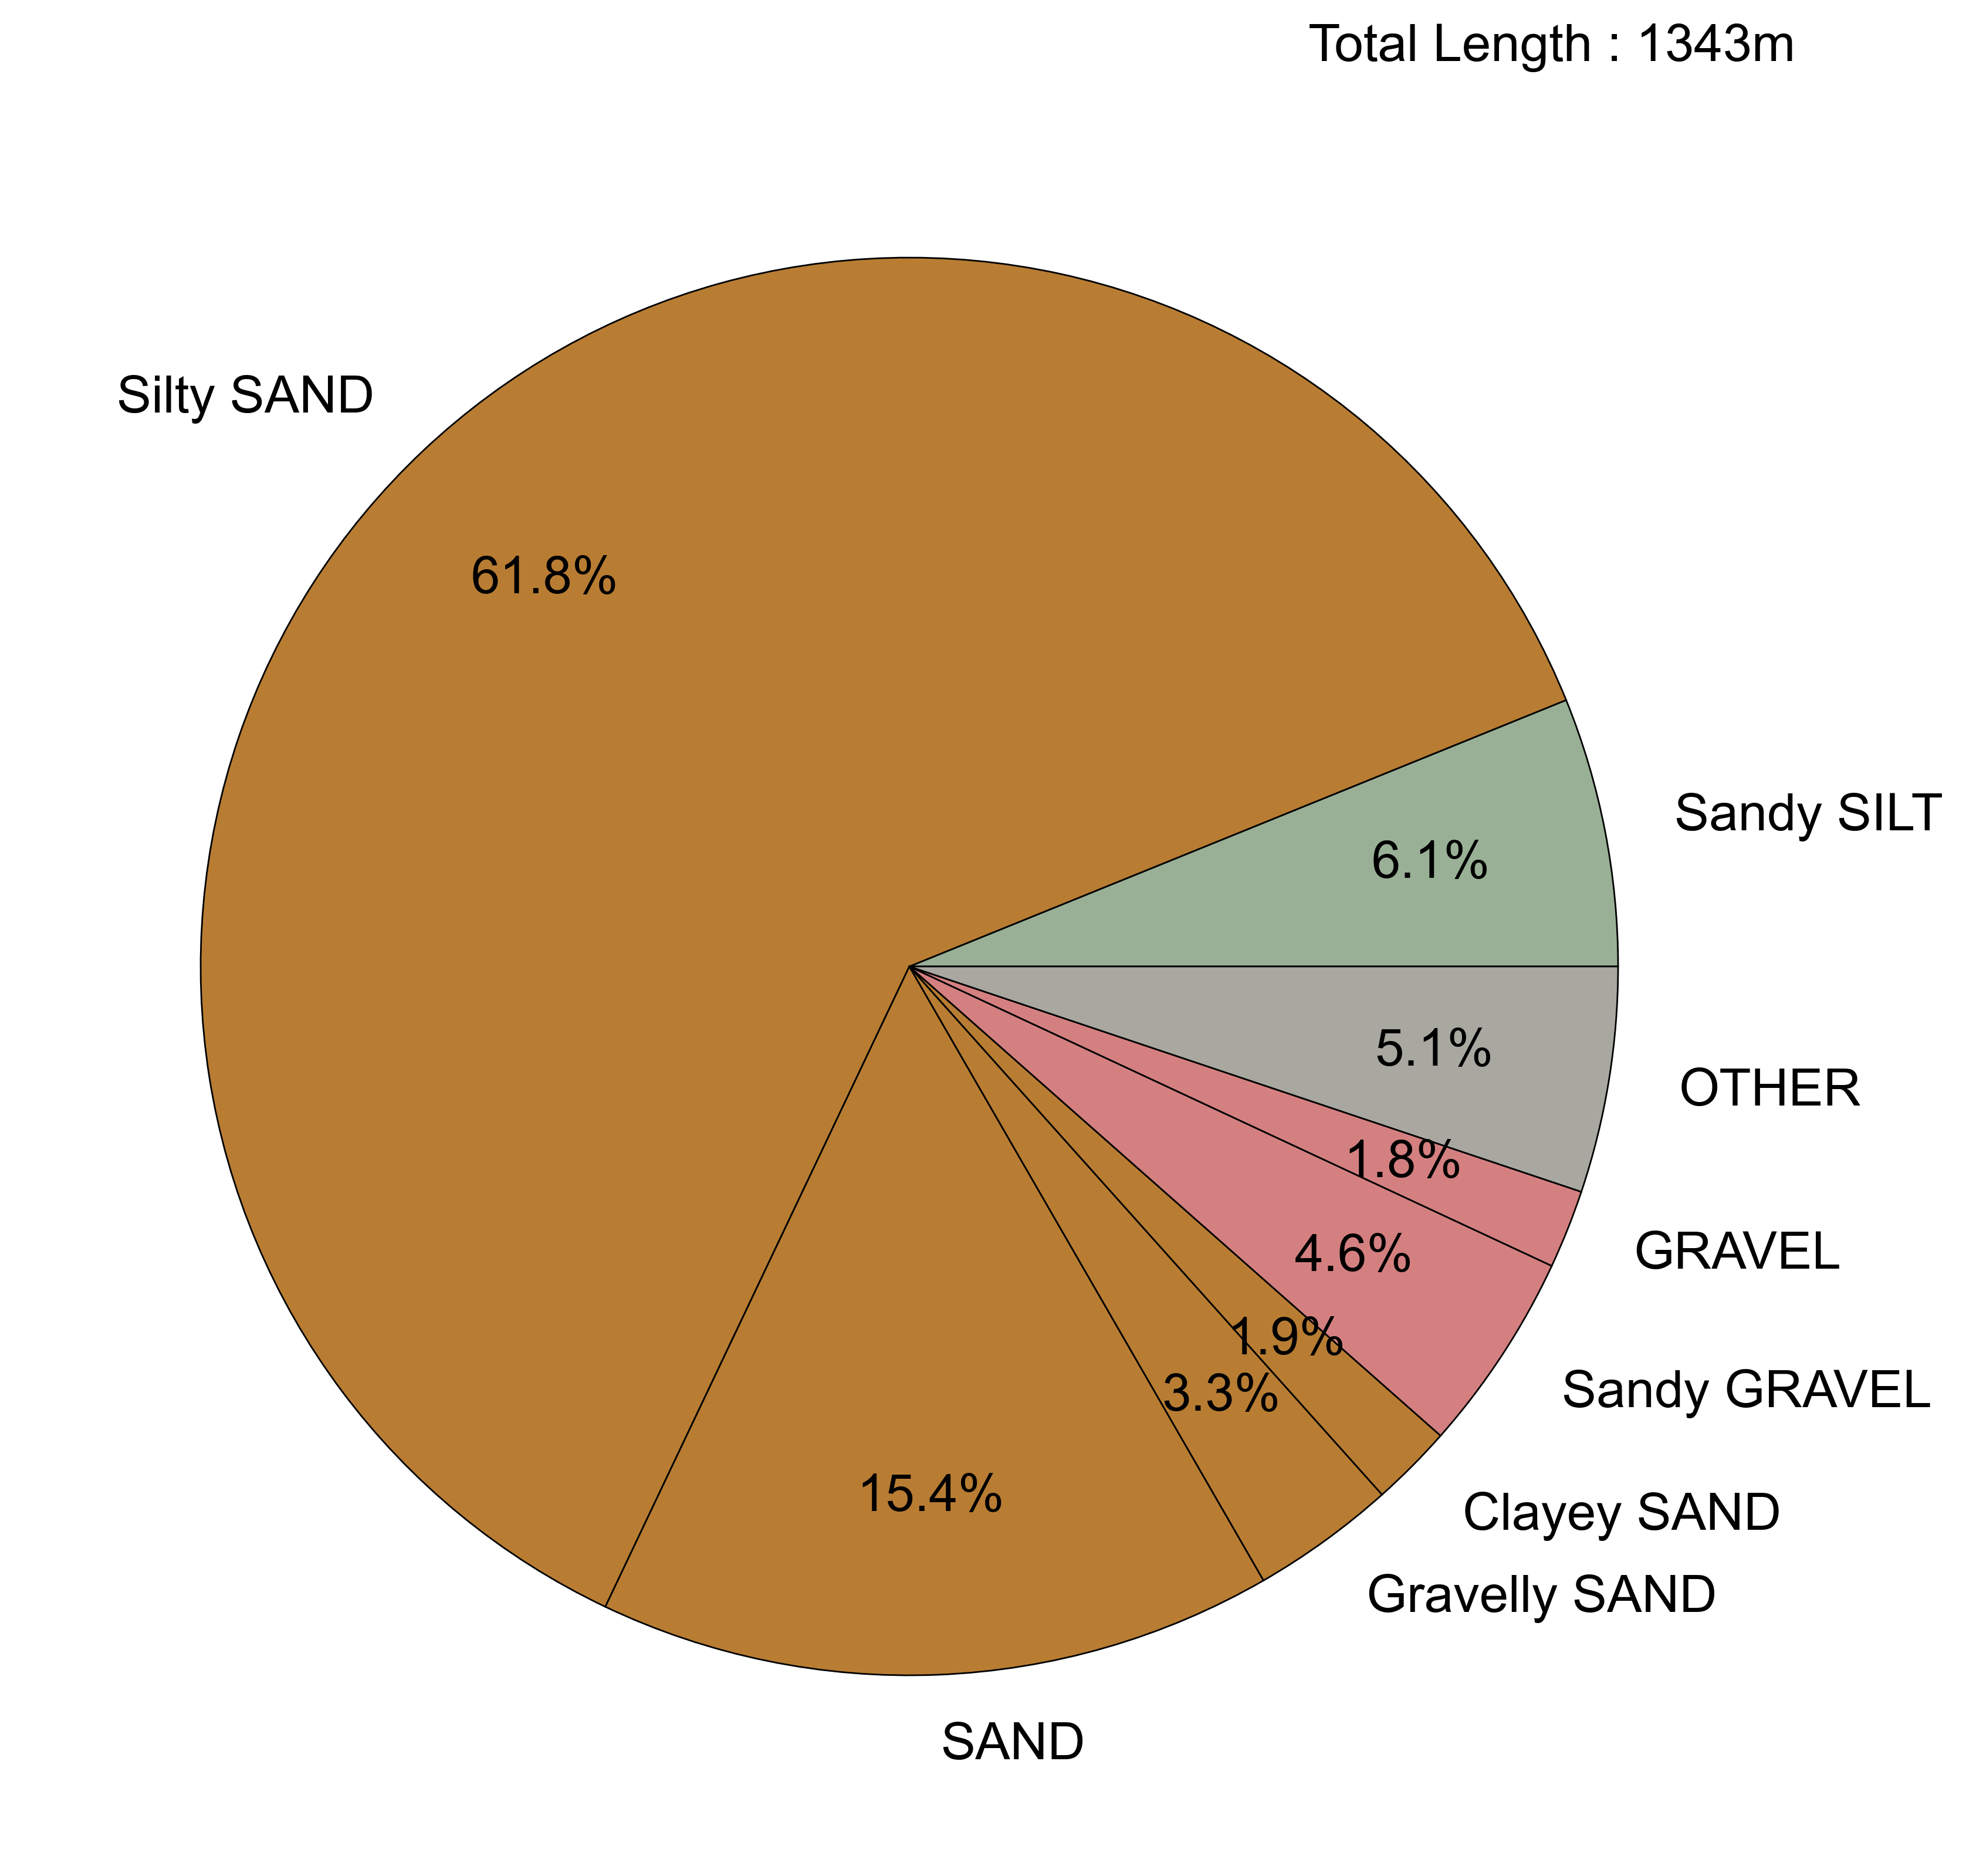
Pie chart summarising the dominant soil types (primary and secondary constituents) described in exploratory hole logs based on total metres logged. Descriptions have been simplified to remove tertiary constituents and a threshold of 1 per cent applied to aid graphical presentation. Soil types representing less than 1 per cent of the total logged are included in the ‘other’ category. BGS © UKRI.
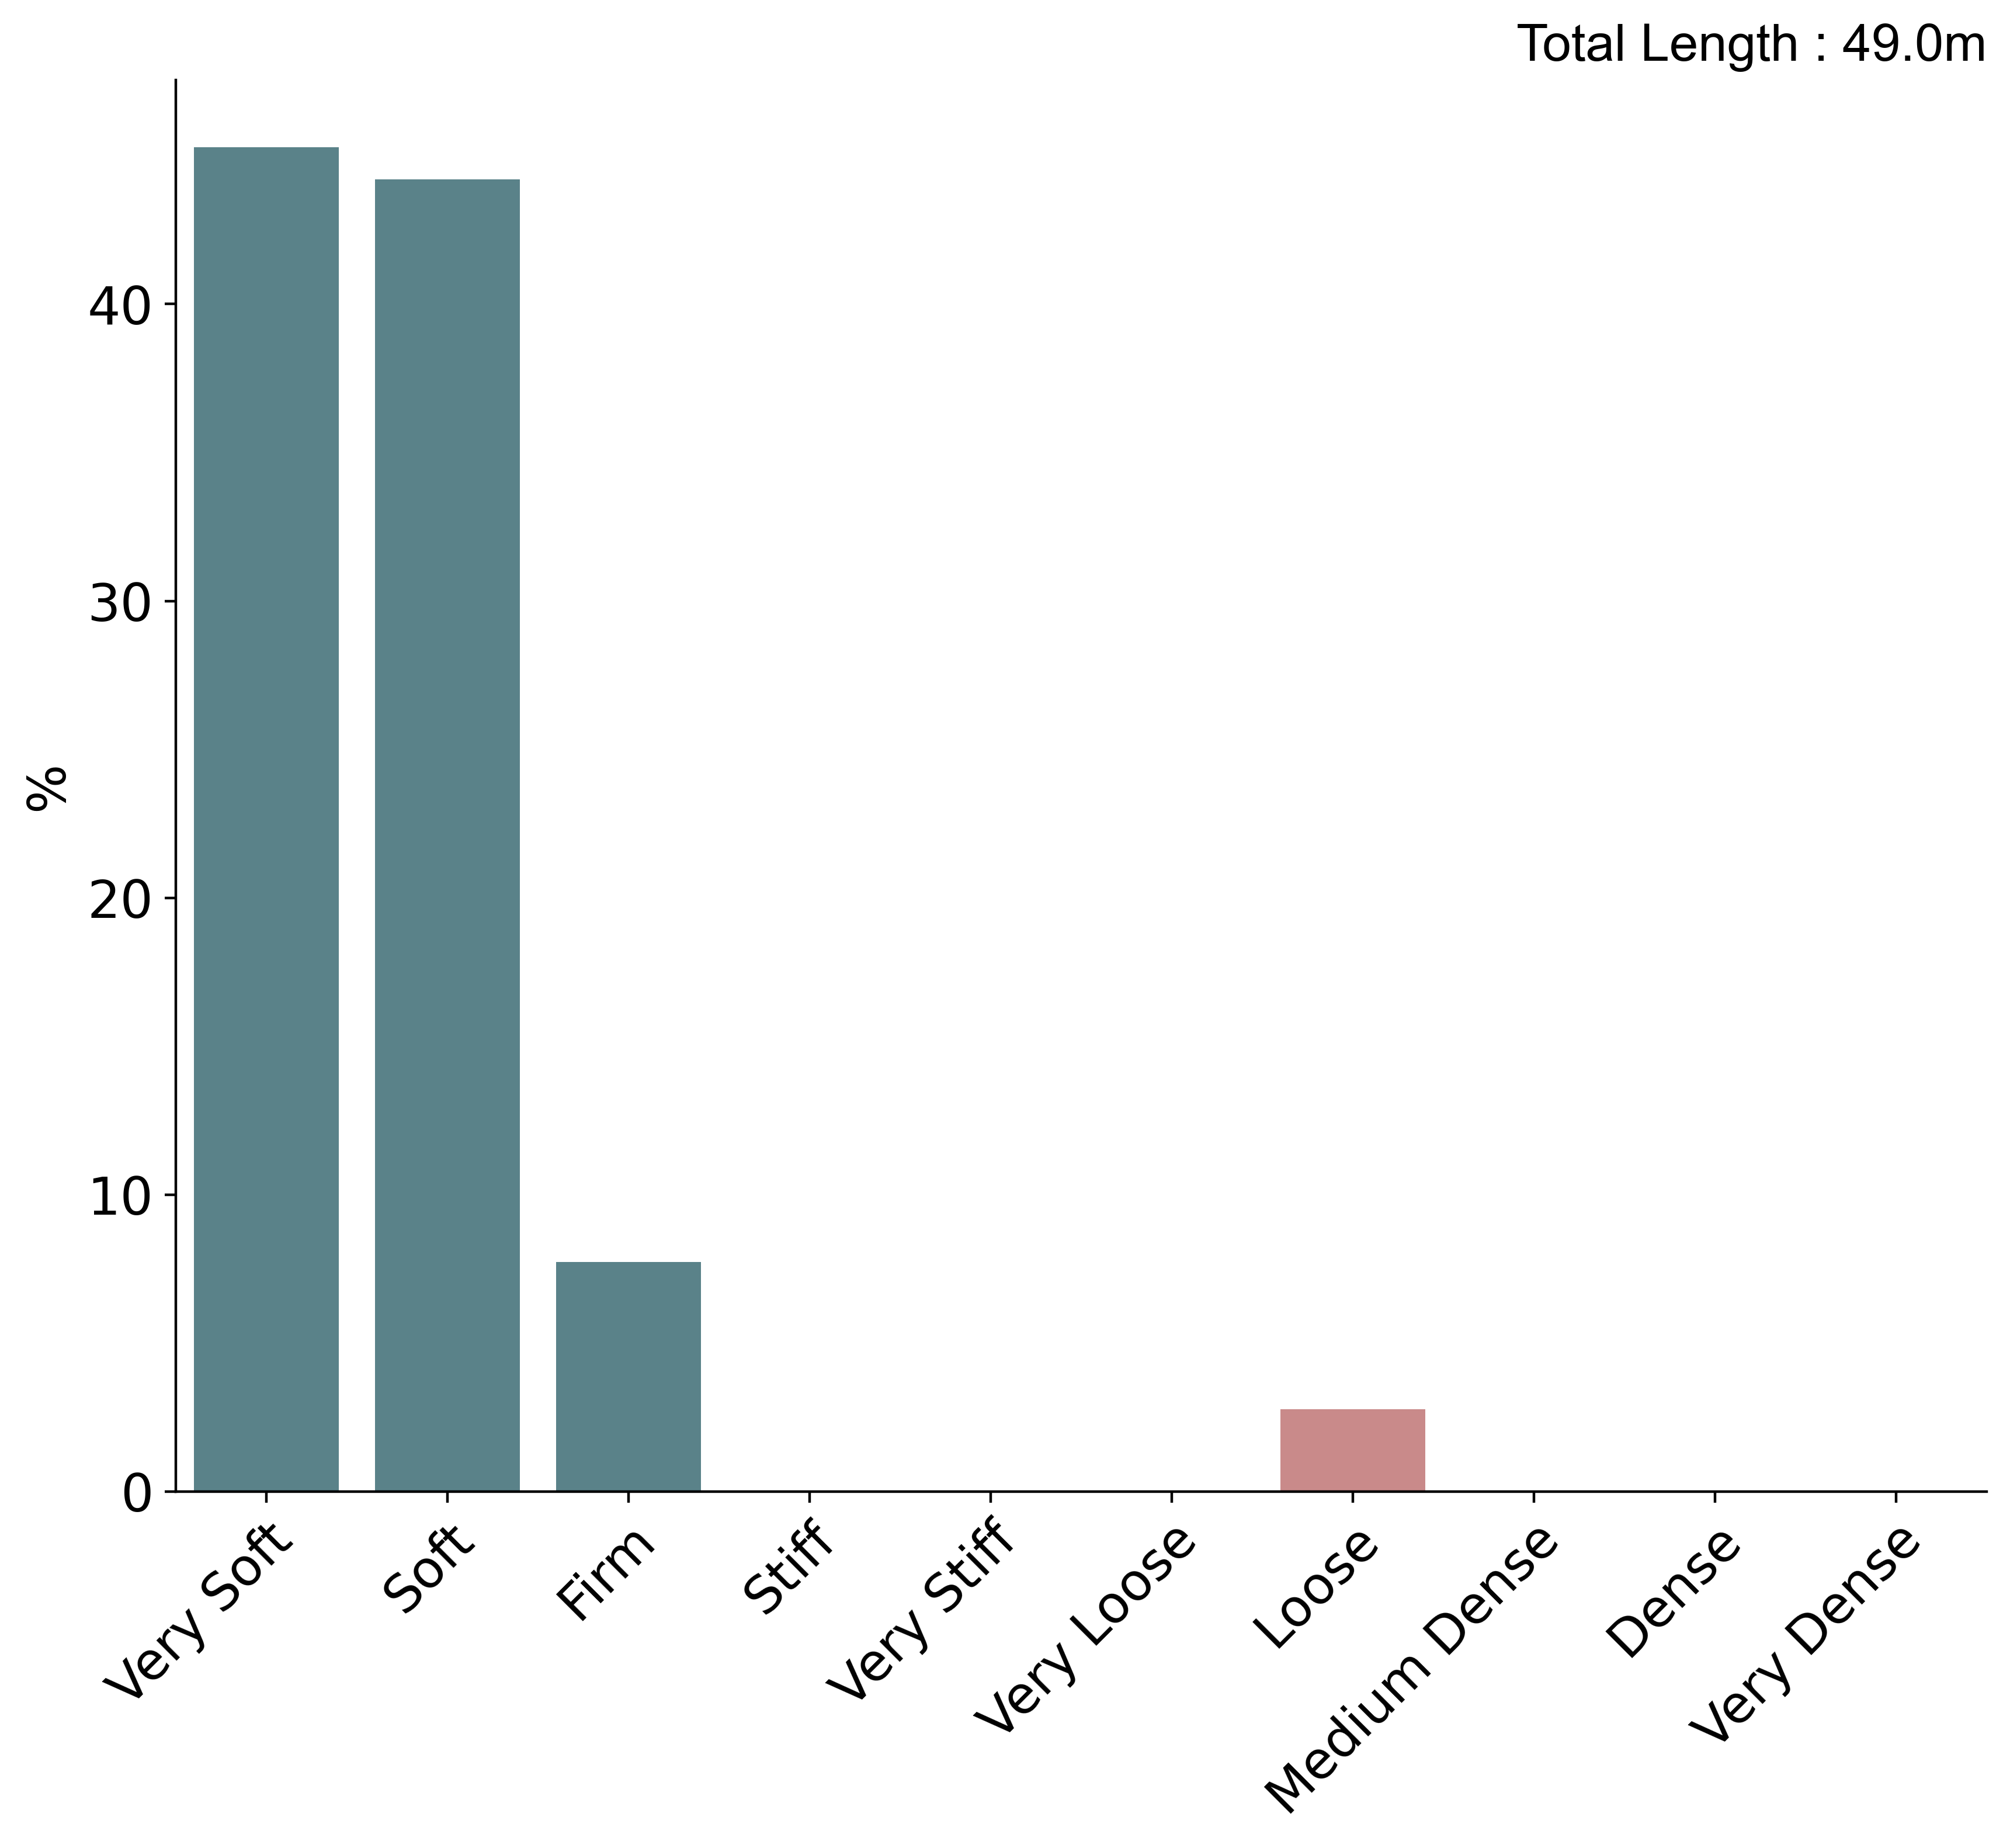
Geological descriptions
Histogram summarising the consistency and relative density described in exploratory hole logs based on total metres logged. BGS © UKRI.
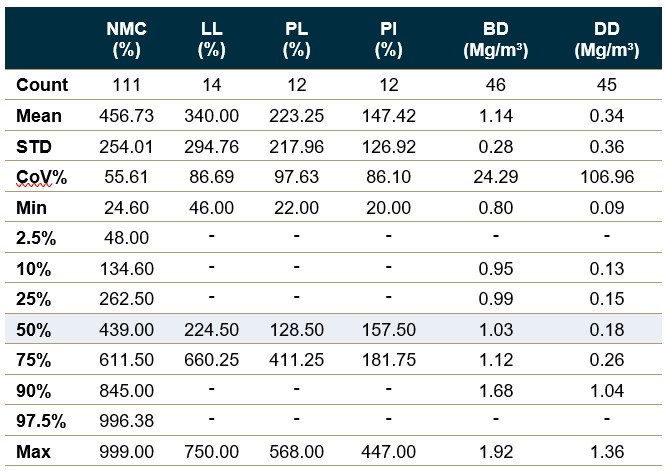
Geotechnical properties: classification tests
Statistical summaries of geotechnical index properties from laboratory tests. STD – standard deviation; CoV% – coefficient of variation; NMC – natural moisture content; LL – liquid limit; PL – plastic limit; PI – plasticity index; BD – bulk density; DD – dry density. Percentiles reported based on sample size; no summaries are provided where there are fewer than 5 samples. BGS © UKRI.
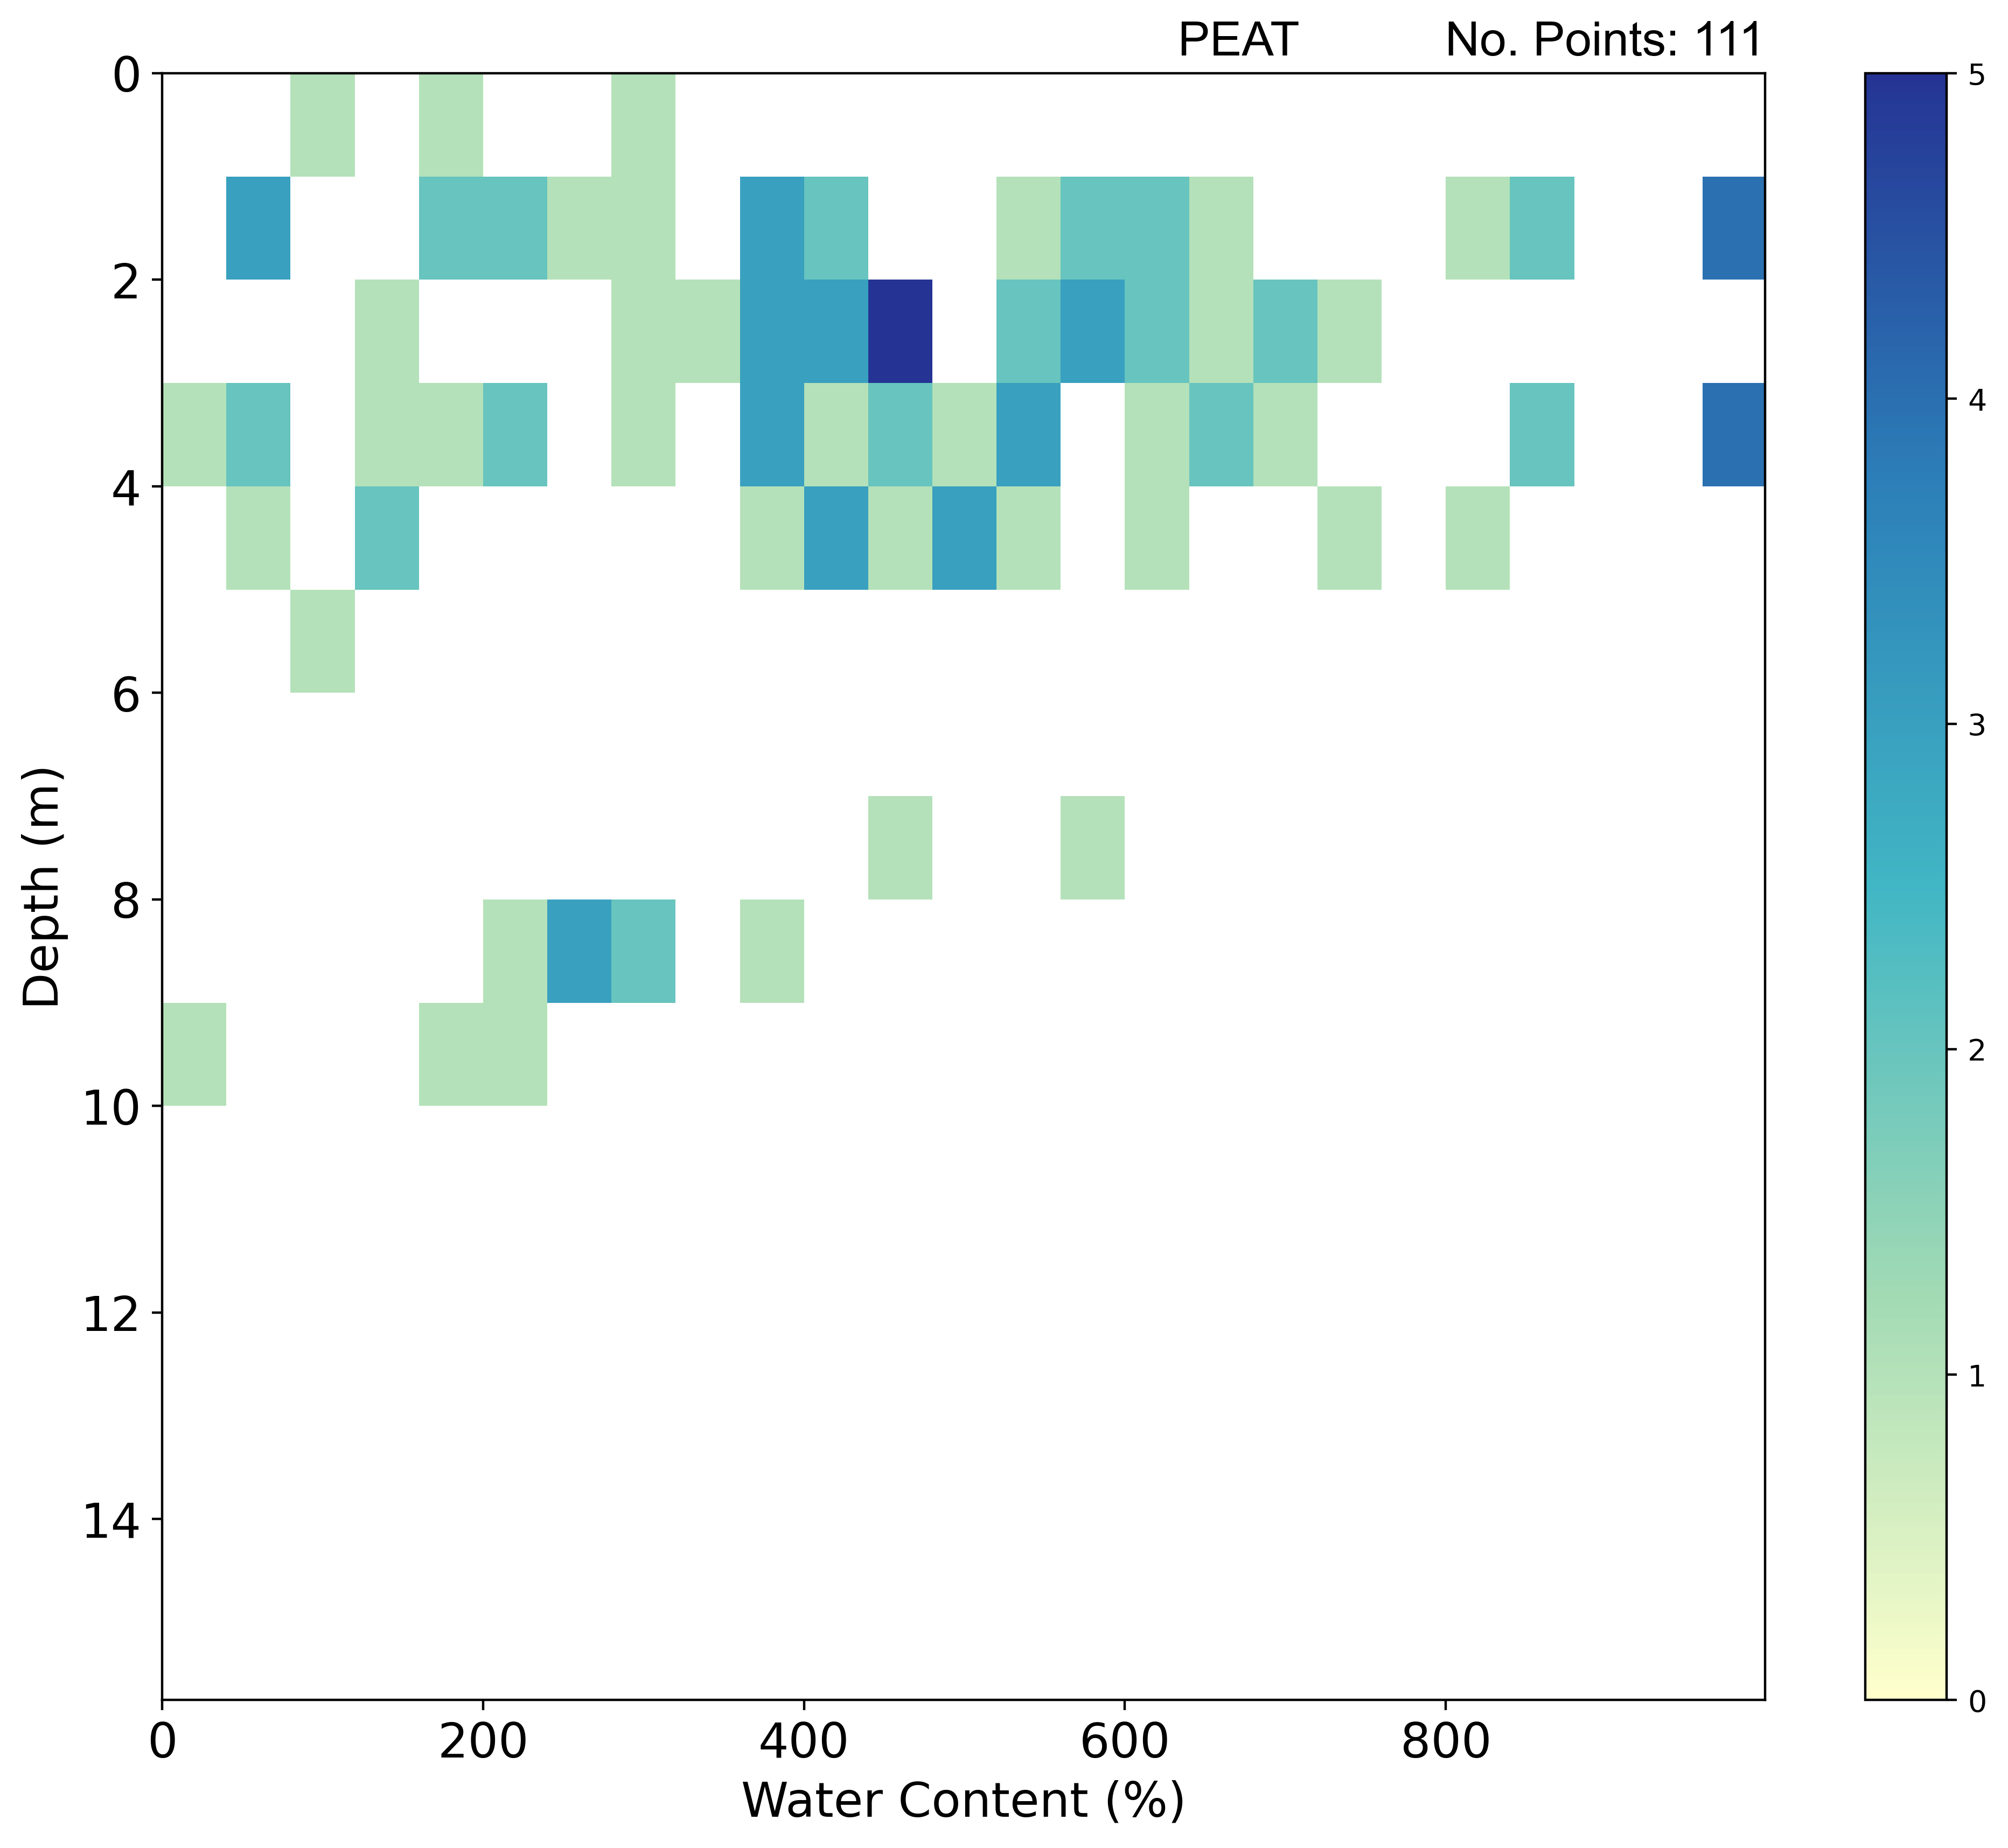
Geotechnical properties: classification tests
2D histogram plot summarising water content with depth. BGS © UKRI.
Geotechnical properties: classification tests
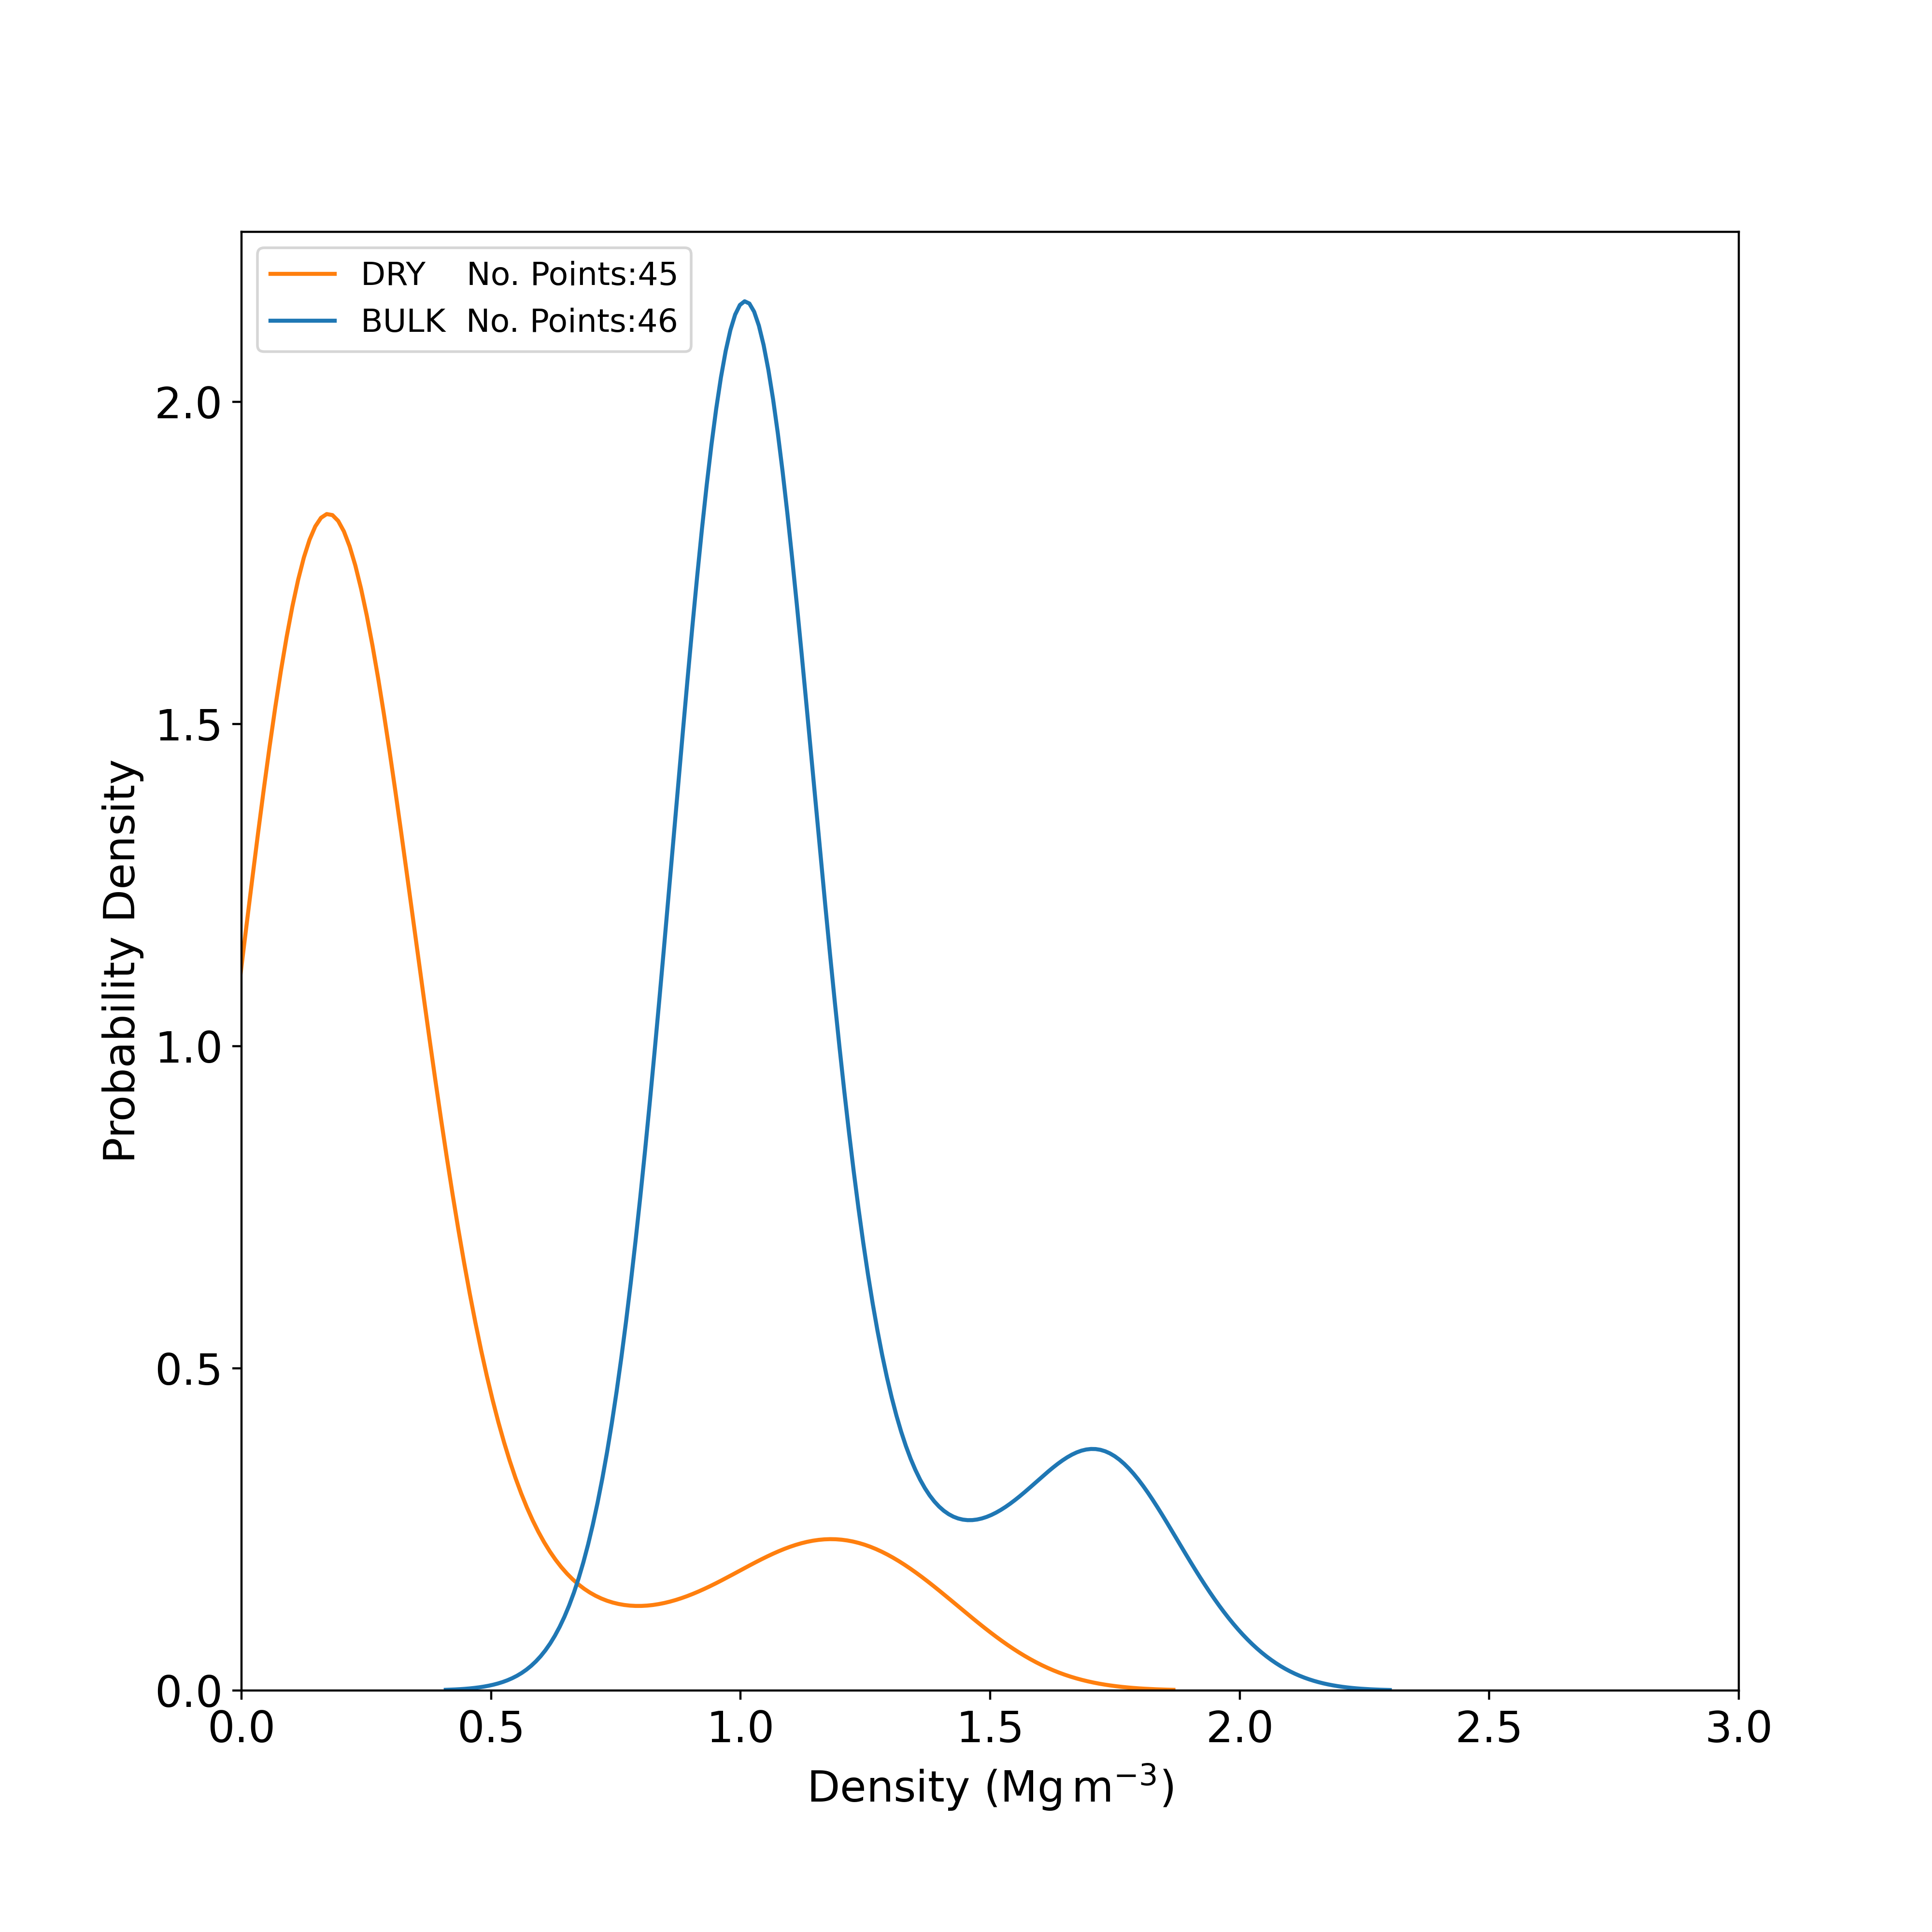
Kernel density plot showing the distribution of bulk density and dry density results obtained from laboratory tests. BGS © UKRI.
Geotechnical properties: strength tests
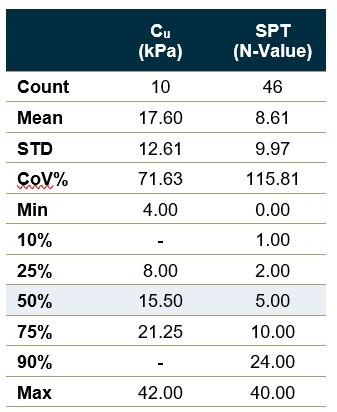
Statistical summaries of geotechnical strength properties from laboratory and in situ tests. STD – standard deviation; CoV% – coefficient of variation; Cu – undrained shear strength obtained from unconsolidated undrained triaxial tests; SPT – standard penetration test (number of tests with N-value > 50 or with no N-value = 4) . Percentiles reported based on sample size; no summaries are provided where there are fewer than 5 samples. BGS © UKRI
Geotechnical properties: strength tests
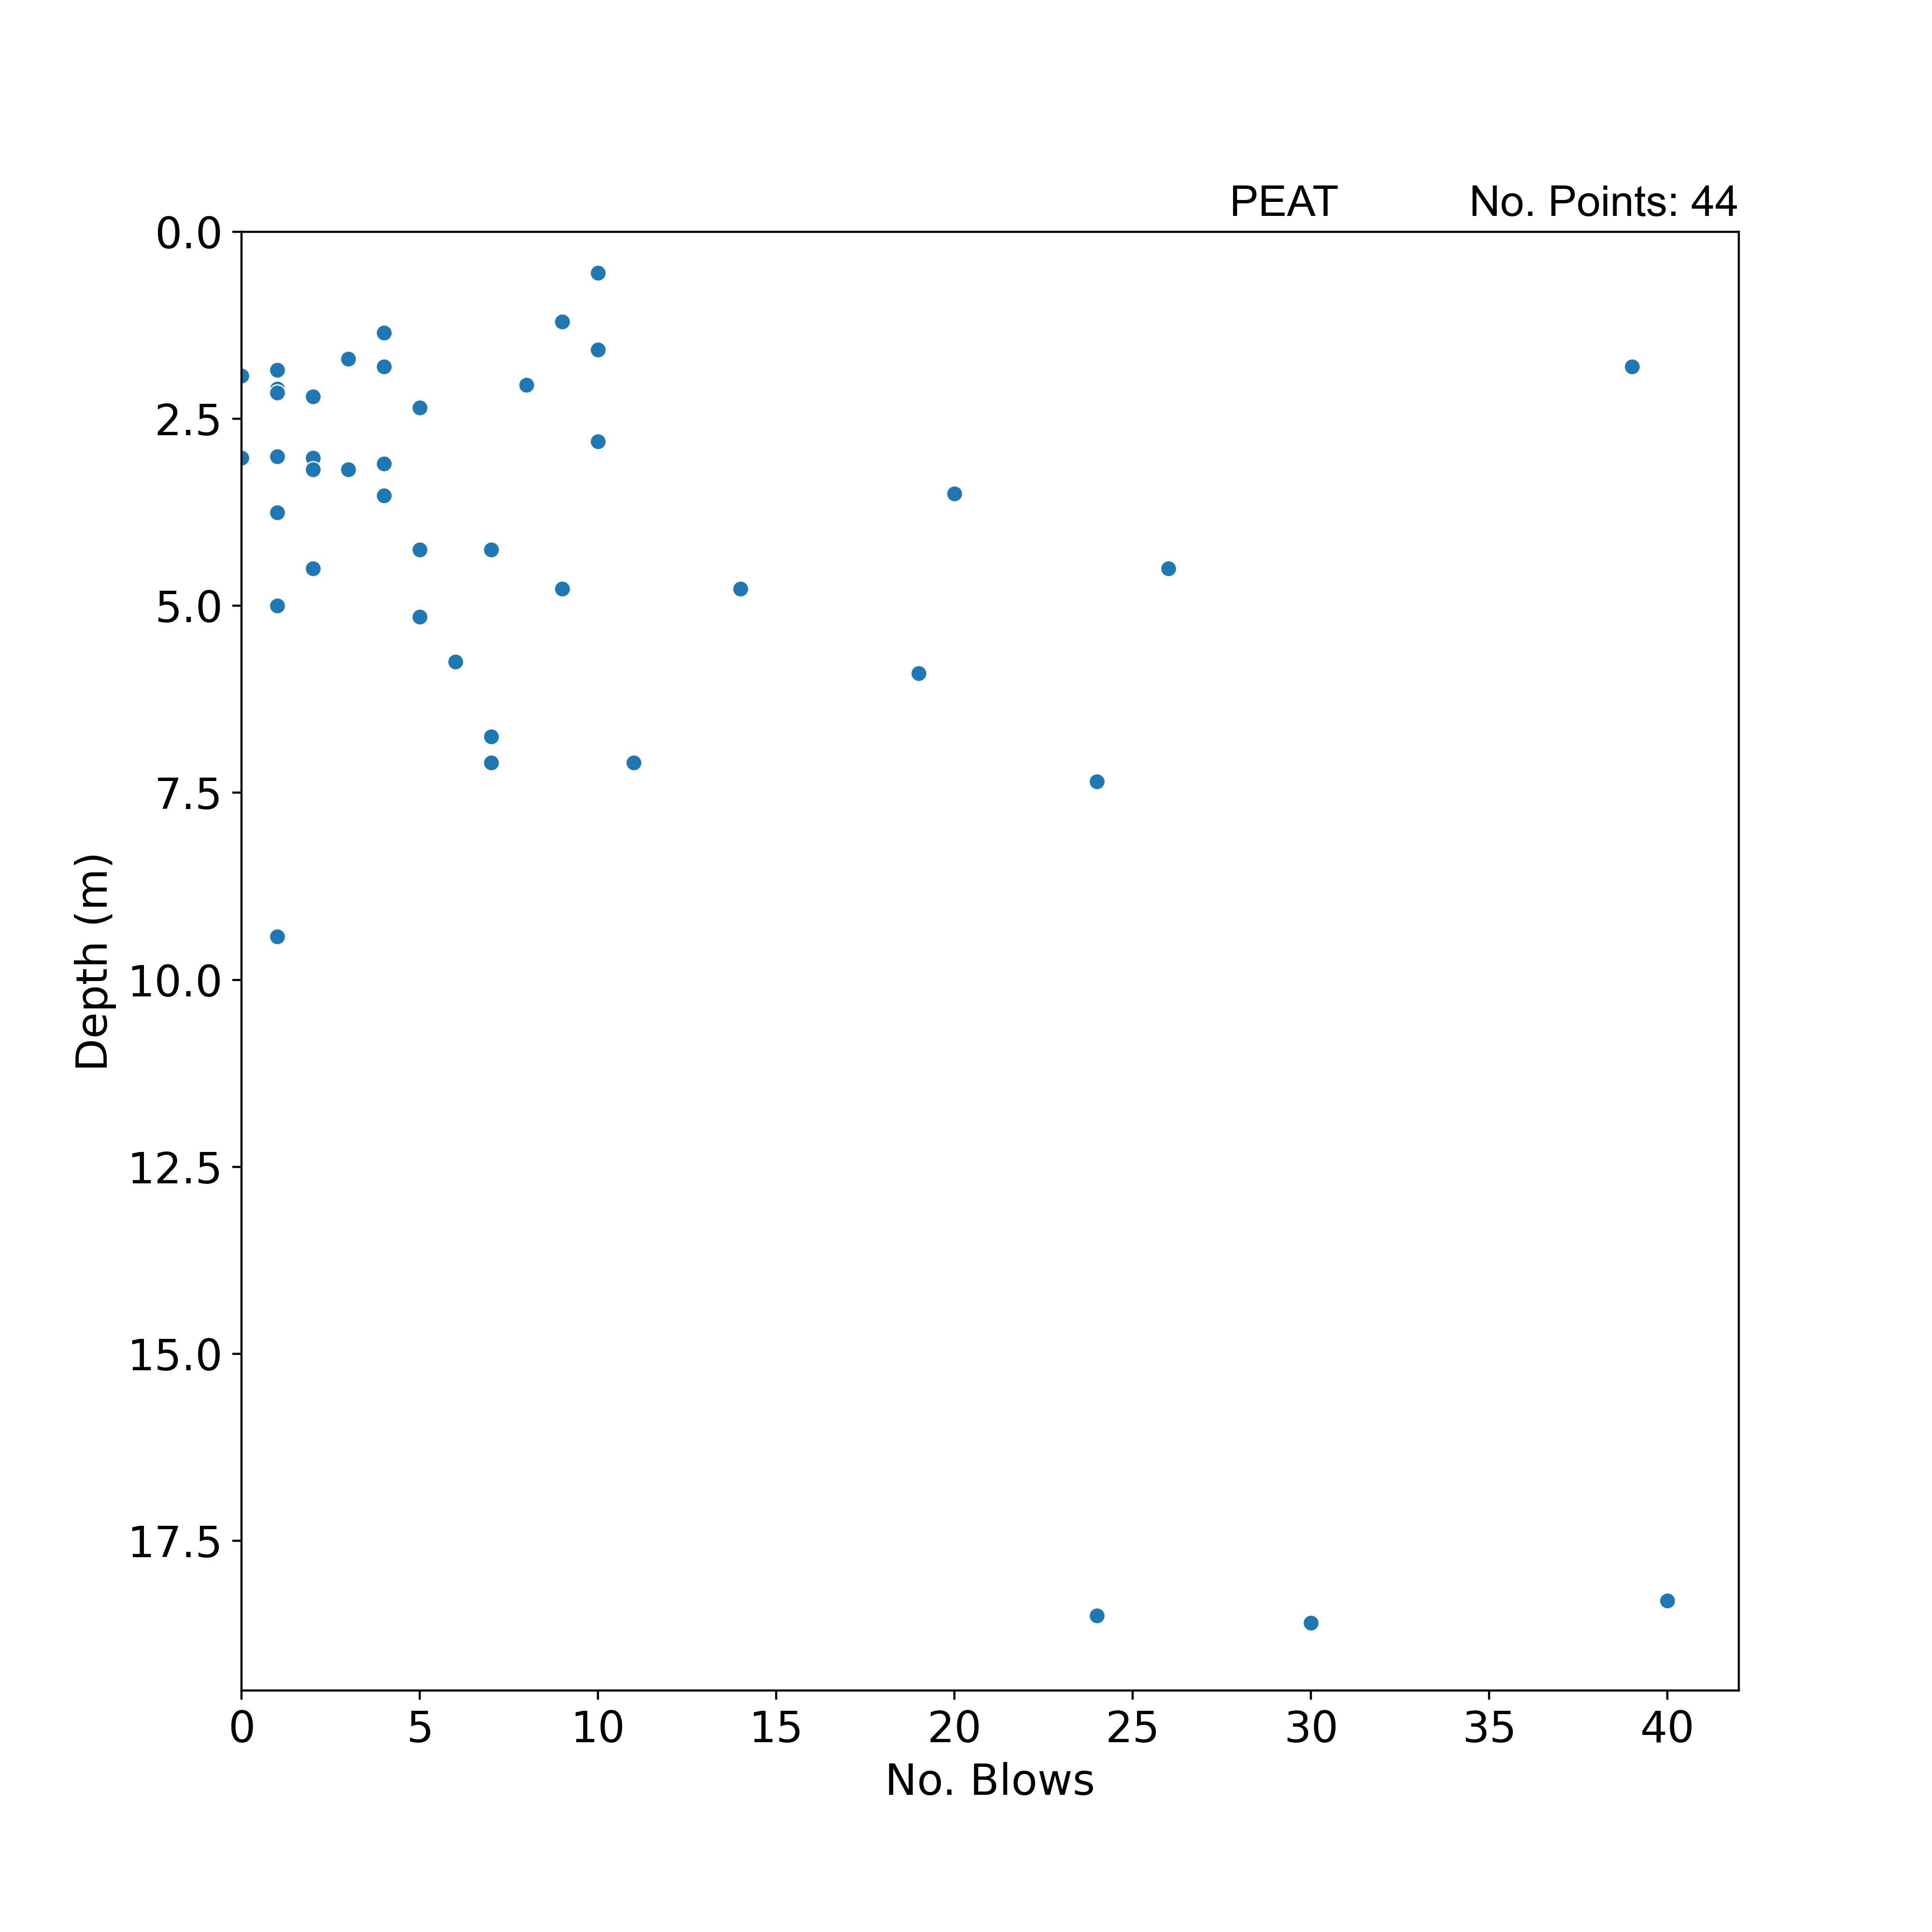
Scatter plot summarising SPT N-value results with depth. Number of tests with N-value > 50 or with no N-value = 4. BGS © UKRI.
Ross Sand Member (RSSA)
Geological descriptions
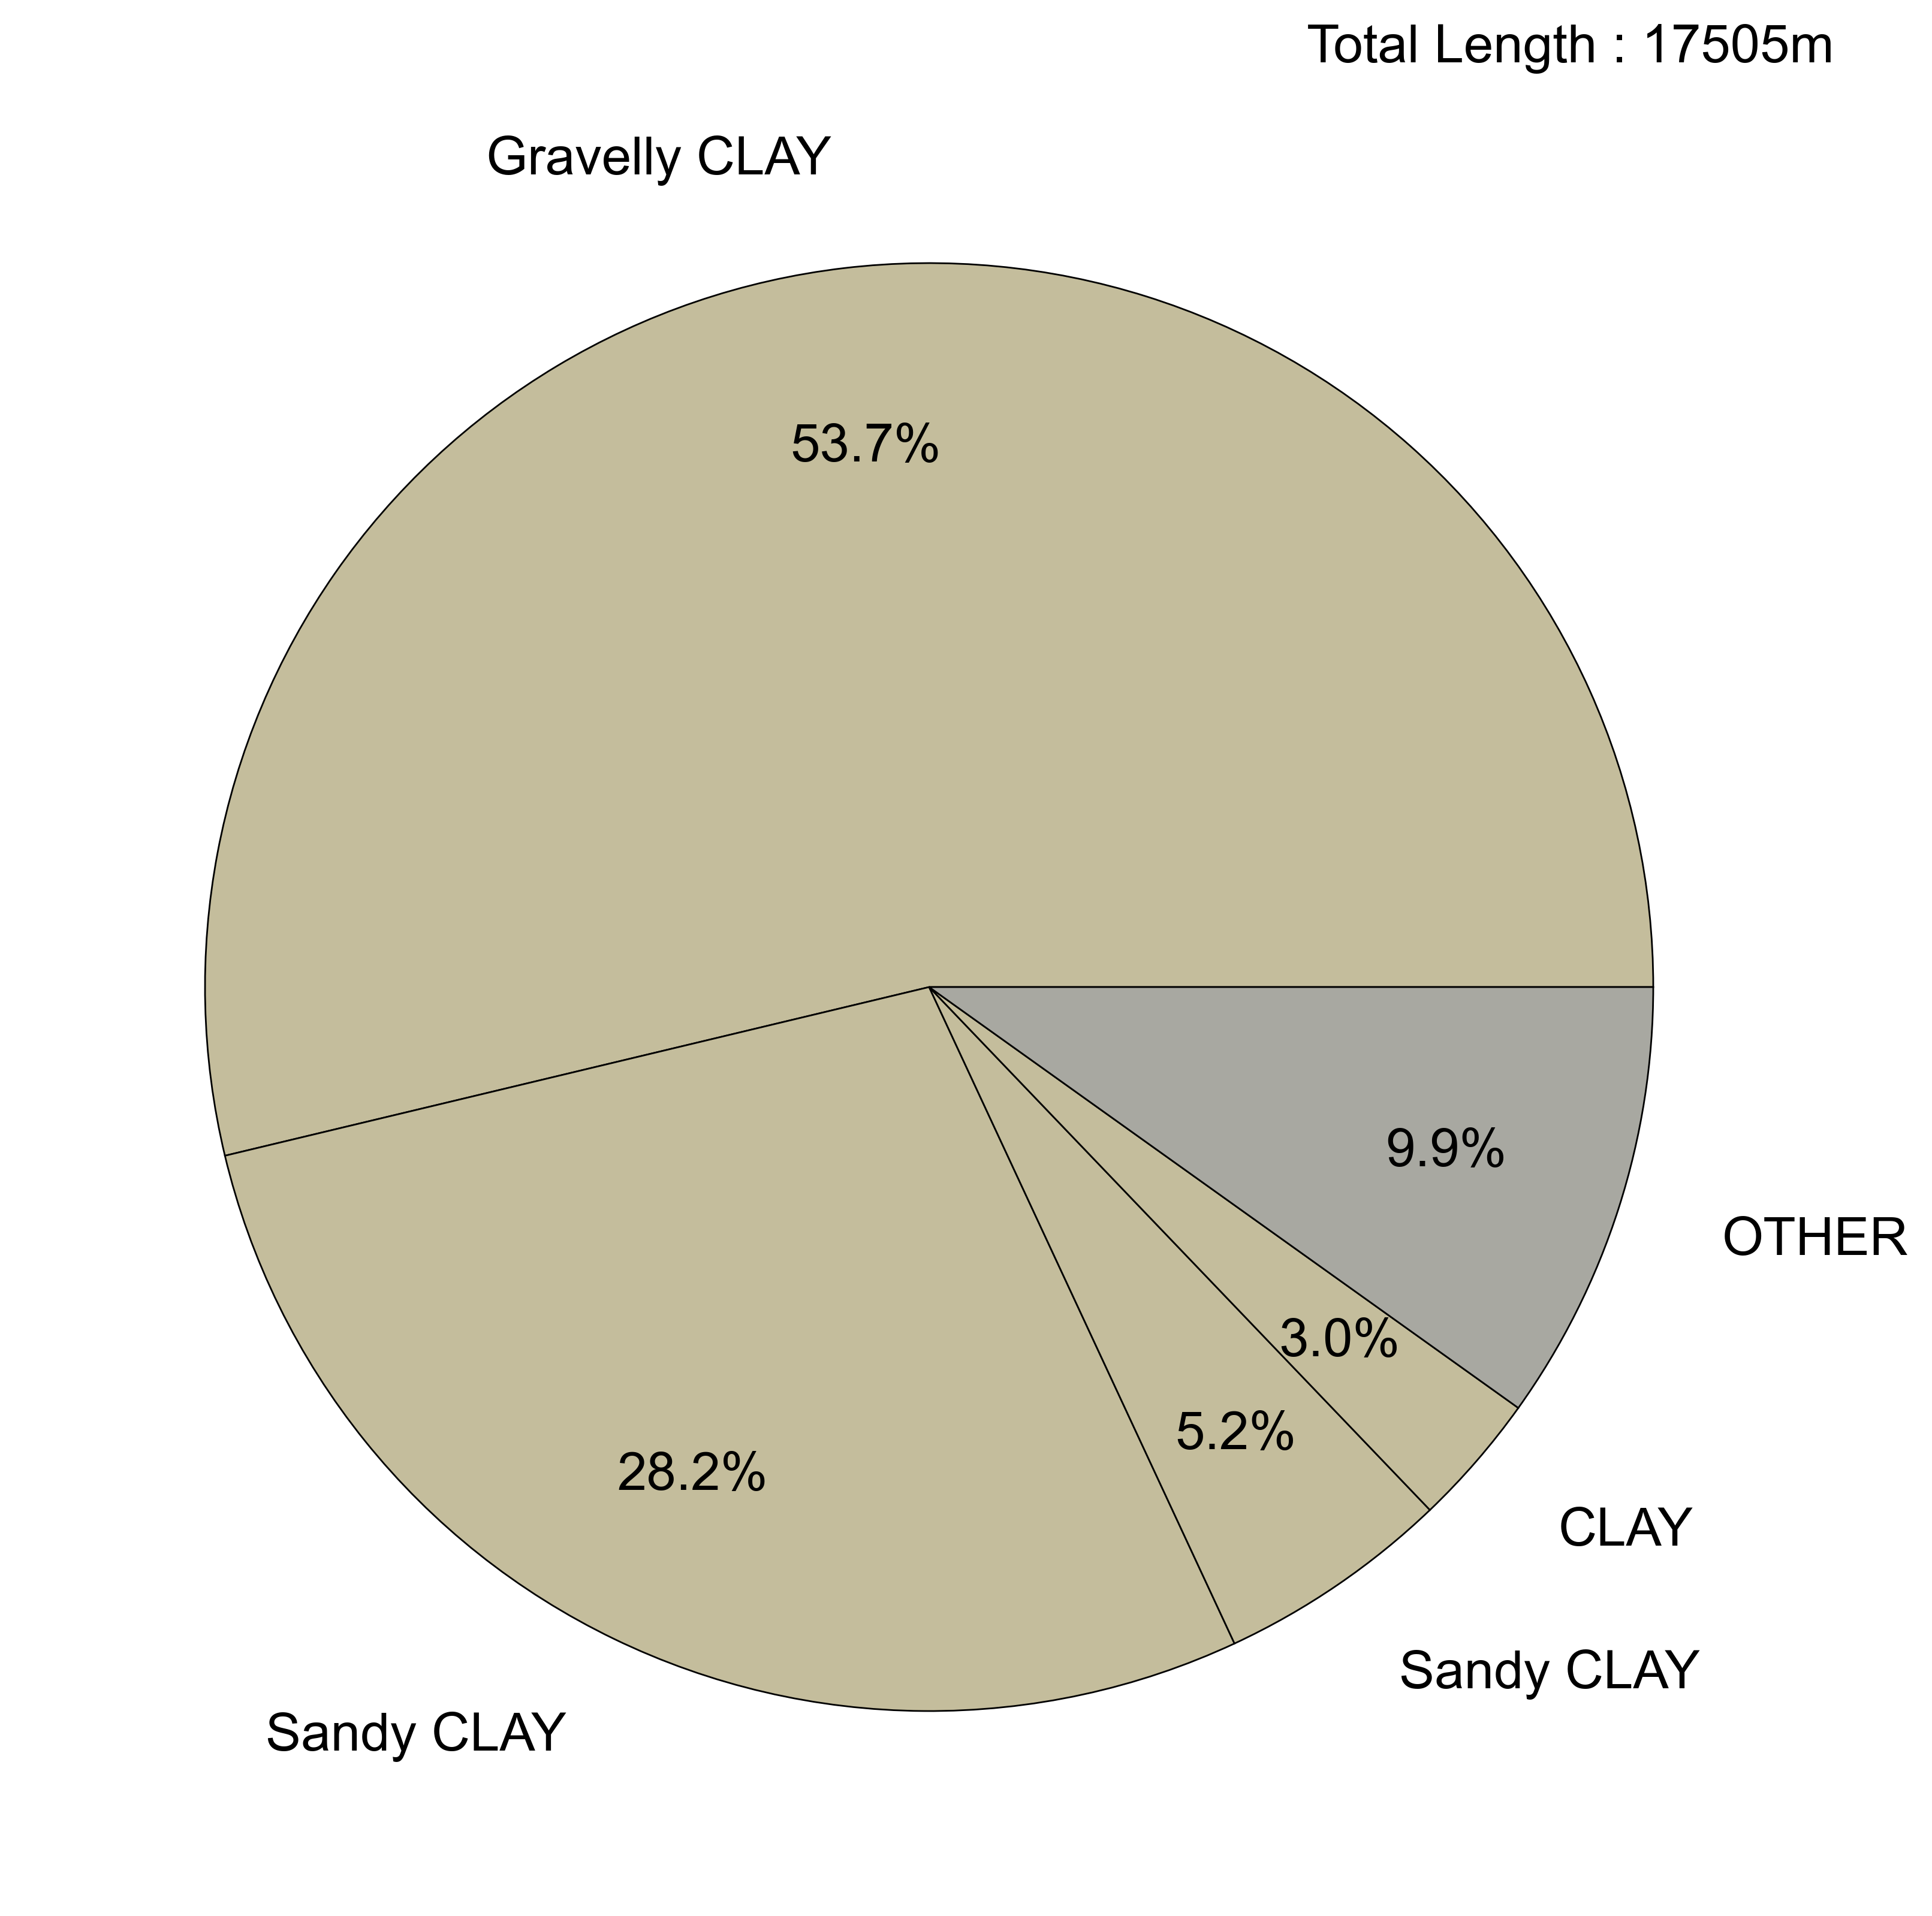
Pie chart summarising the dominant soil types (primary and secondary constituents) described in exploratory hole logs based on total metres logged. Descriptions have been simplified to remove tertiary constituents and a threshold of 1 per cent applied to aid graphical presentation. Soil types representing less than 1 per cent of the total logged are included in the ‘other’ category. BGS © UKRI.
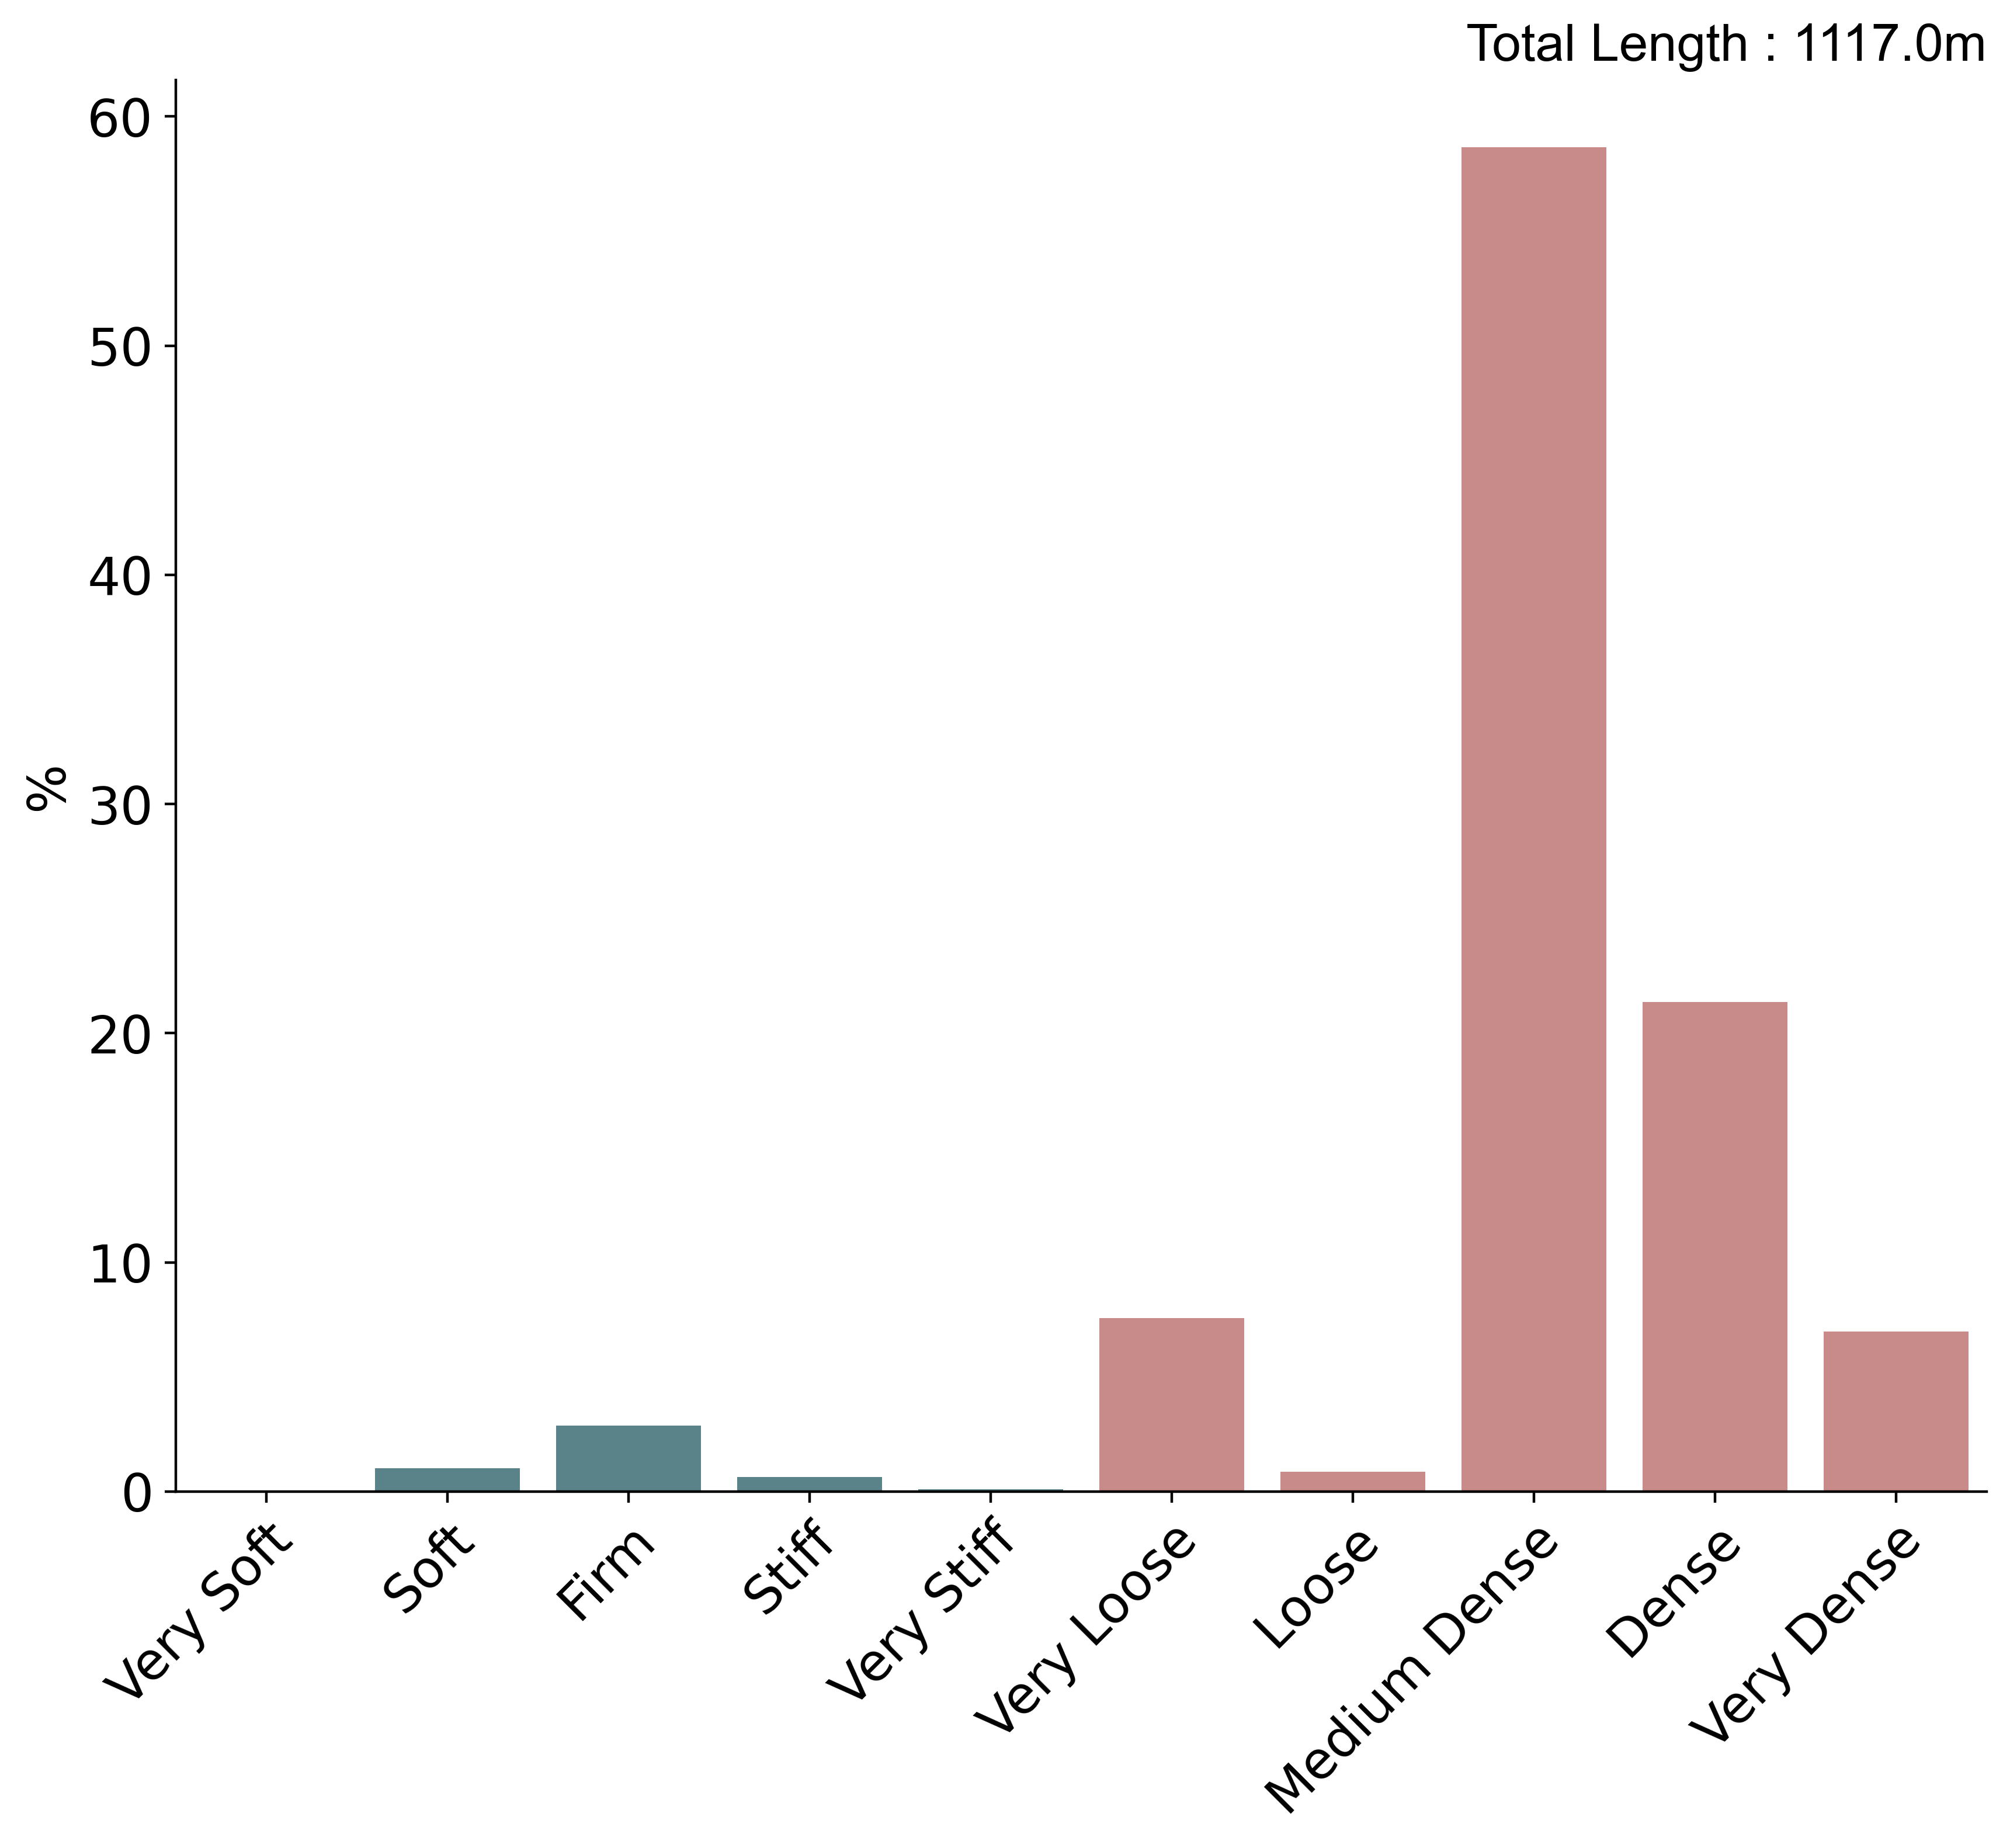
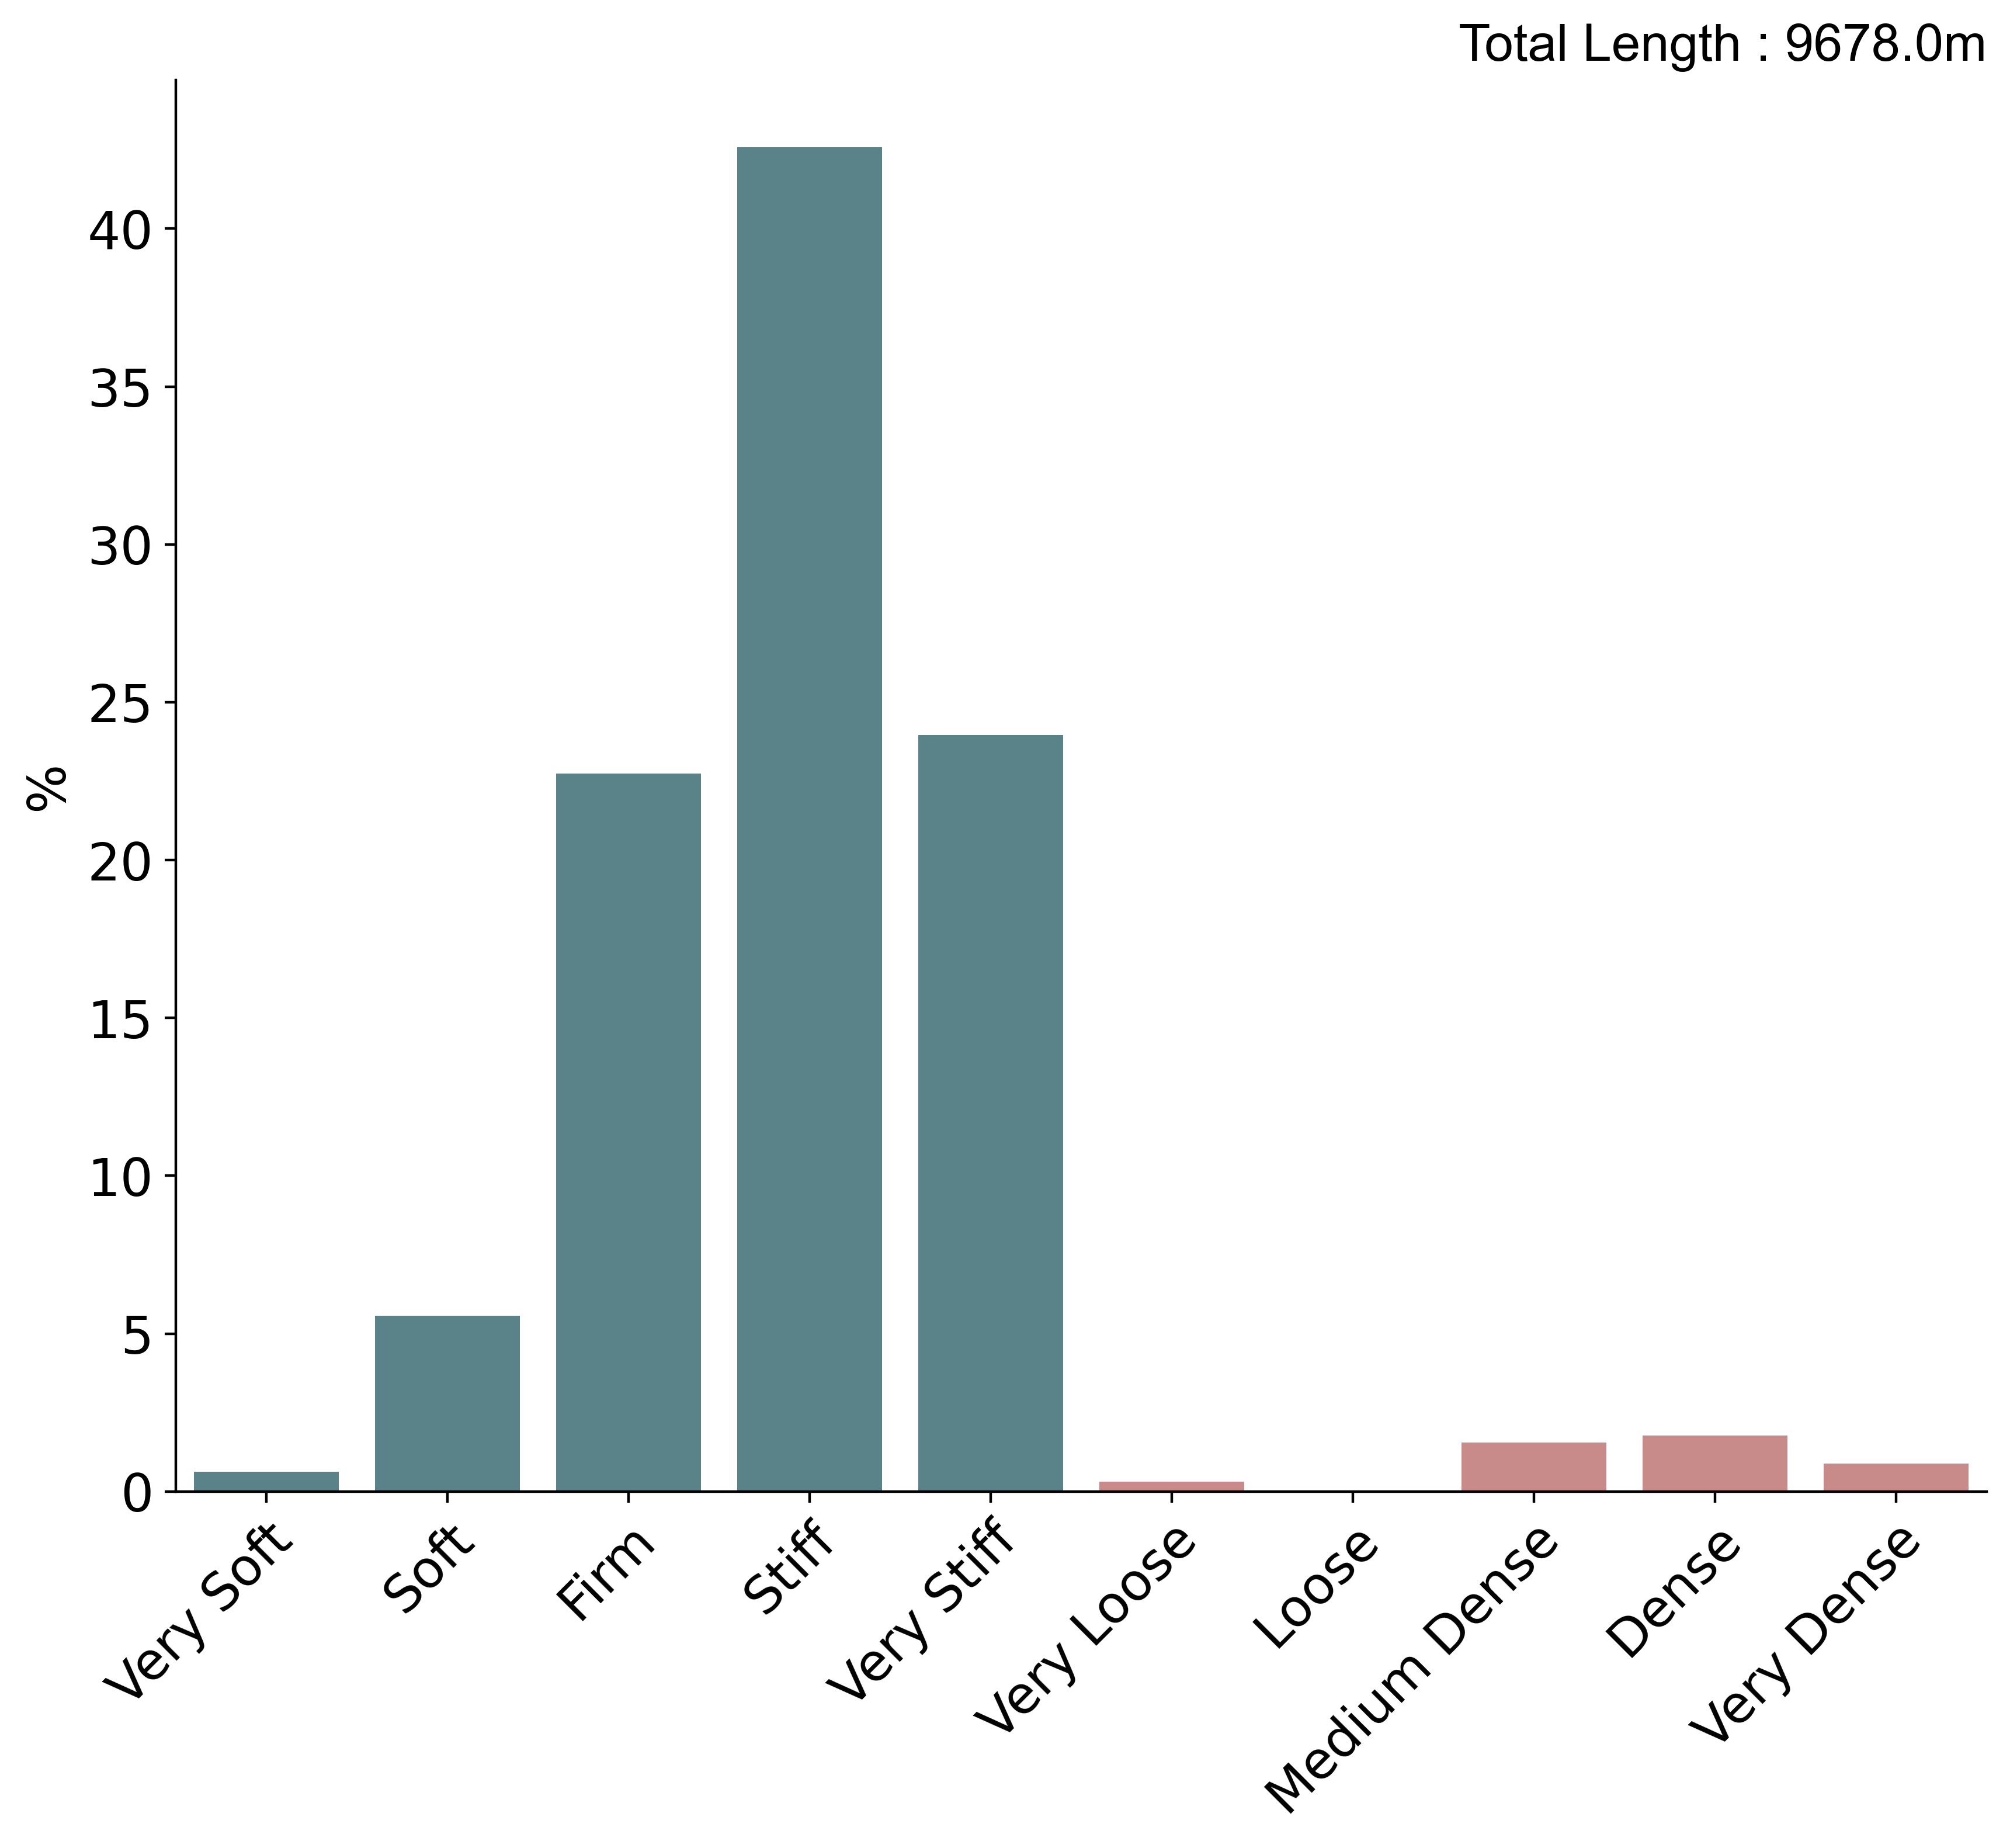
Geological descriptions
Histogram summarising the consistency and relative density described in exploratory hole logs based on total metres logged. BGS © UKRI.
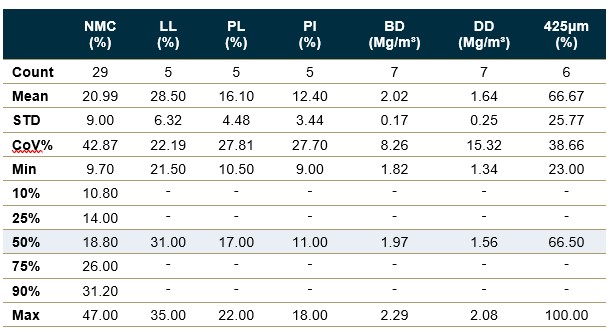
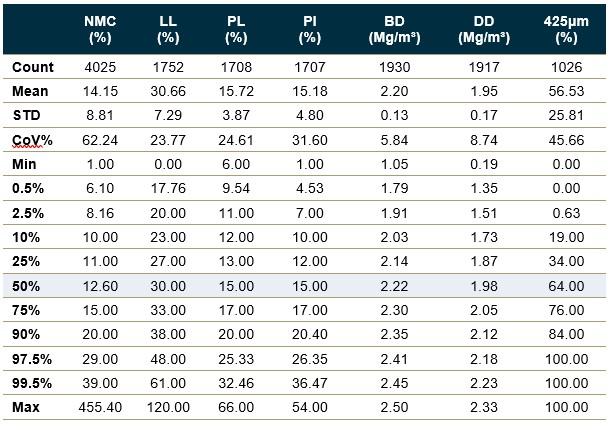
Geotechnical properties: classification tests
Statistical summaries of geotechnical index properties from laboratory tests. STD – standard deviation; CoV% – coefficient of variation; NMC – natural moisture content; LL – liquid limit; PL – plastic limit; PI – plasticity index; BD – bulk density; DD – dry density; 425 μm – percentage of sample passing 425 μm sieve. Percentiles reported based on sample size; no summaries are provided where there are fewer than 5 samples. BGS © UKRI
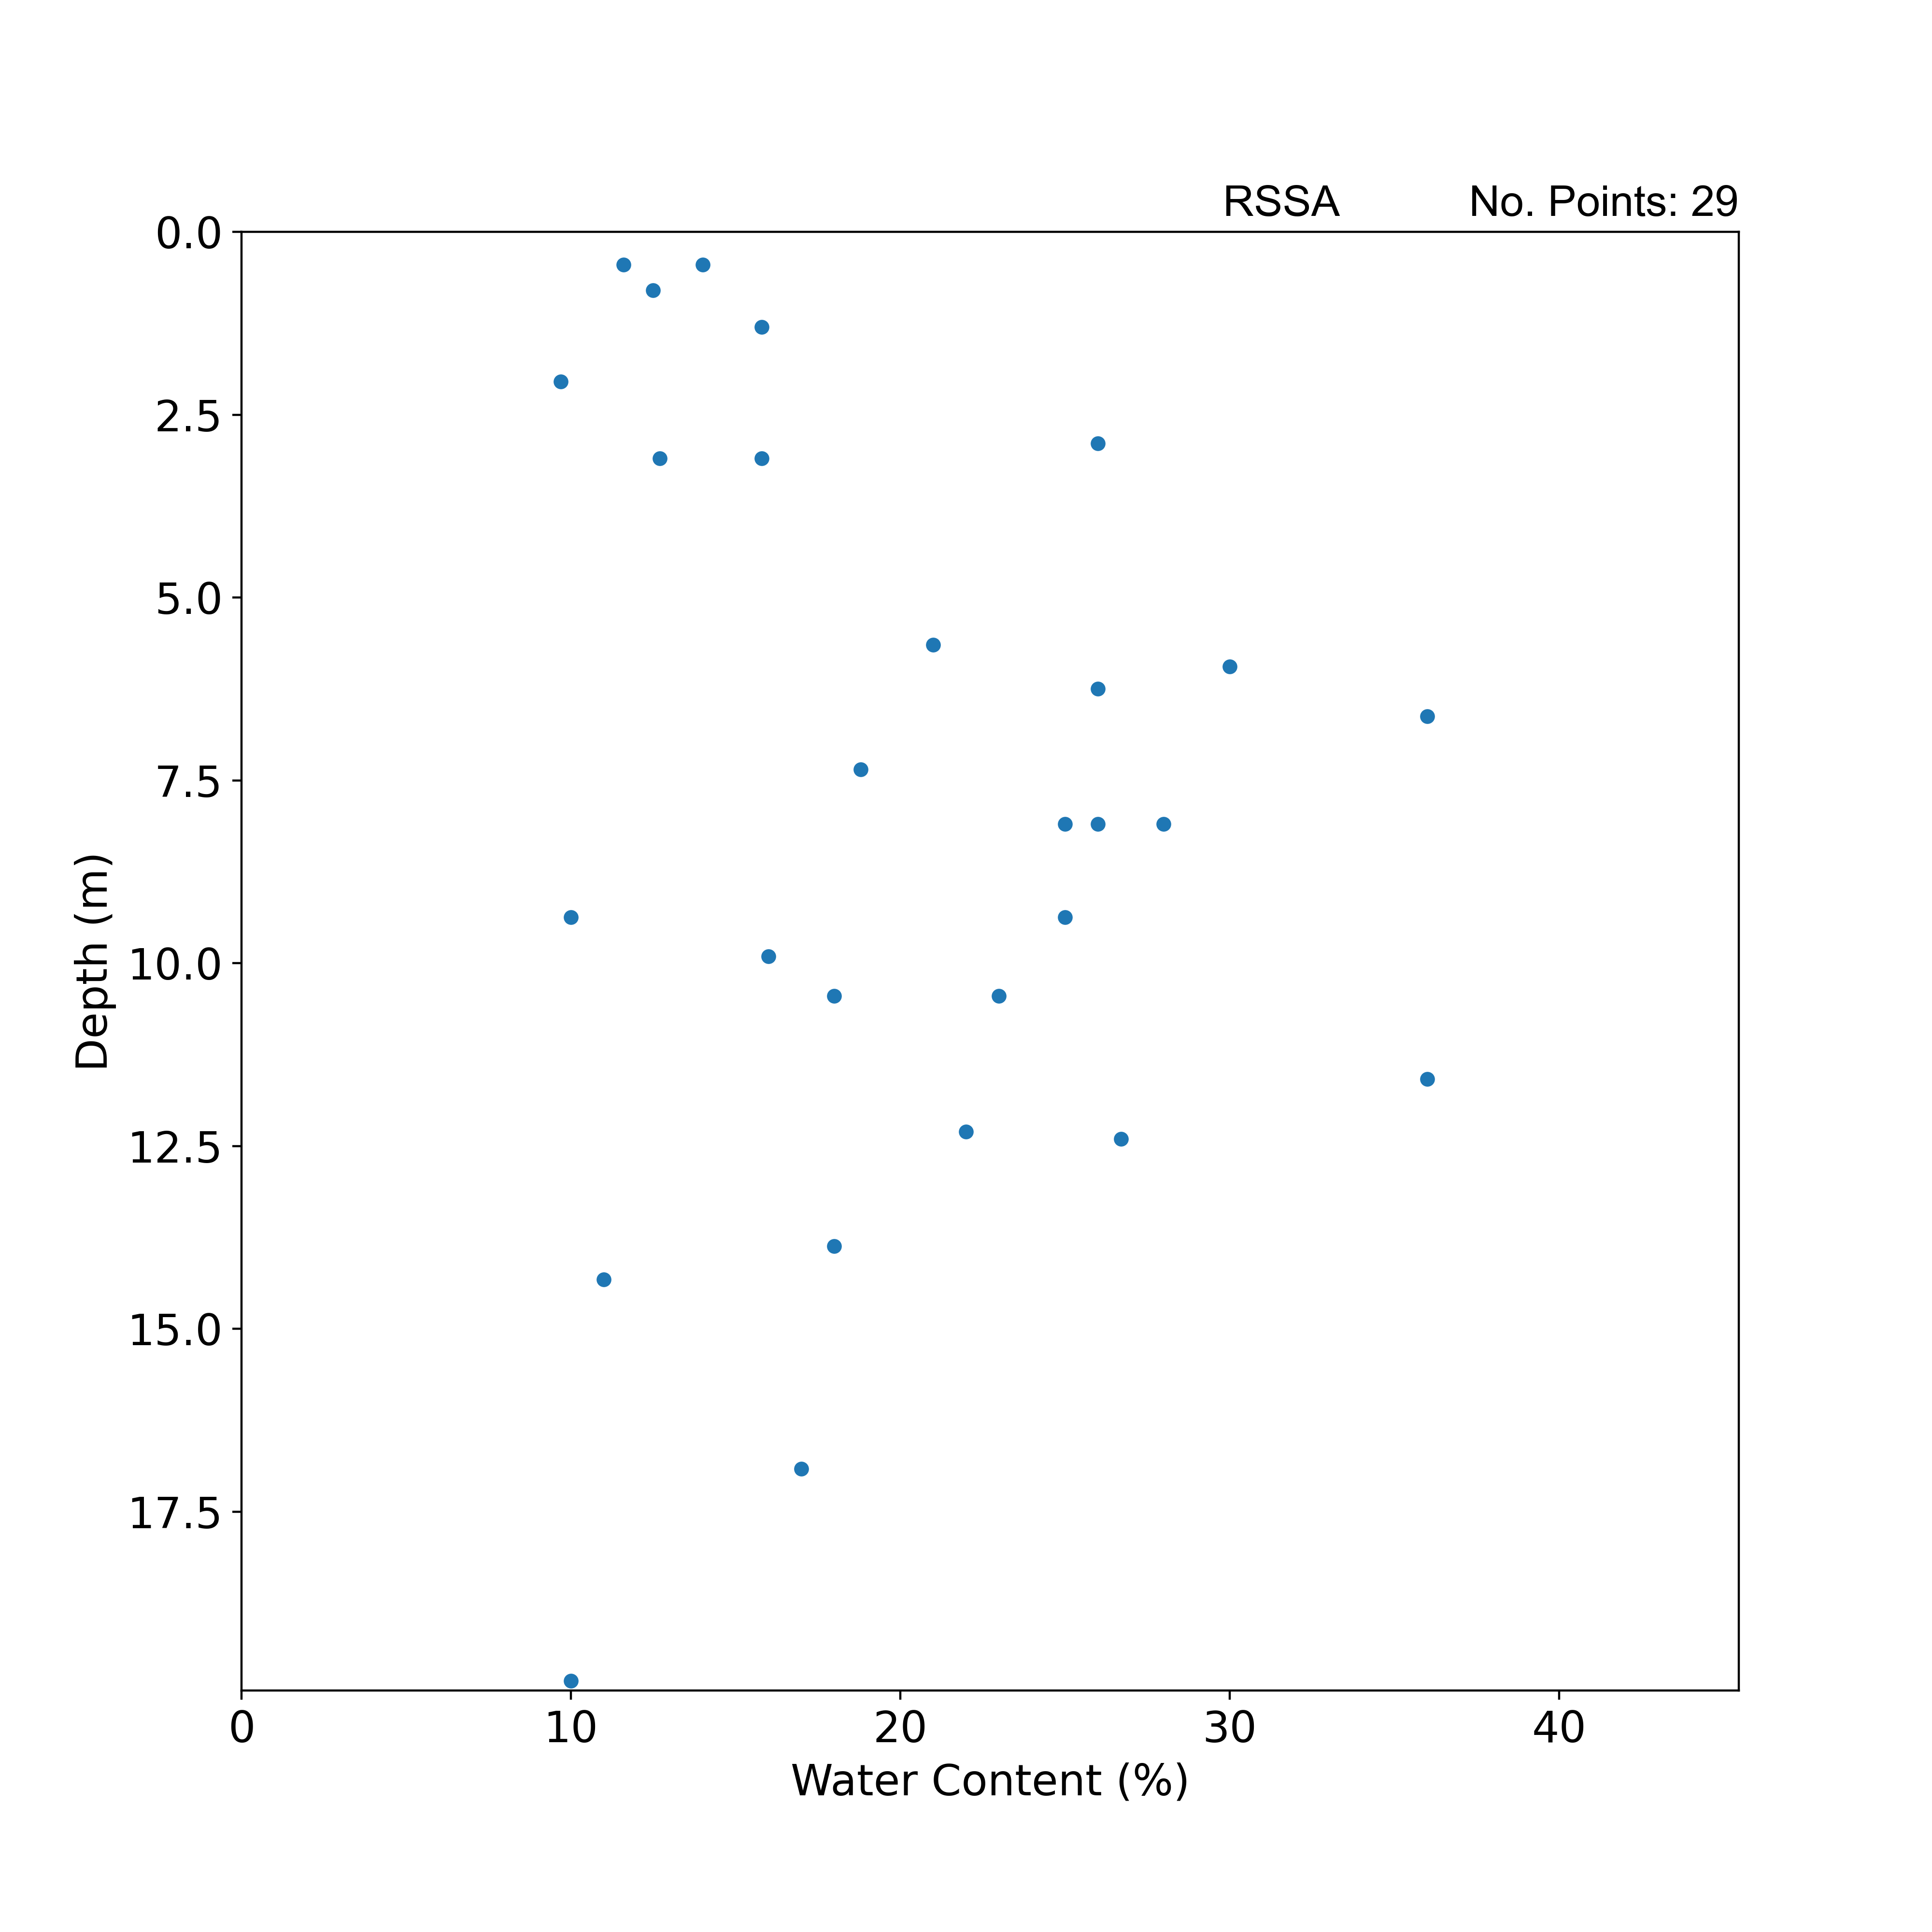
Geotechnical properties: classification tests
Scatter plot summarising water content with depth. BGS © UKRI.
Geotechnical properties: strength tests
Statistical summaries of geotechnical index properties from laboratory tests. STD – standard deviation; CoV% – coefficient of variation; NMC – natural moisture content; LL – liquid limit; PL – plastic limit; PI – plasticity index; BD – bulk density; DD – dry density; 425 μm – percentage of sample passing 425 μm sieve. Percentiles reported based on sample size; no summaries are provided where there are fewer than 5 samples. BGS © UKRI
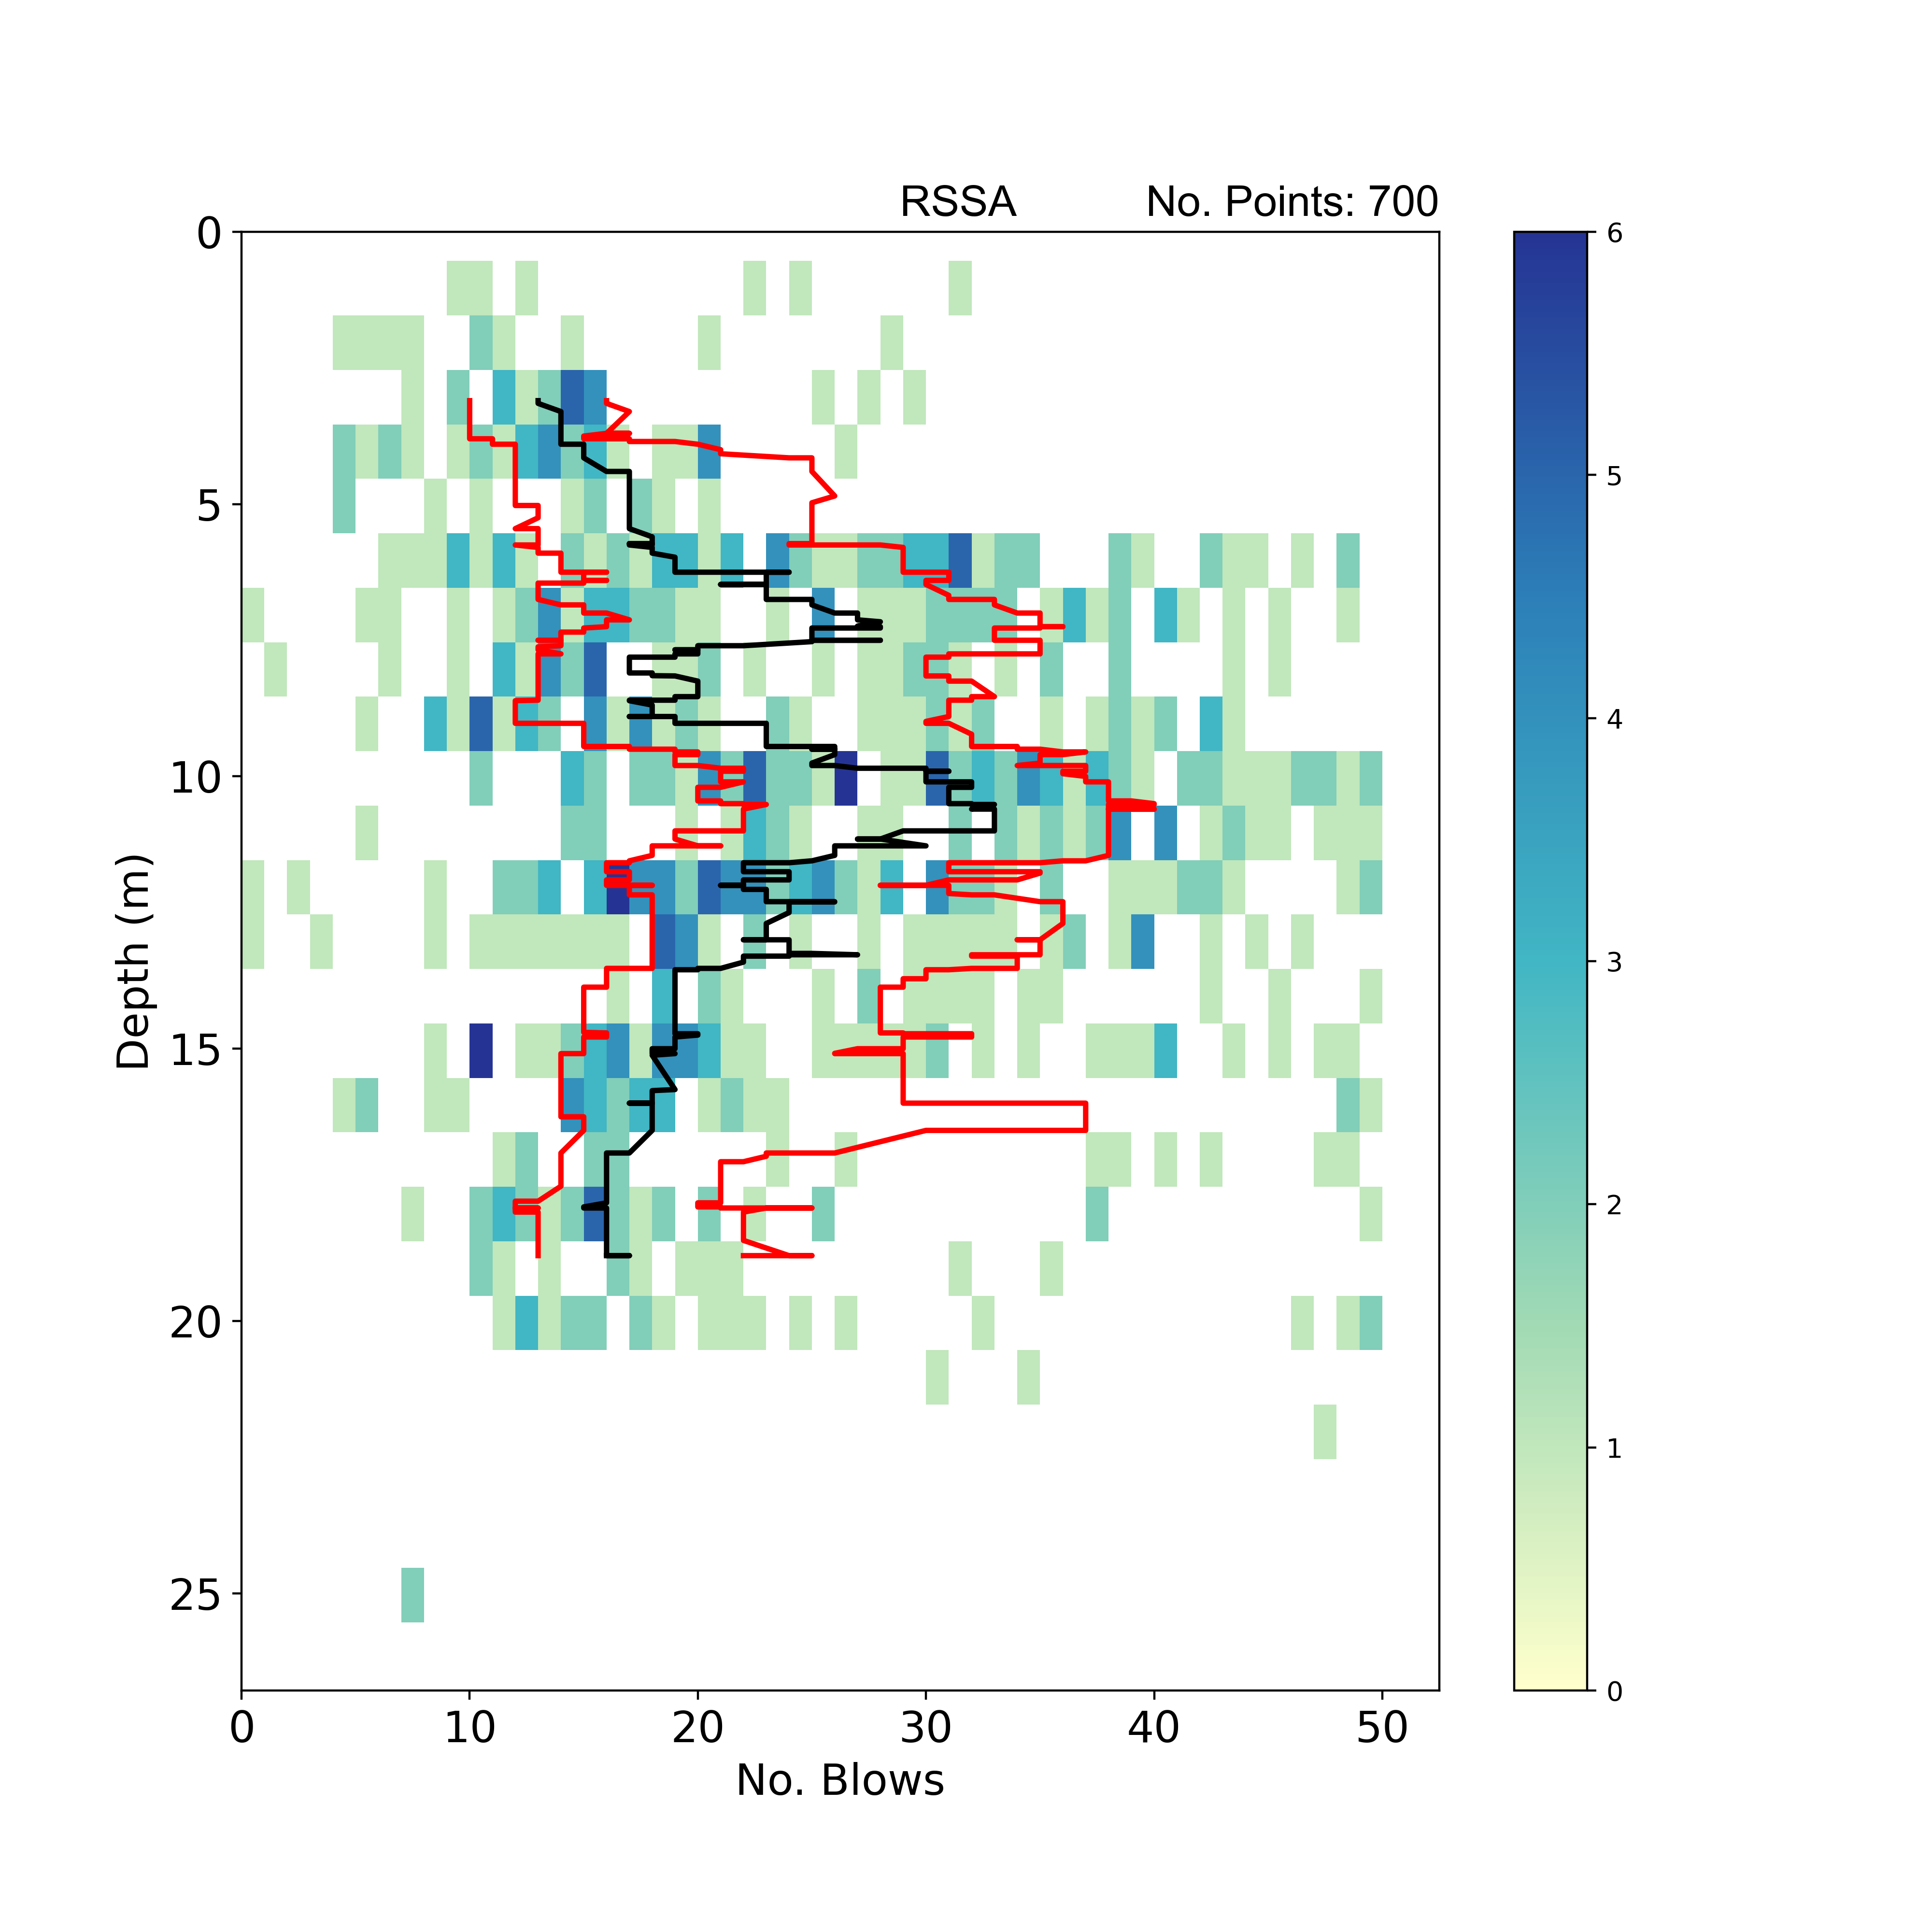
Geotechnical properties: strength tests
2D histogram summarising SPT N-value results with depth. Black line: SPT N-value with depth trend using a rolling window median (window width = 10 per cent sample number); red lines: SPT N-value with depth trend using a rolling window of 25th and 75th percentile (window width = 41. BGS © UKRI.
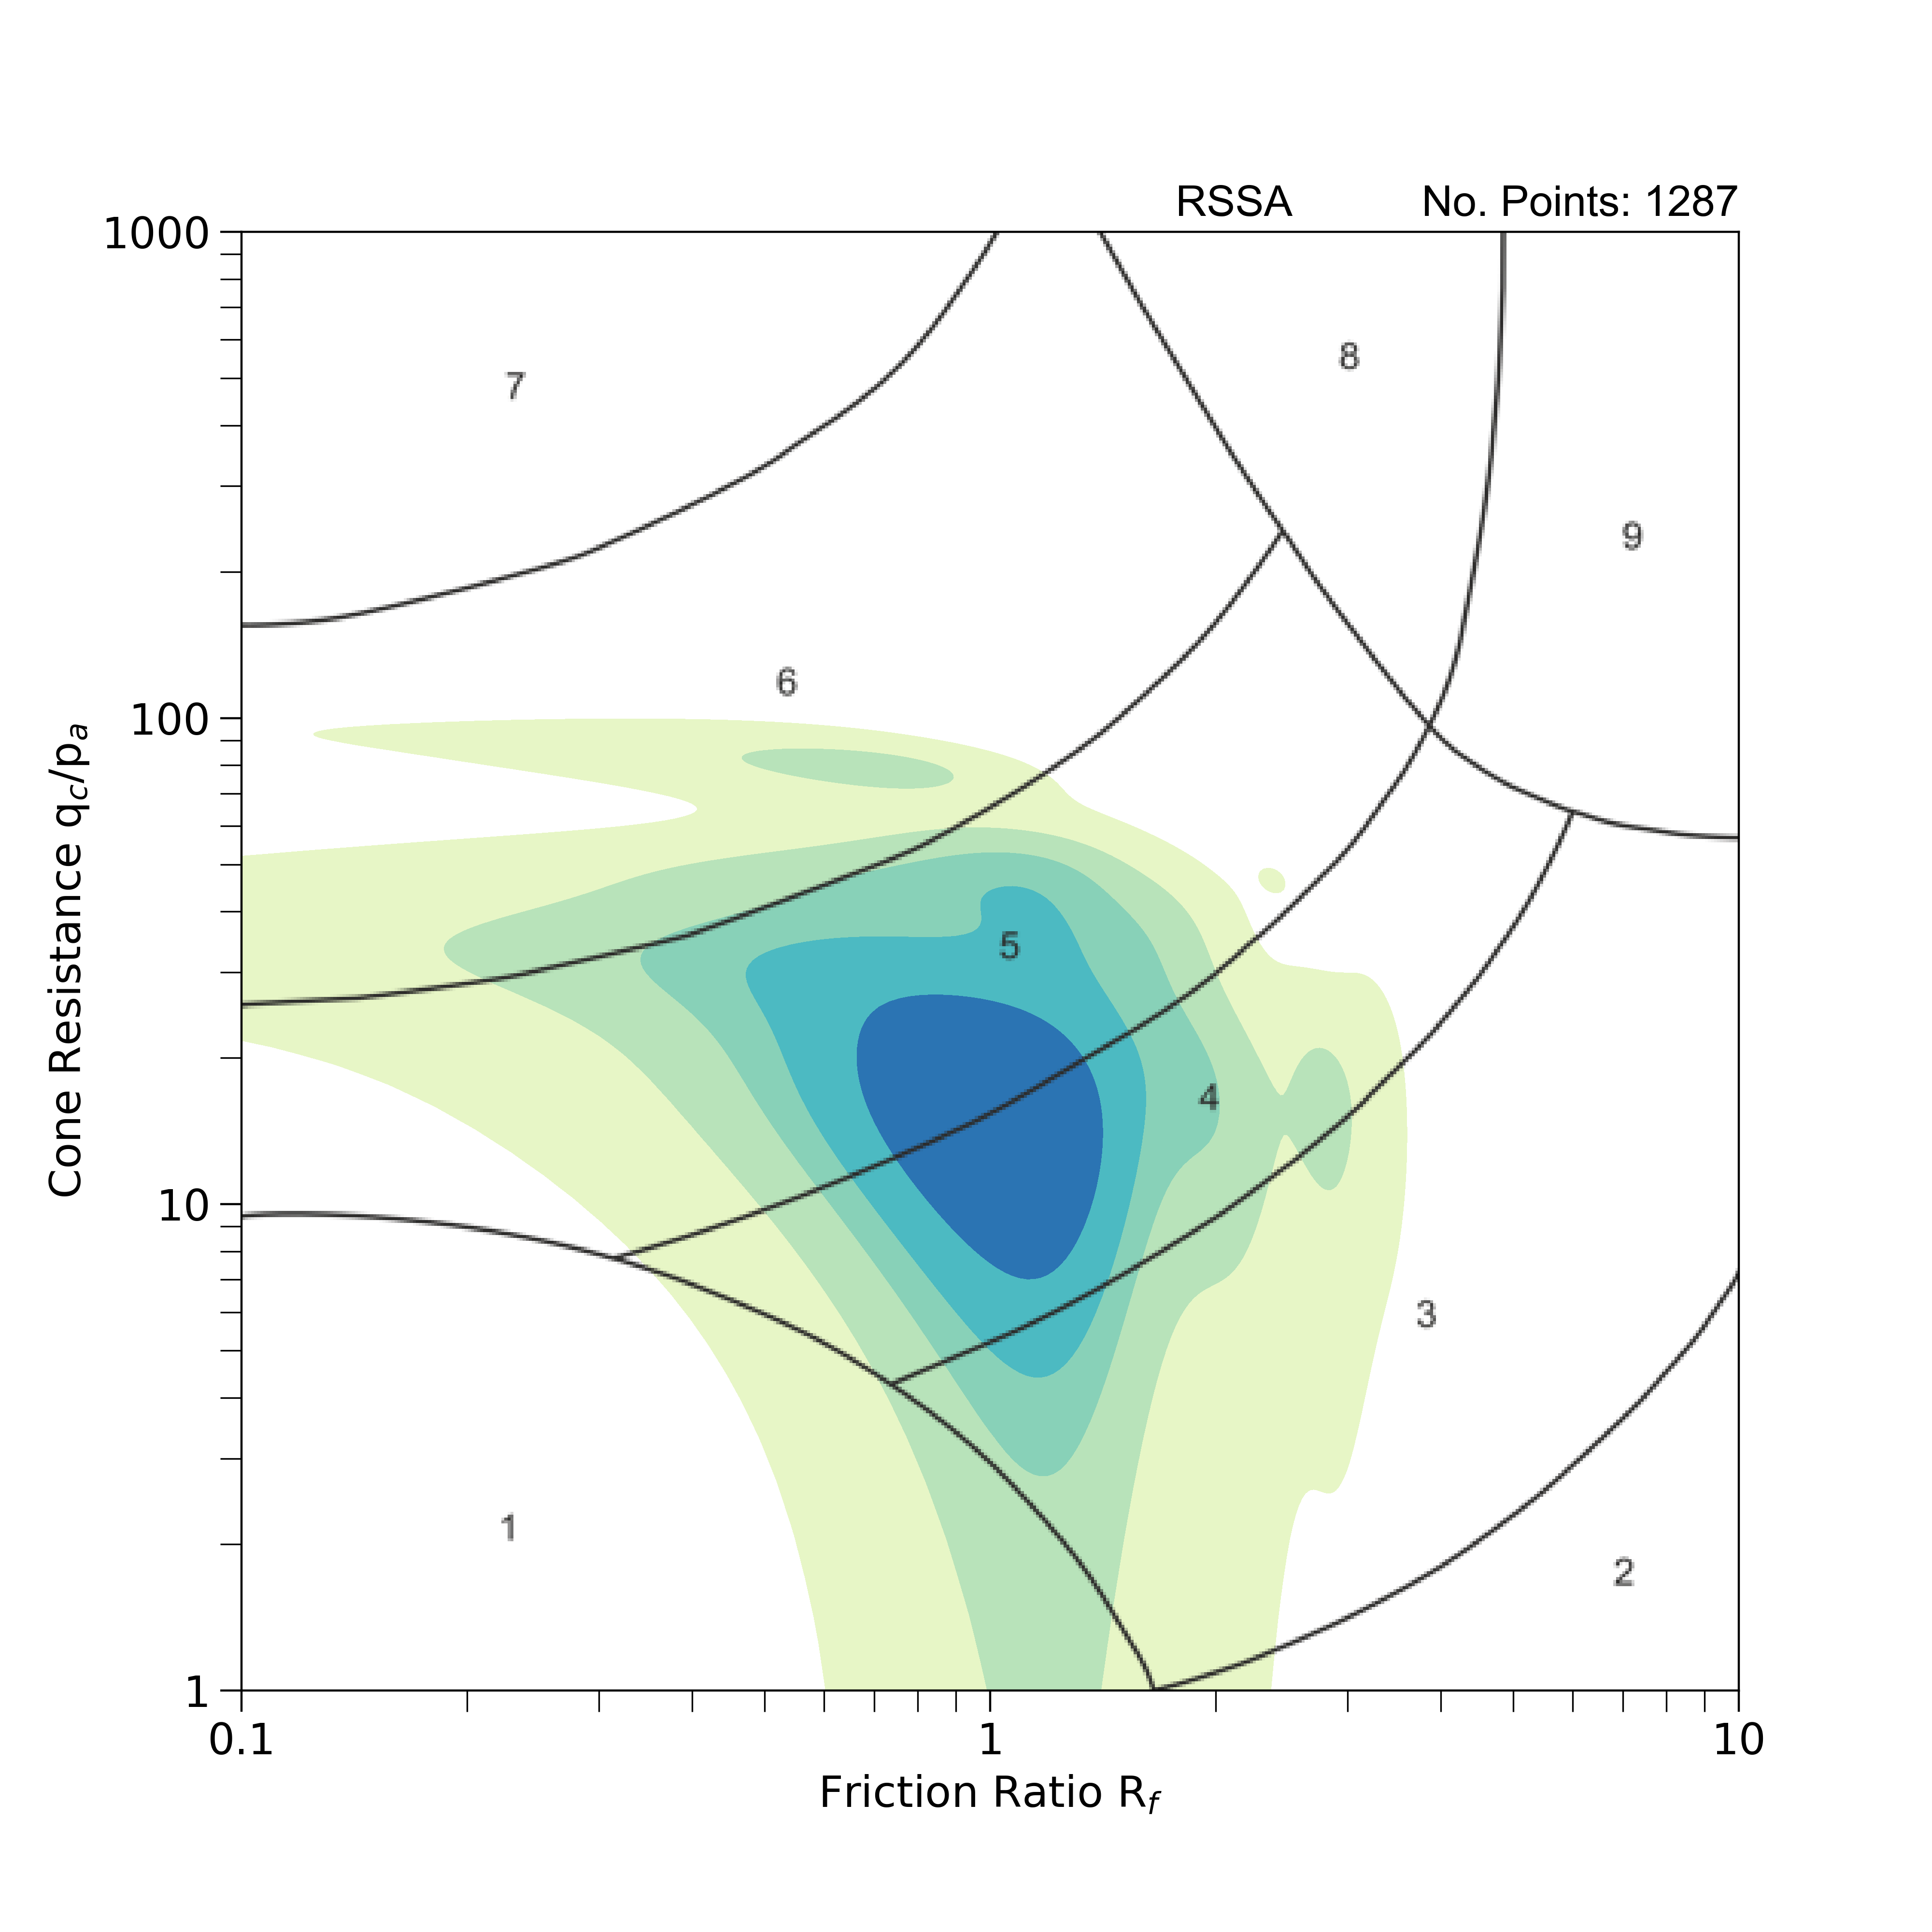
Geotechnical properties: strength tests
Non-normalised soil behaviour type chart after Robertson (2010) with 2D kernel density estimation of dimensionless cone resistance and friction ratio obtained from cone penetration tests. 1: sensitive fine-grained; 2: clay — organic soil; 3: clays — clay to silty clay; 4: silt mixtures — clayey silt and silty clay; 5: sand mixtures — silty sand to sandy silt; 6: sands — cleans sands to silty sands; 7: dense sand to gravelly sand; 8: stiff sand to clayey sand (overconsolidated or cemented); 9: stiff fine-grained (overconsolidated or cemented). BGS © UKRI.
Wilderness Till Formation (WITI)
Geological descriptions
Pie chart summarising the dominant soil types (primary and secondary constituents) described in exploratory hole logs based on total metres logged. Descriptions have been simplified to remove tertiary constituents and a threshold of 1 per cent applied to aid graphical presentation. Soil types representing less than 1 per cent of the total logged are included in the ‘other’ category. BGS © UKRI.
Geological descriptions
Histogram summarising the consistency and relative density described in exploratory hole logs based on total metres logged. BGS © UKRI.
Geotechnical properties: classification tests
Statistical summaries of geotechnical index properties from laboratory tests. STD – standard deviation; CoV% – coefficient of variation; NMC – natural moisture content; LL – liquid limit; PL – plastic limit; PI – plasticity index; BD – bulk density; DD – dry density; 425 μm – percentage of sample passing 425 μm sieve. Percentiles reported based on sample size; no summaries are provided where there are fewer than 5 samples. BGS © UKRI.
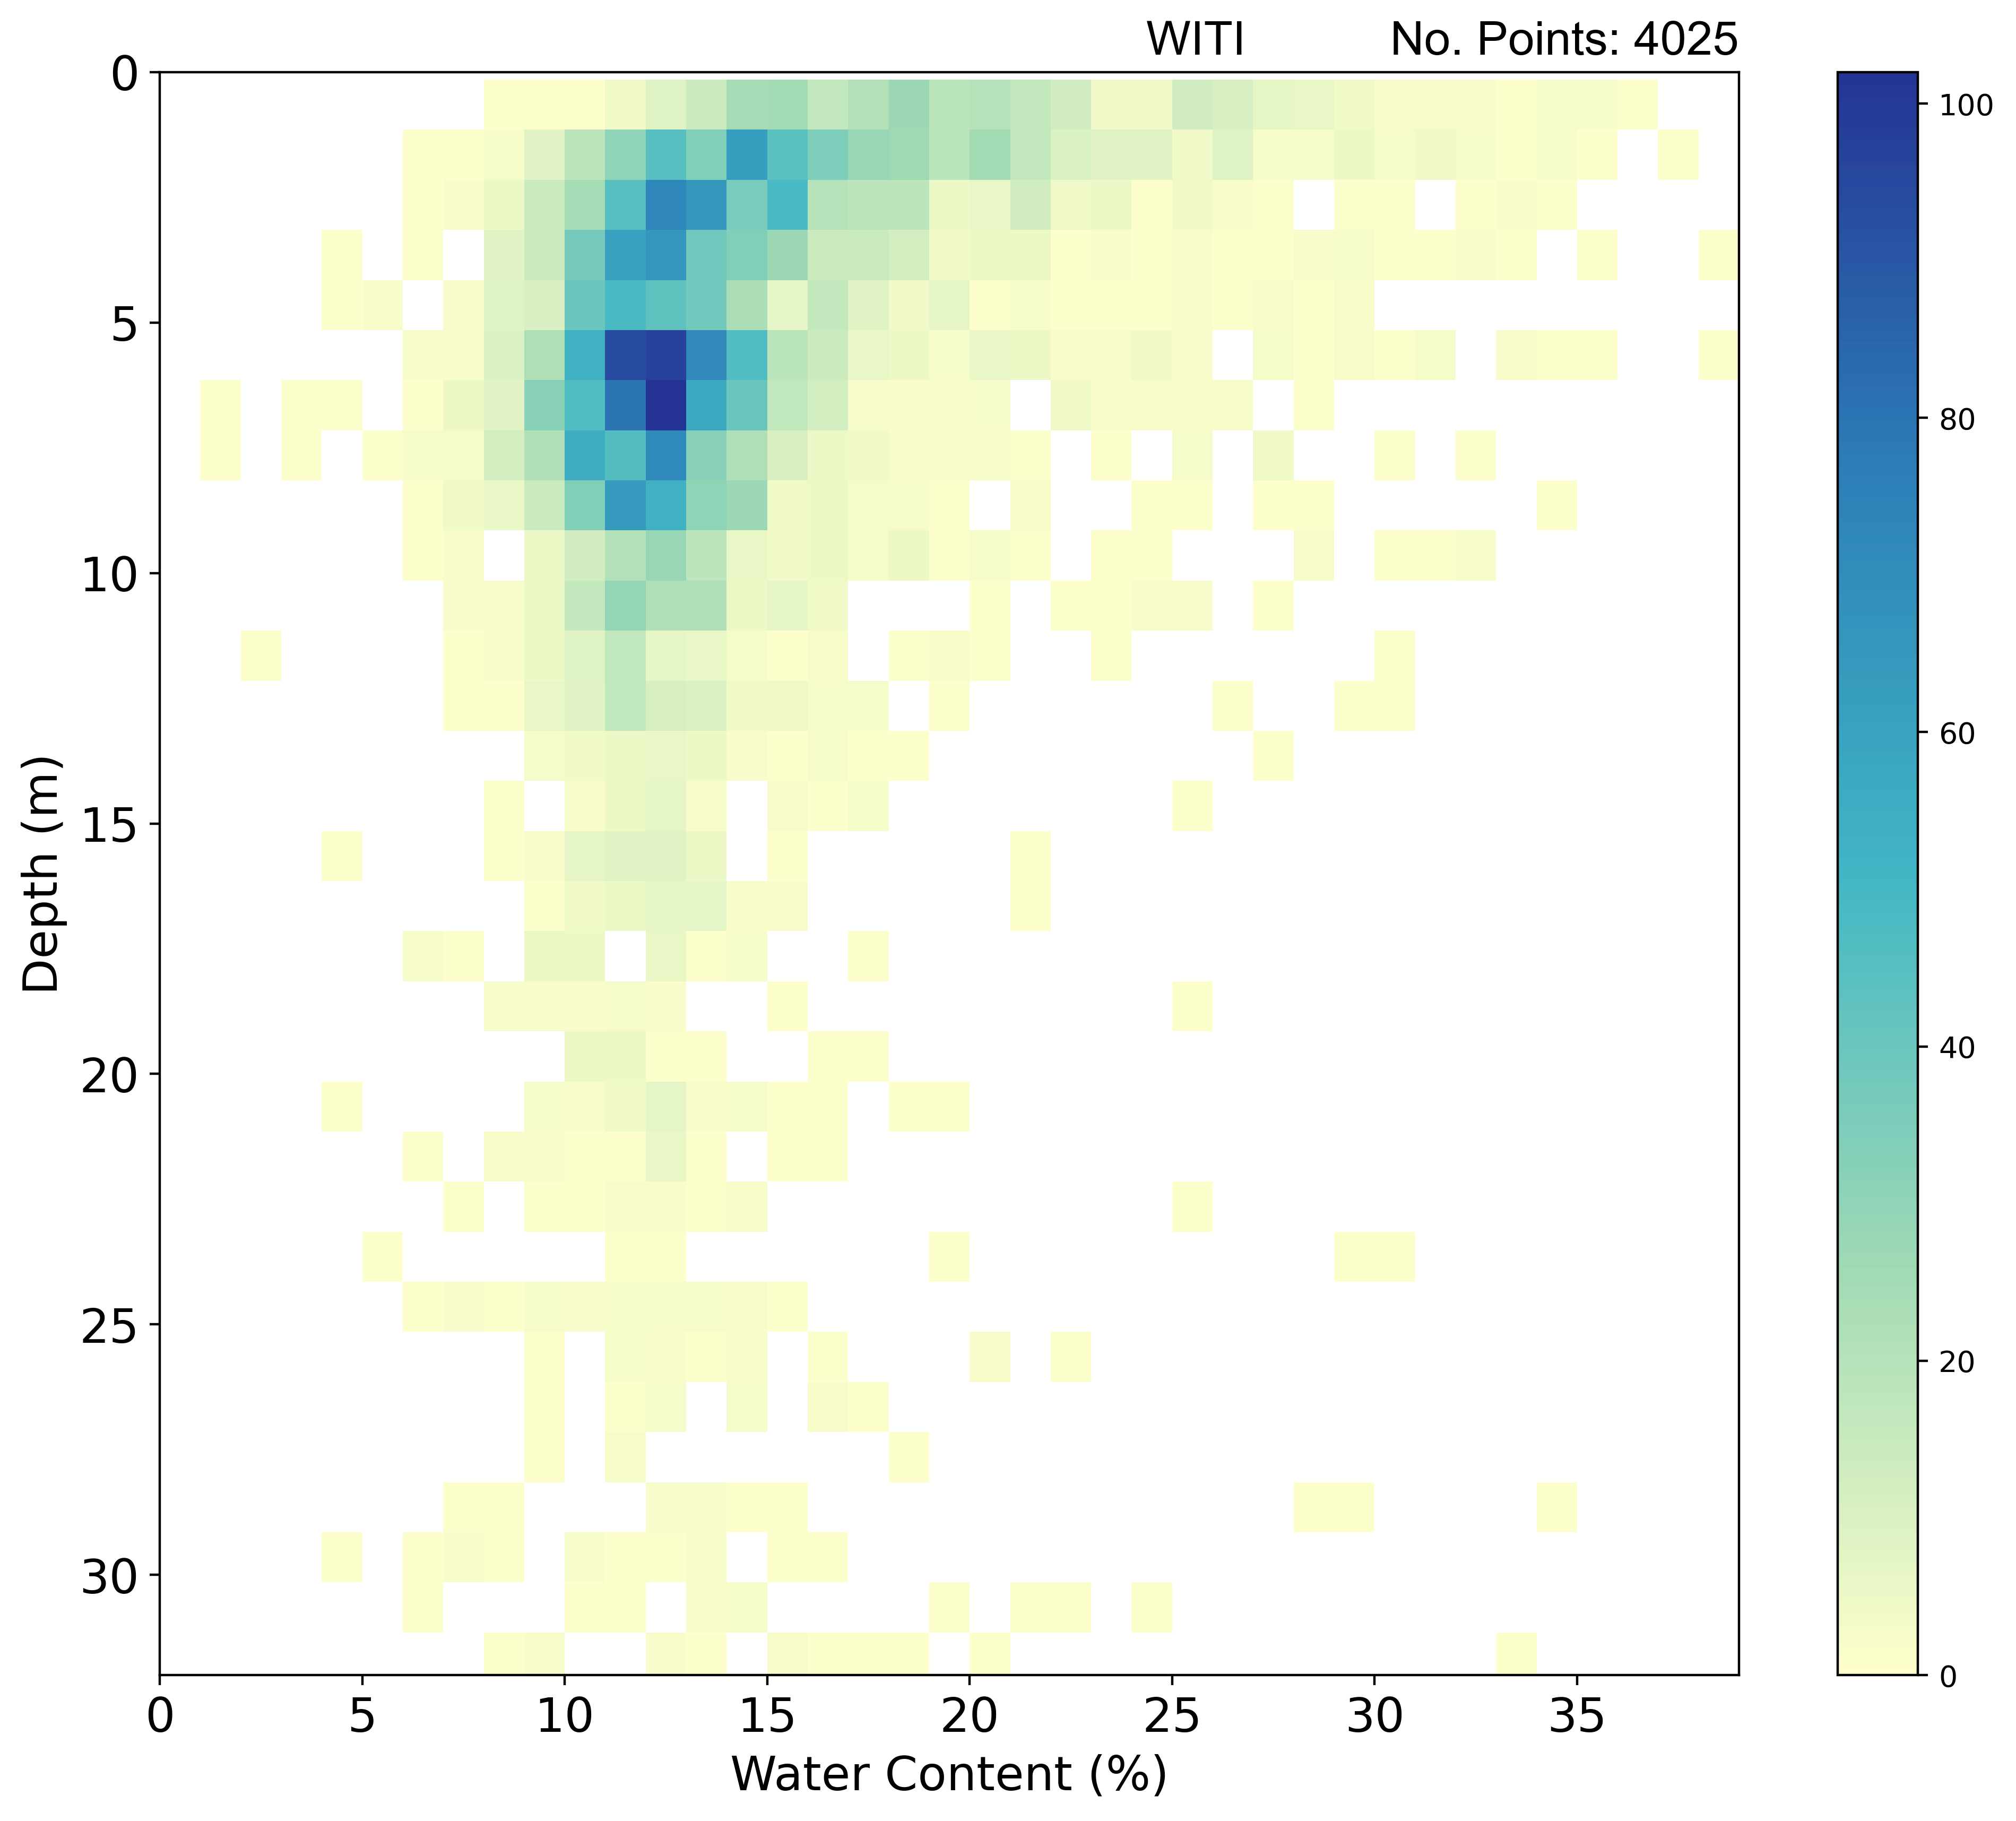
Geotechnical properties: classification tests
2D histogram plot summarising water content with depth. BGS © UKRI.
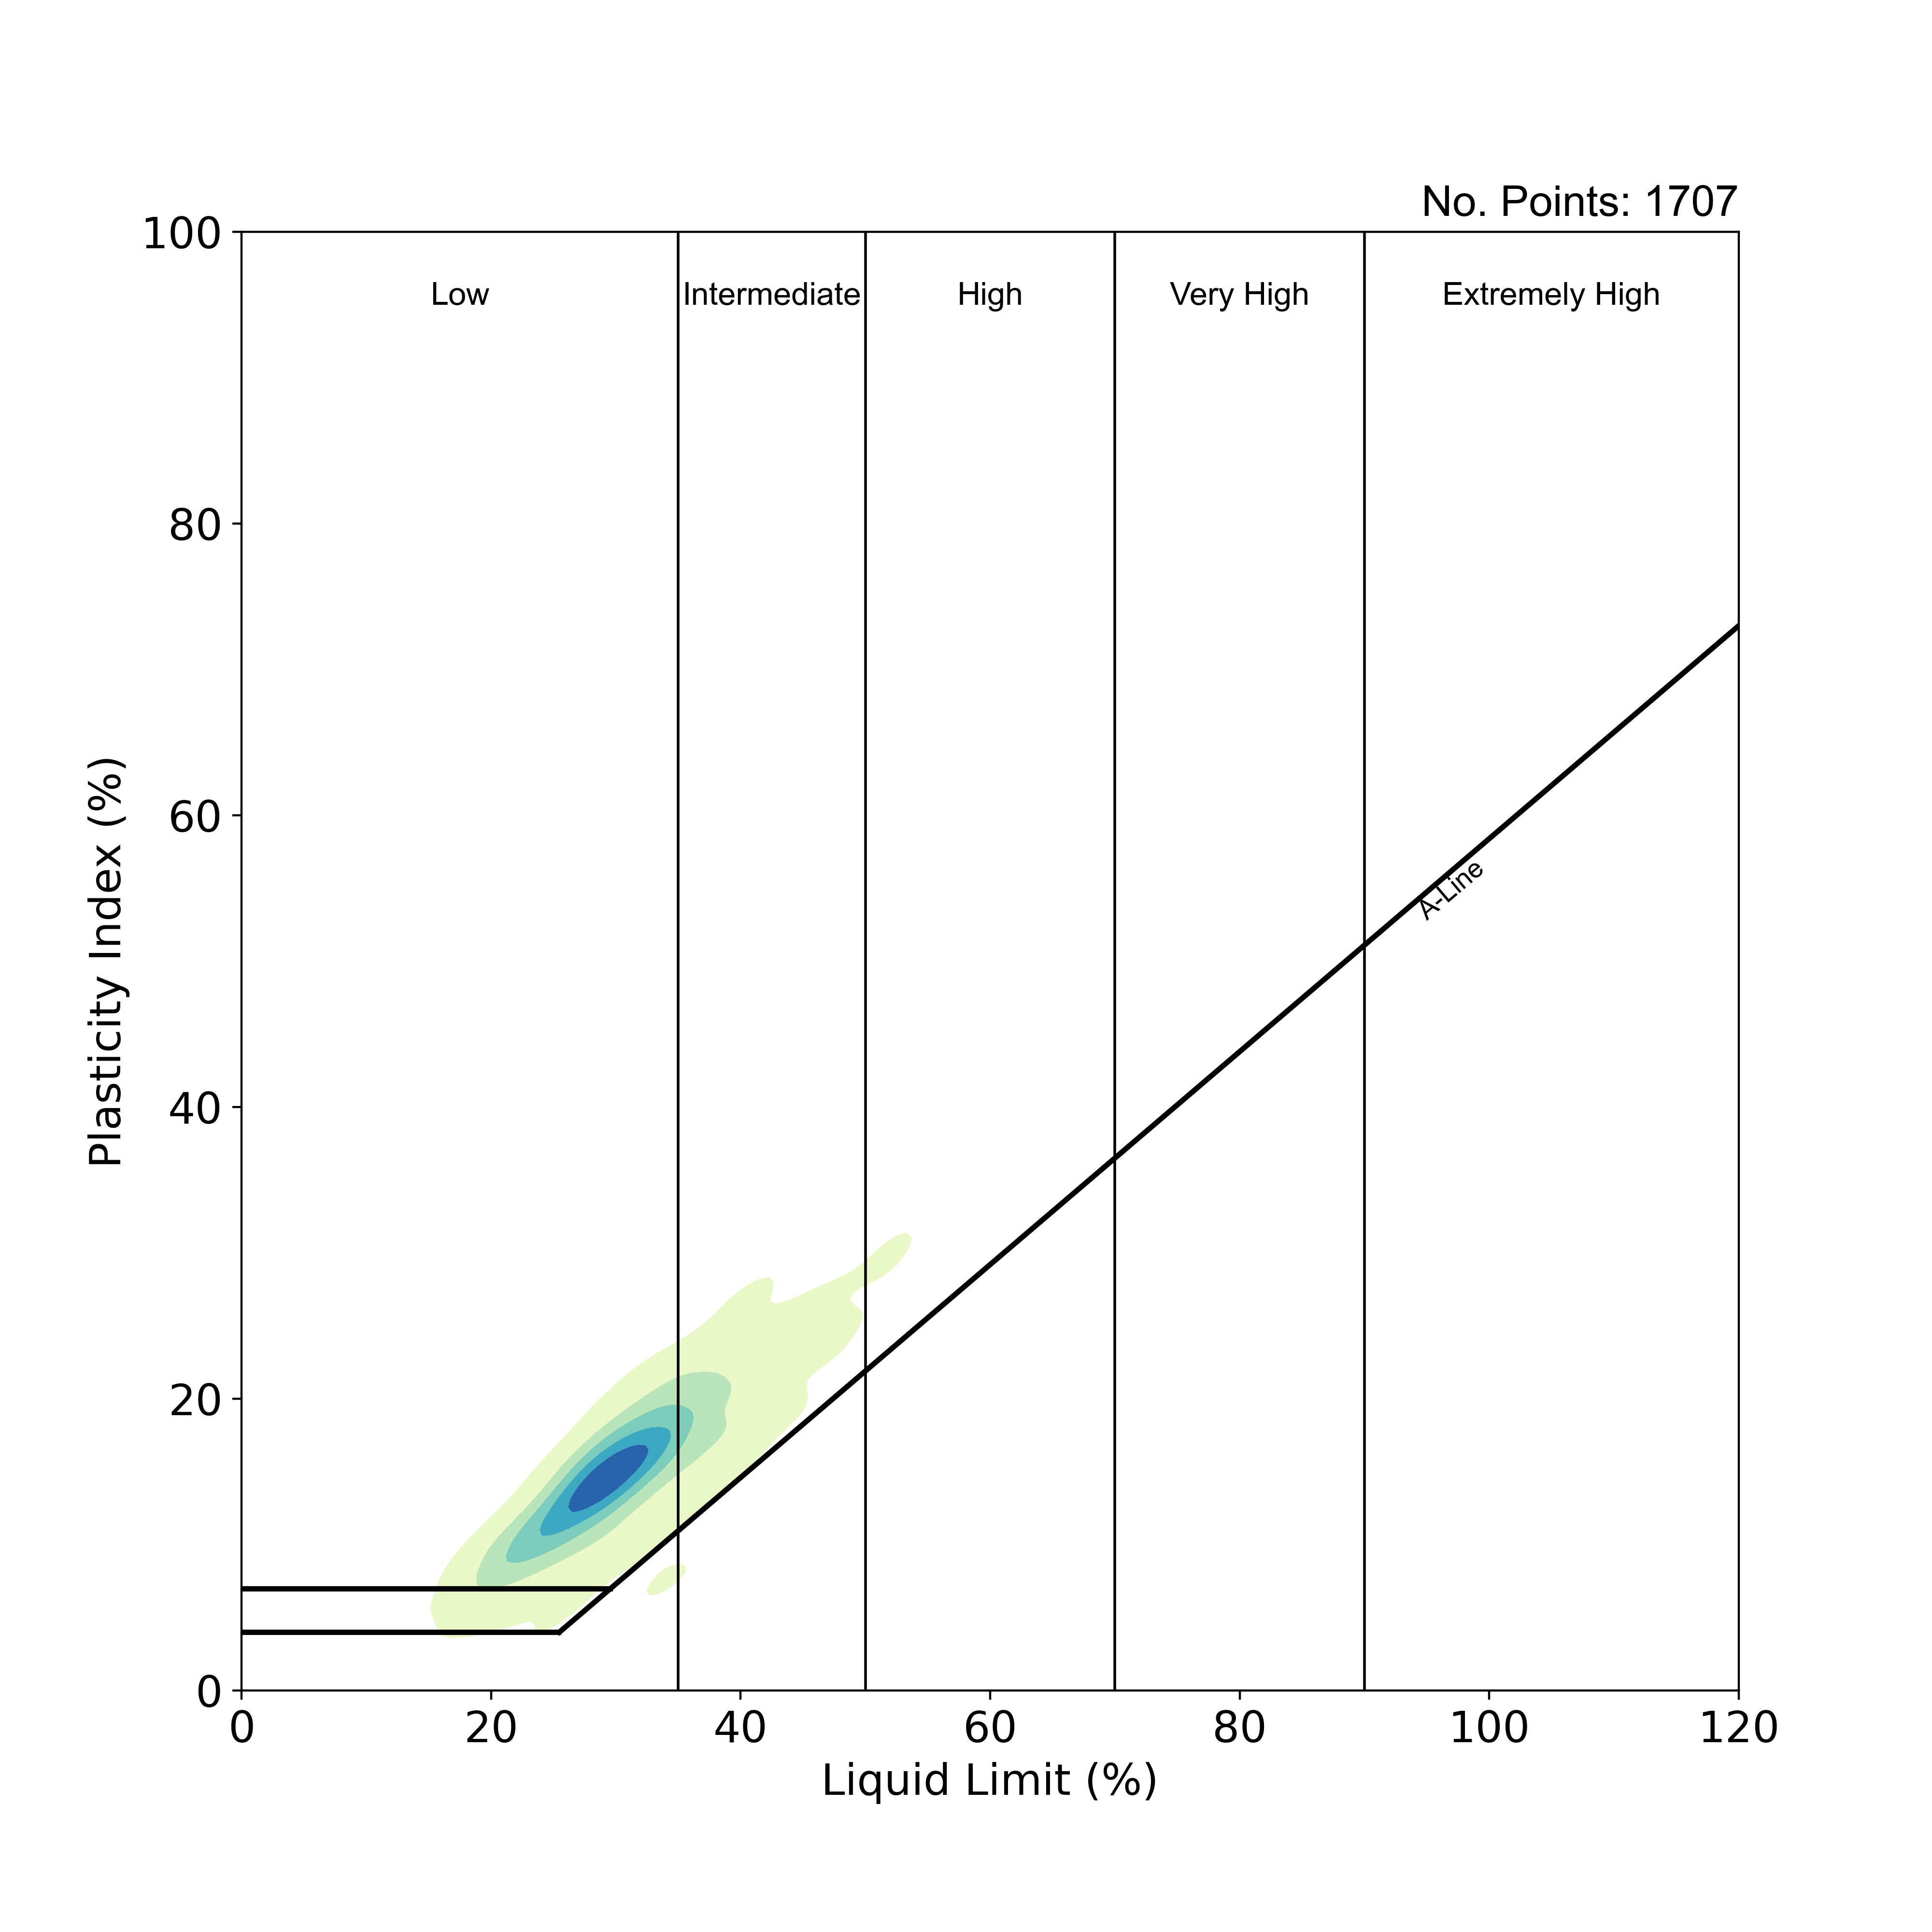
Geotechnical properties: classification tests
Casagrande plasticity plot summarising the distribution of plasticity results with a 2D kernel density estimation. Each colour represents a region of equal probability density (about 20 per cent for each area), with the darker colours representing higher values for probability density. BGS © UKRI.
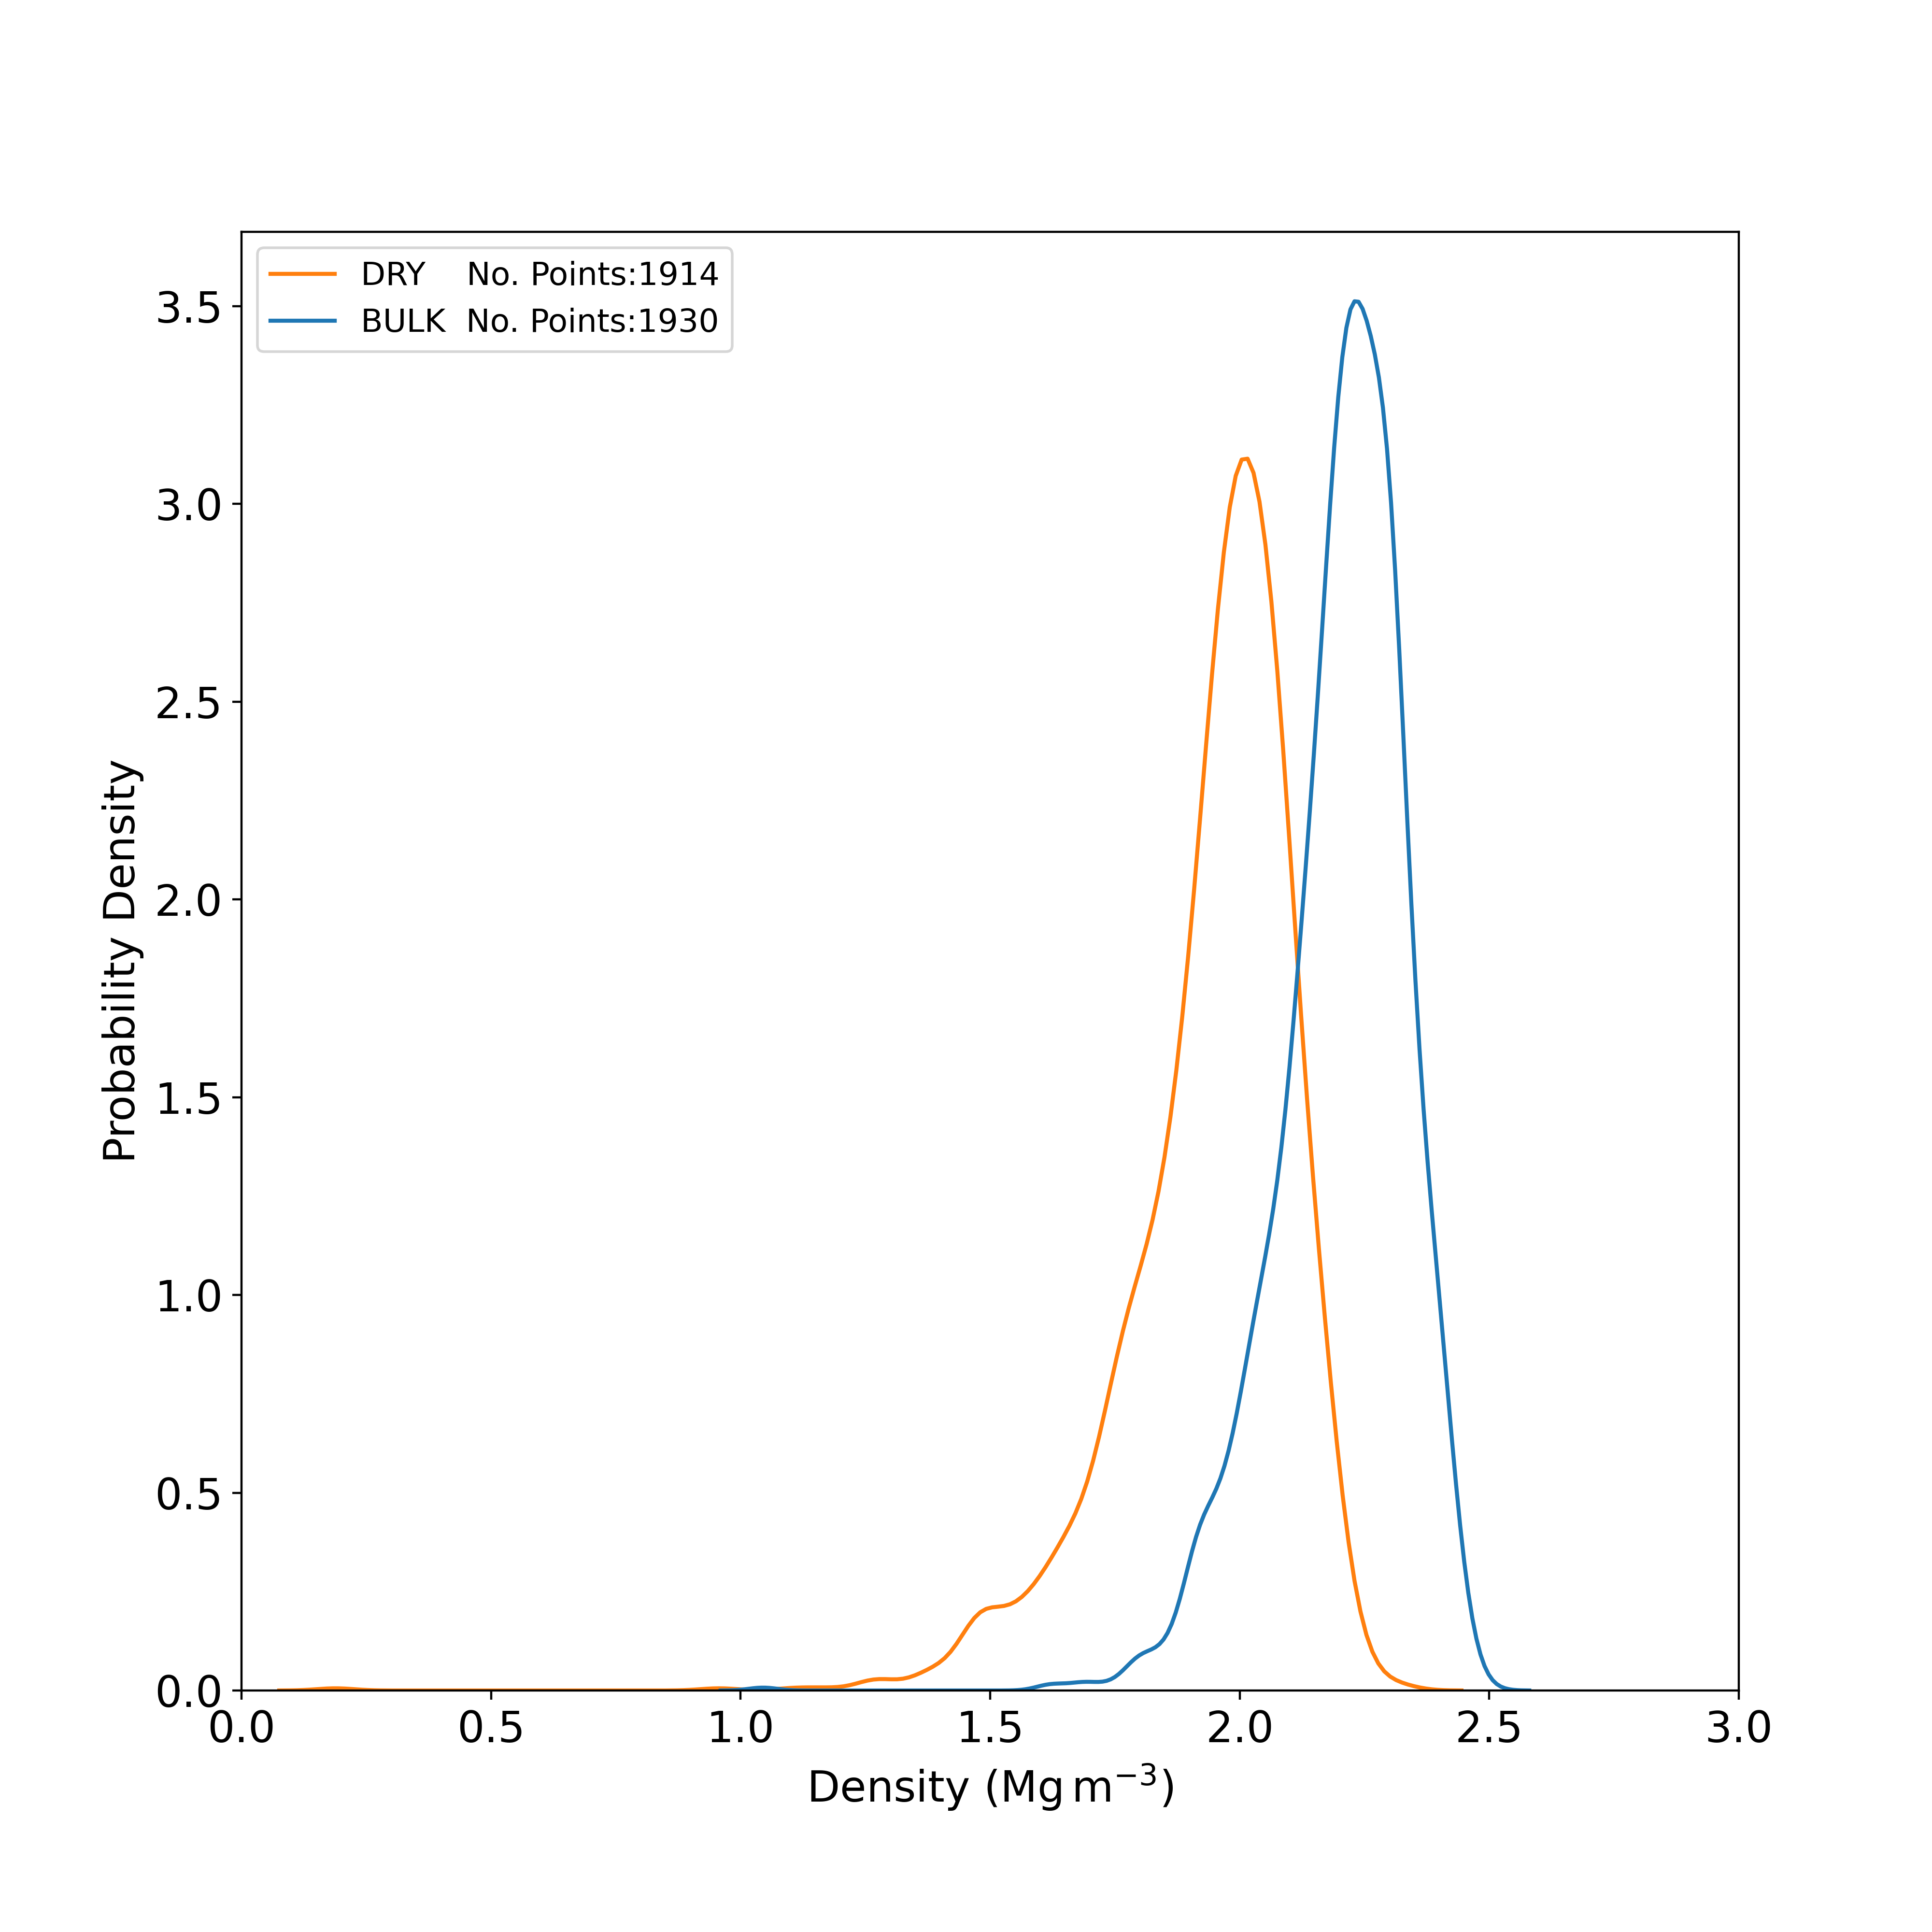
Geotechnical properties: classification tests
Kernel density plot showing the distribution of bulk density and dry density results obtained from laboratory tests. BGS © UKRI.
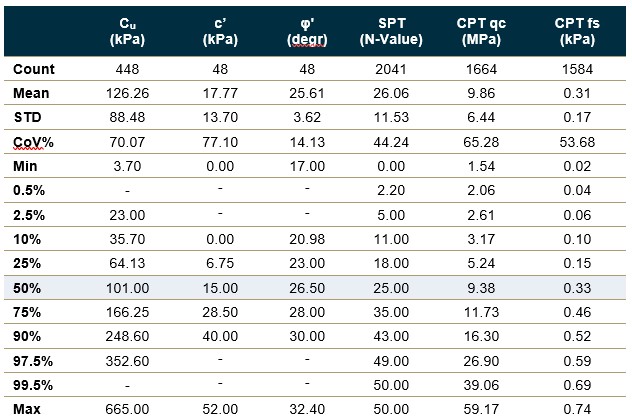
Geotechnical properties: strength tests
Statistical summaries of geotechnical strength properties from laboratory and in situ tests. STD – standard deviation; CoV% – coefficient of variation; Cu – undrained shear strength obtained from unconsolidated undrained triaxial tests; c’ – effective cohesion obtained from consolidated undrained triaxial tests with pore pressure measurements and consolidated drained triaxial tests; φ’ – effective internal friction angle obtained from consolidated undrained triaxial tests with pore pressure measurements and consolidated drained triaxial tests ; SPT – standard penetration test (number of tests with N-value > 50 or with no N-value = 1318); CPT qc – cone penetration test resistance; CPT fs – cone penetration test friction (negative friction values removed for statistical analysis) . Percentiles reported based on sample size; no summaries are provided where there are fewer than 5 samples. BGS © UKRI.
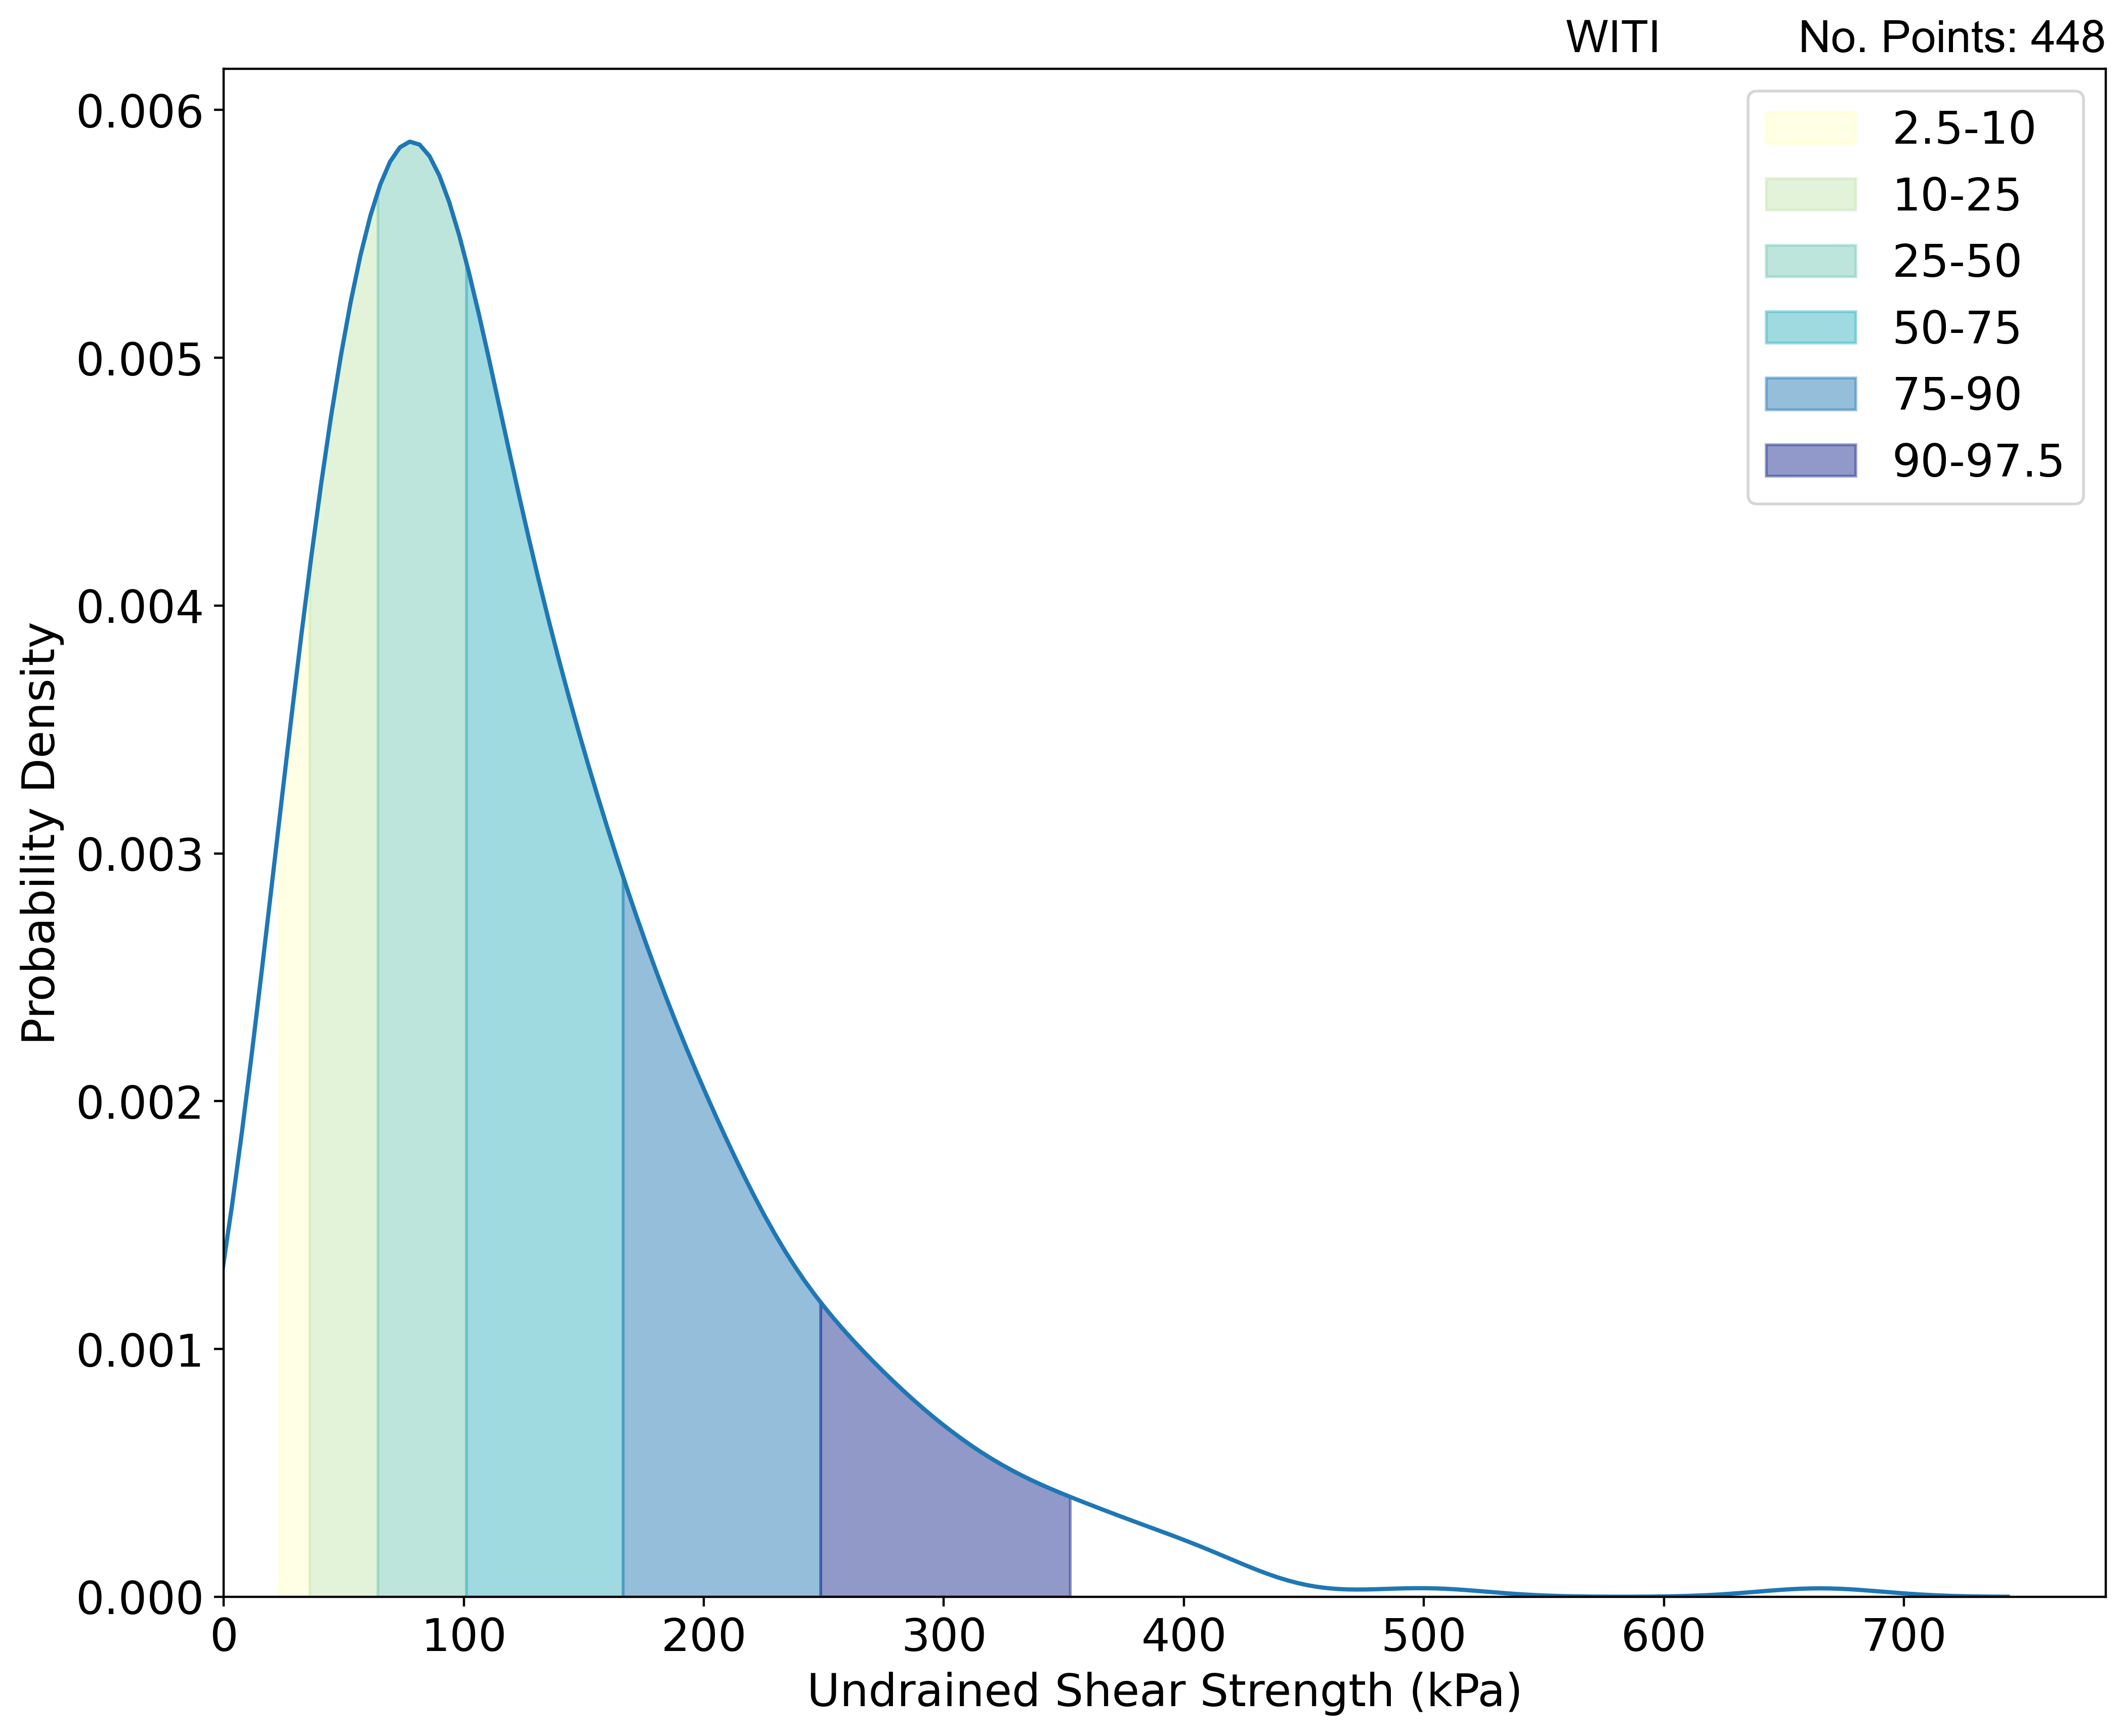
Geotechnical properties: strength tests
Kernel density plot showing the distribution of undrained shear strength results obtained from unconsolidated undrained triaxial laboratory tests with percentile ranges from statistical analysis superimposed as coloured segments. BGS © UKRI.
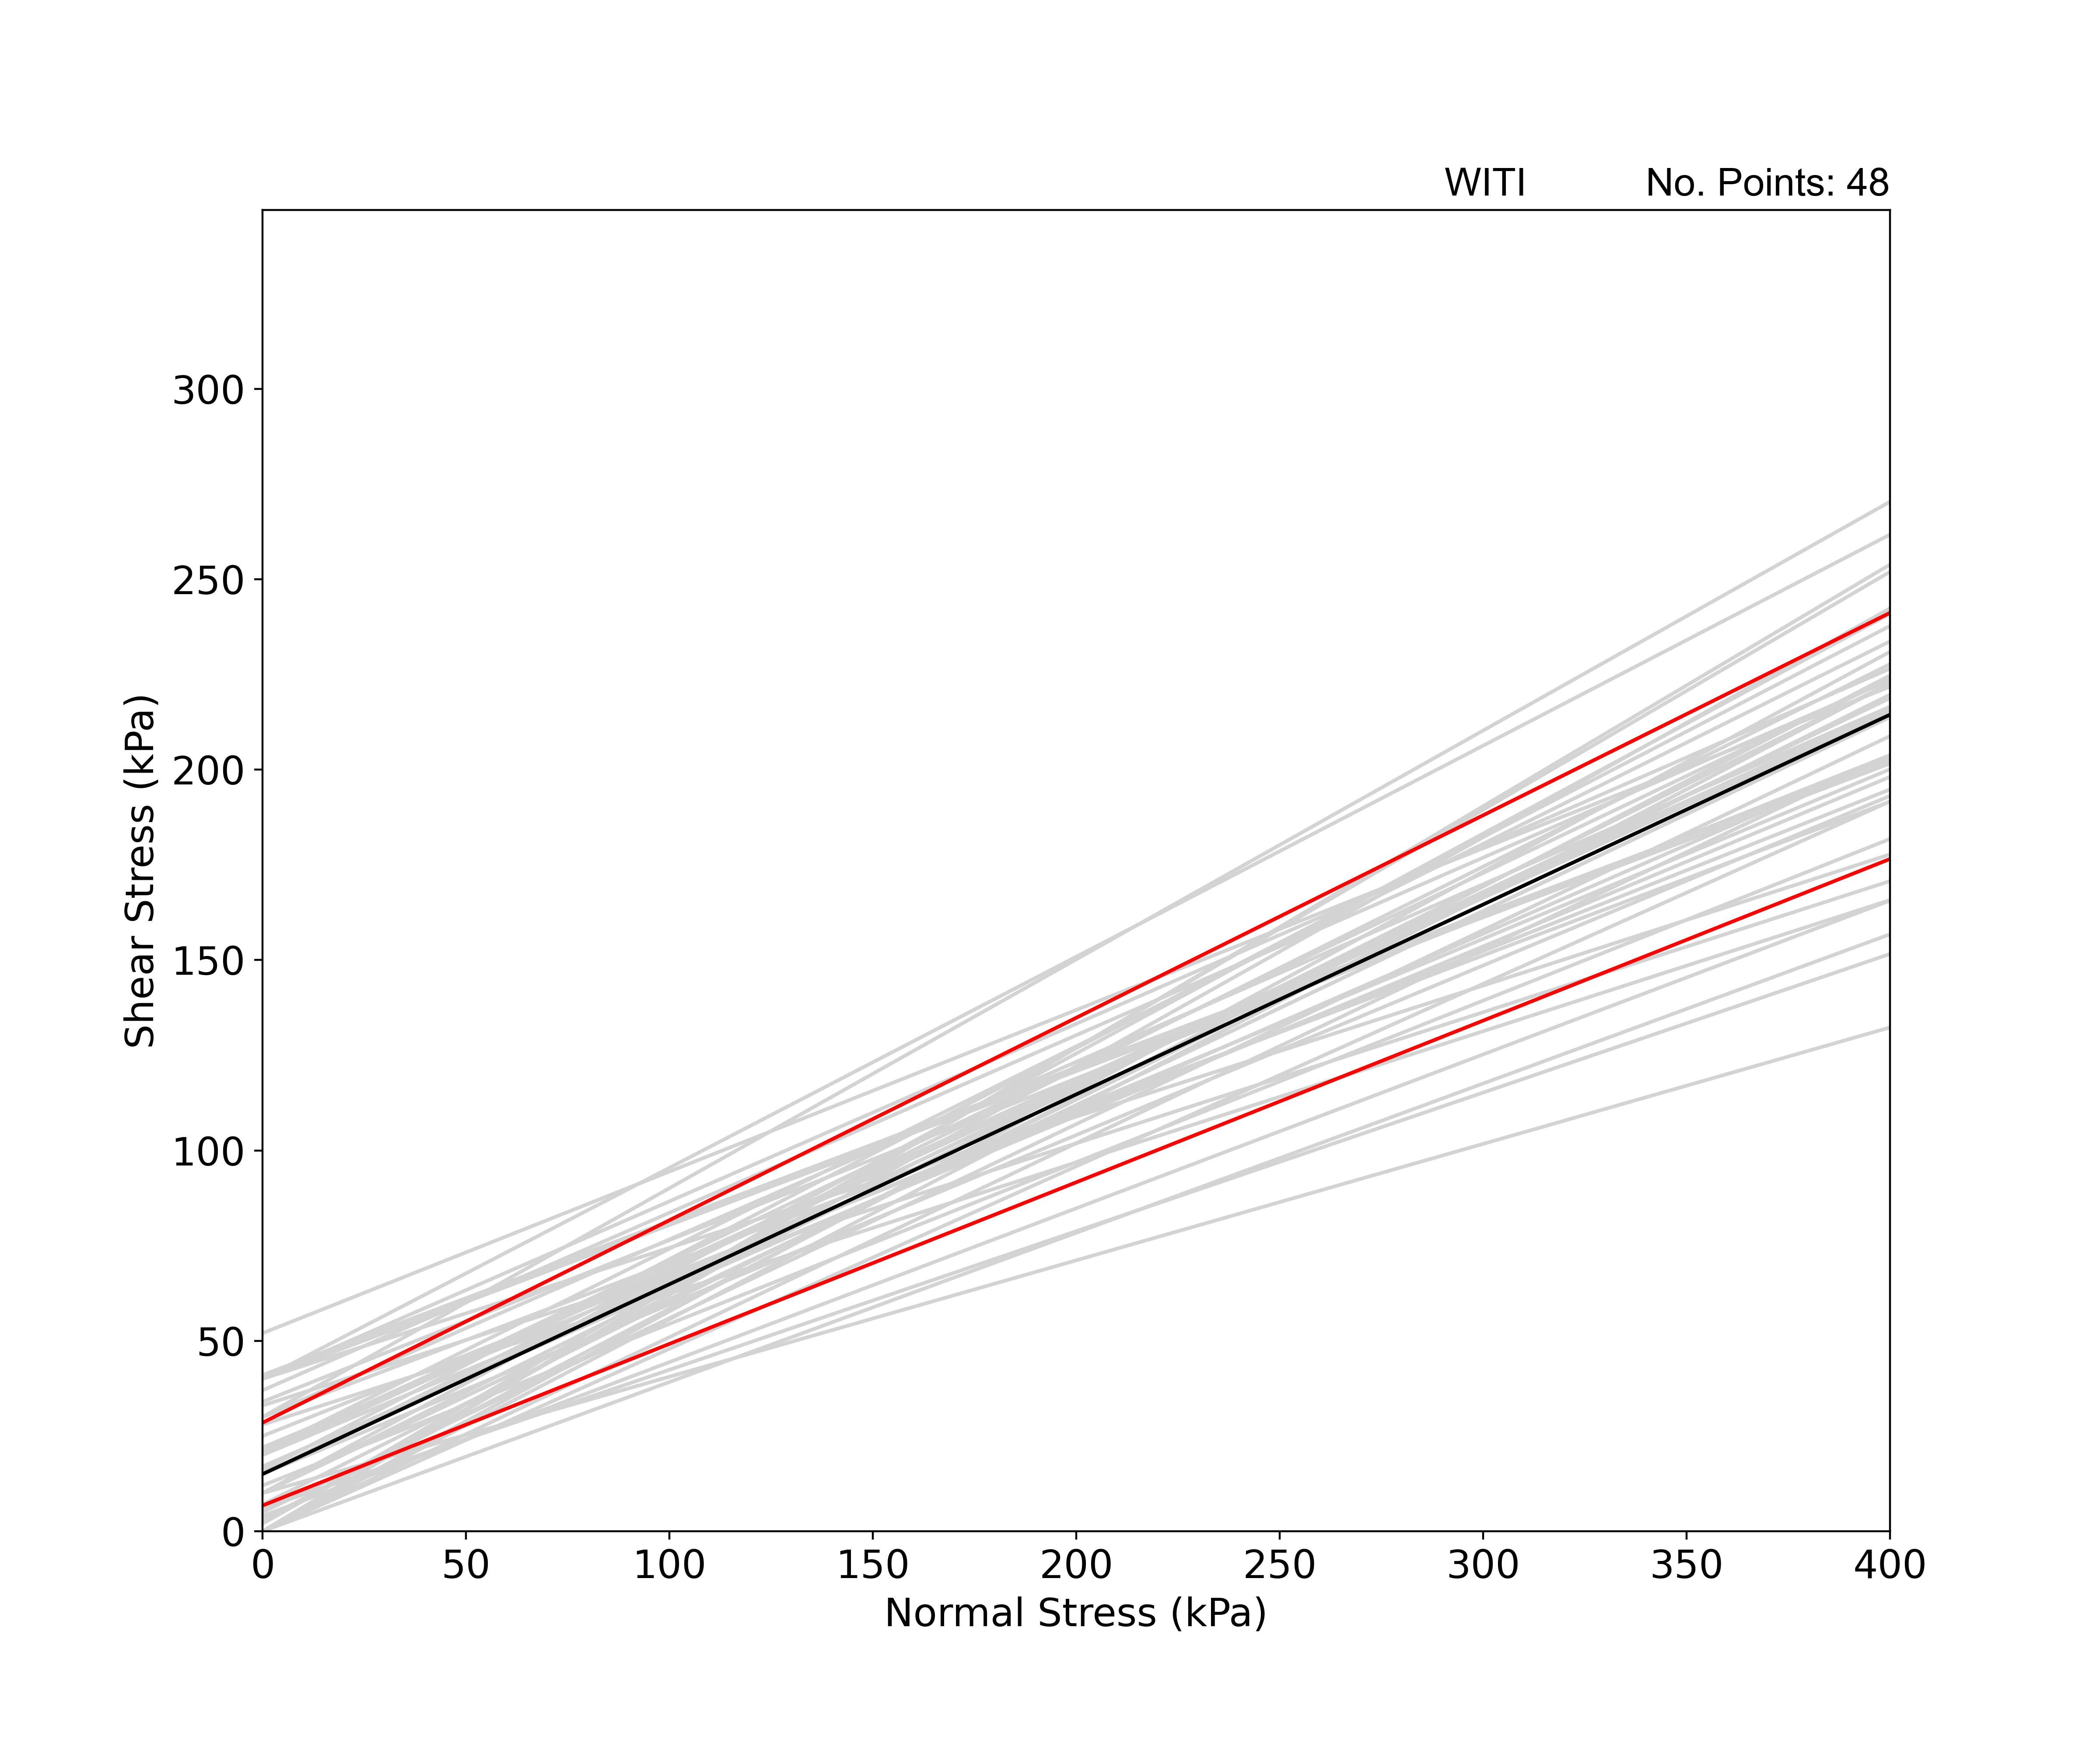
Geotechnical properties: strength tests
Mohr-Coulomb failure plot showing individual failure envelopes (light grey), median failure envelope (black) and 25th and 75th percentile failure envelopes (red) based on effective cohesion and phi values obtained from consolidated drained triaxial tests and consolidated undrained triaxial tests with pore pressure measurements. BGS © UKRI.
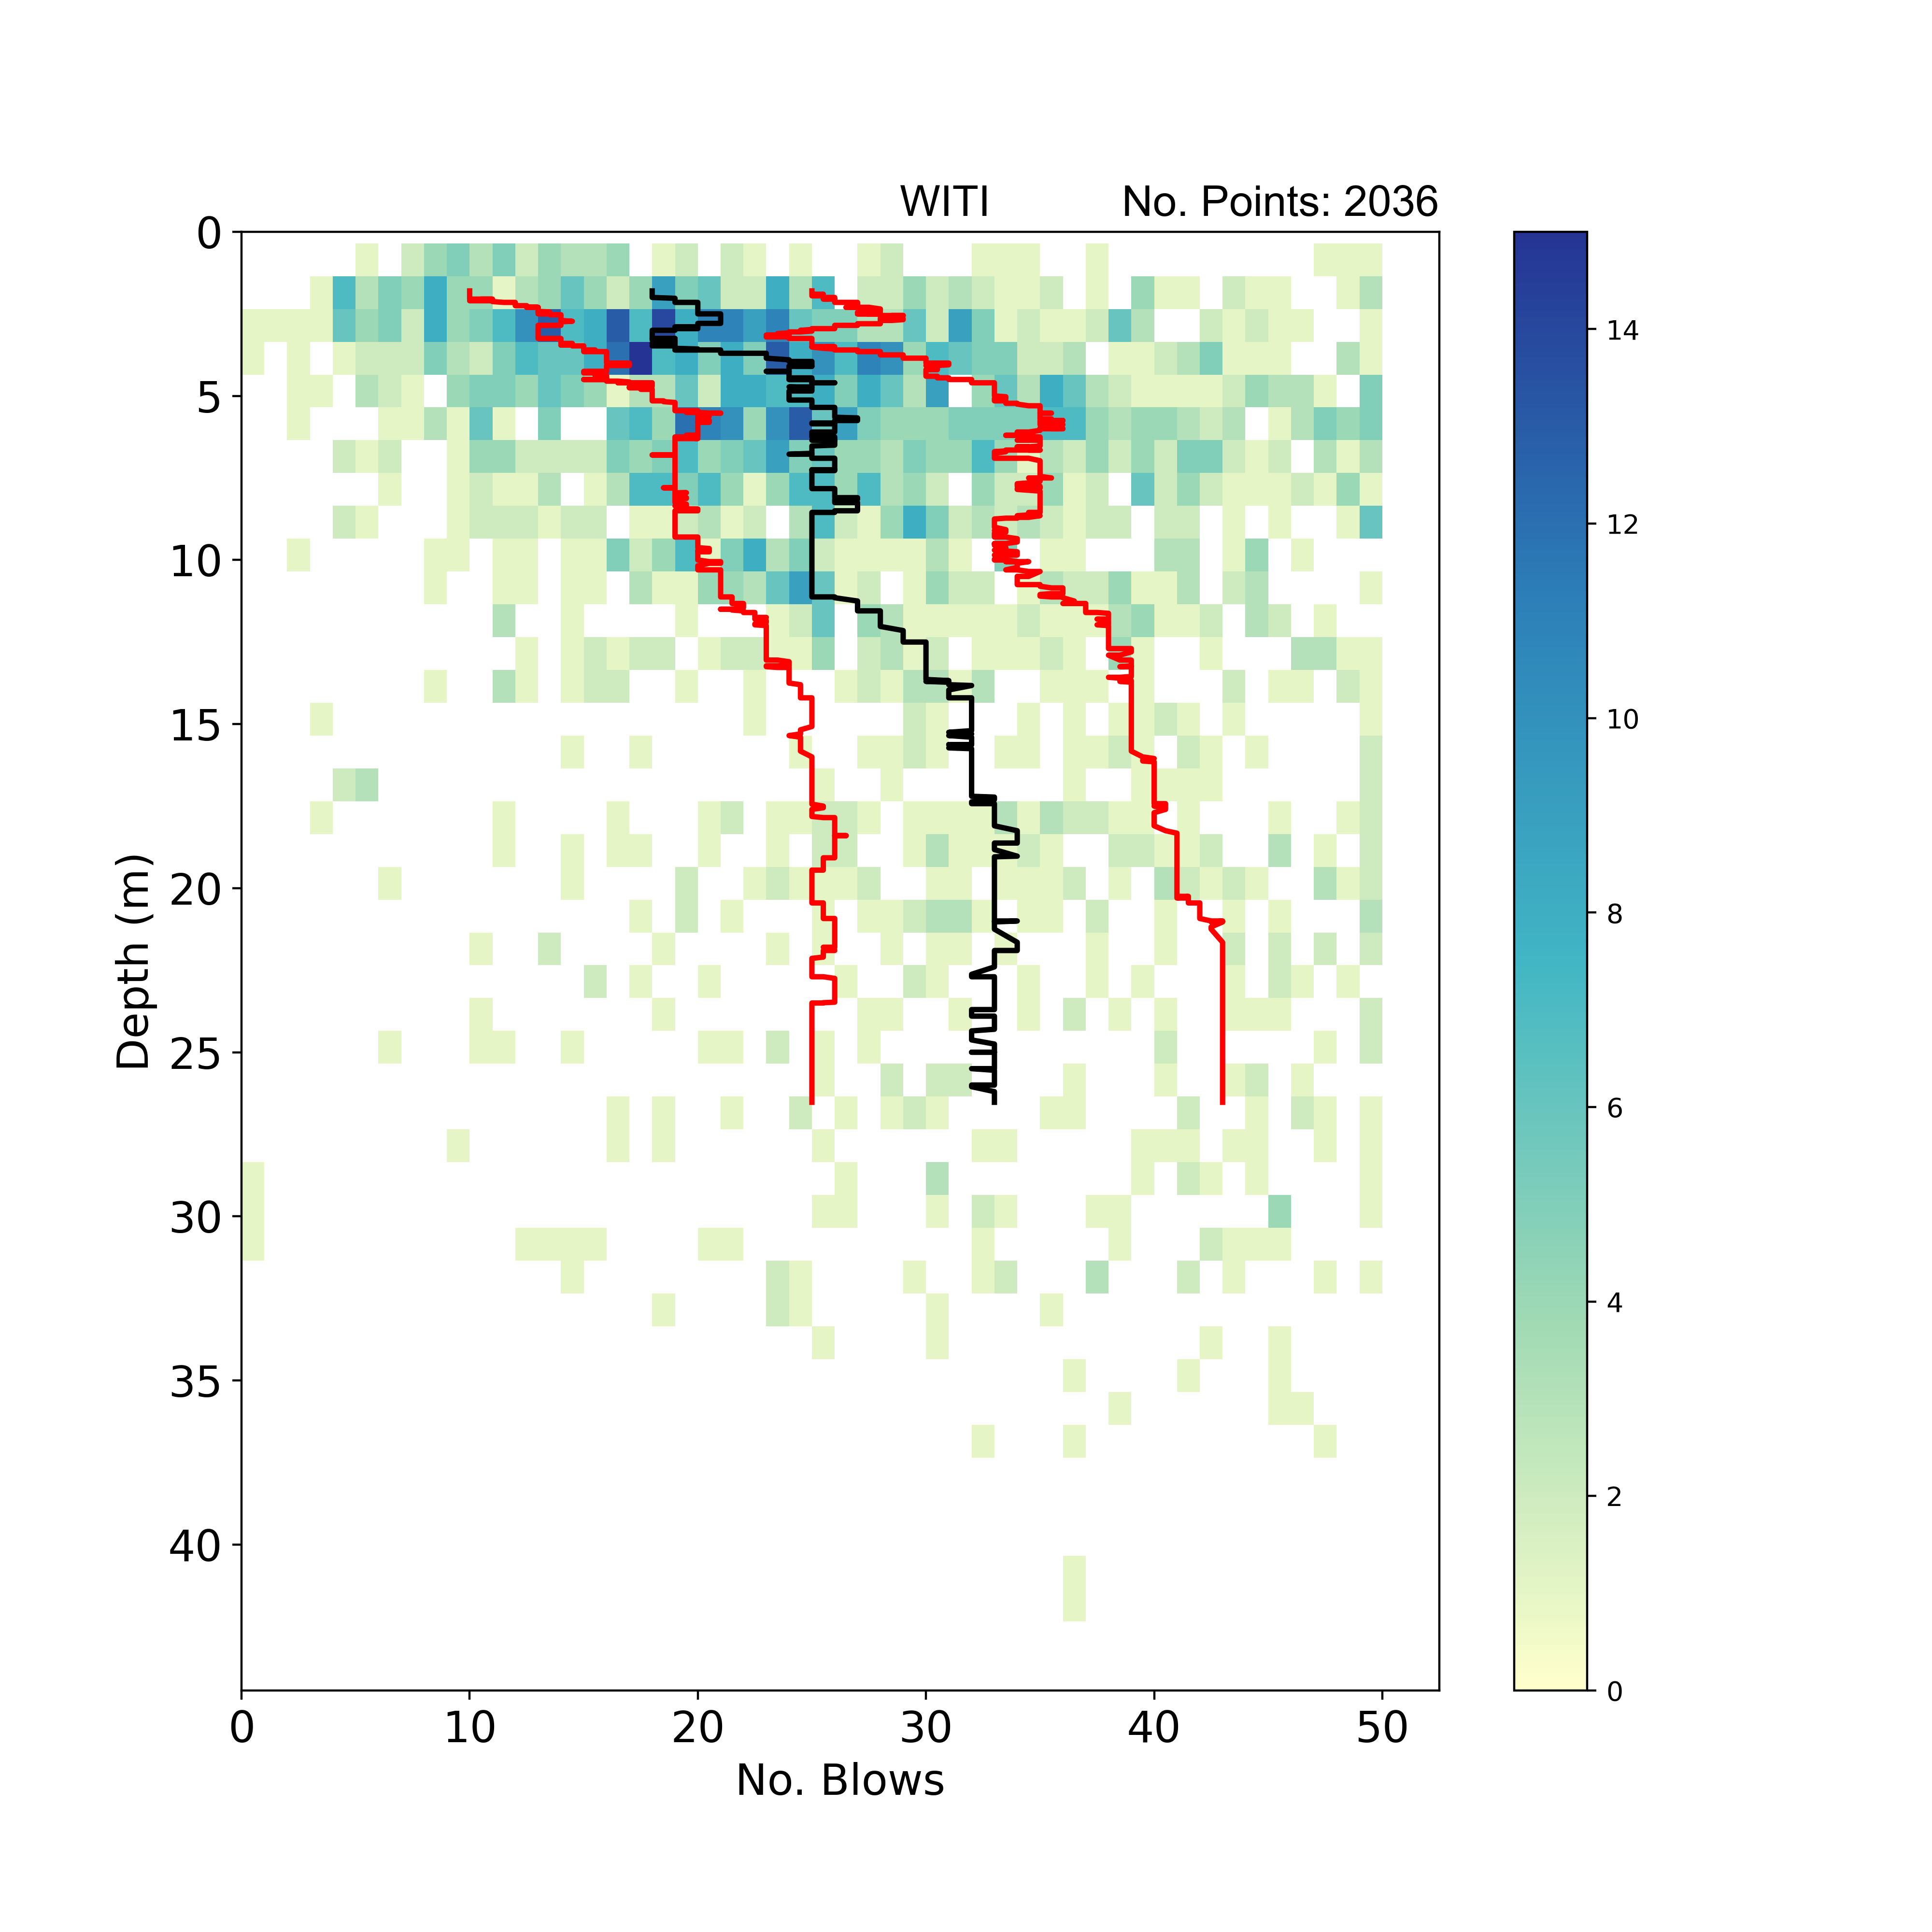
Geotechnical properties: strength tests
2D histogram summarising SPT N-value results with depth. Black line: SPT N-value with depth trend using a rolling window median (window width = 10 per cent sample number); red lines: SPT N-value with depth trend using a rolling window of 25th and 75th percentile (window width = 10 per cent sample number). Number of tests with N-value > 50 or with no N-value = 150. BGS © UKRI.
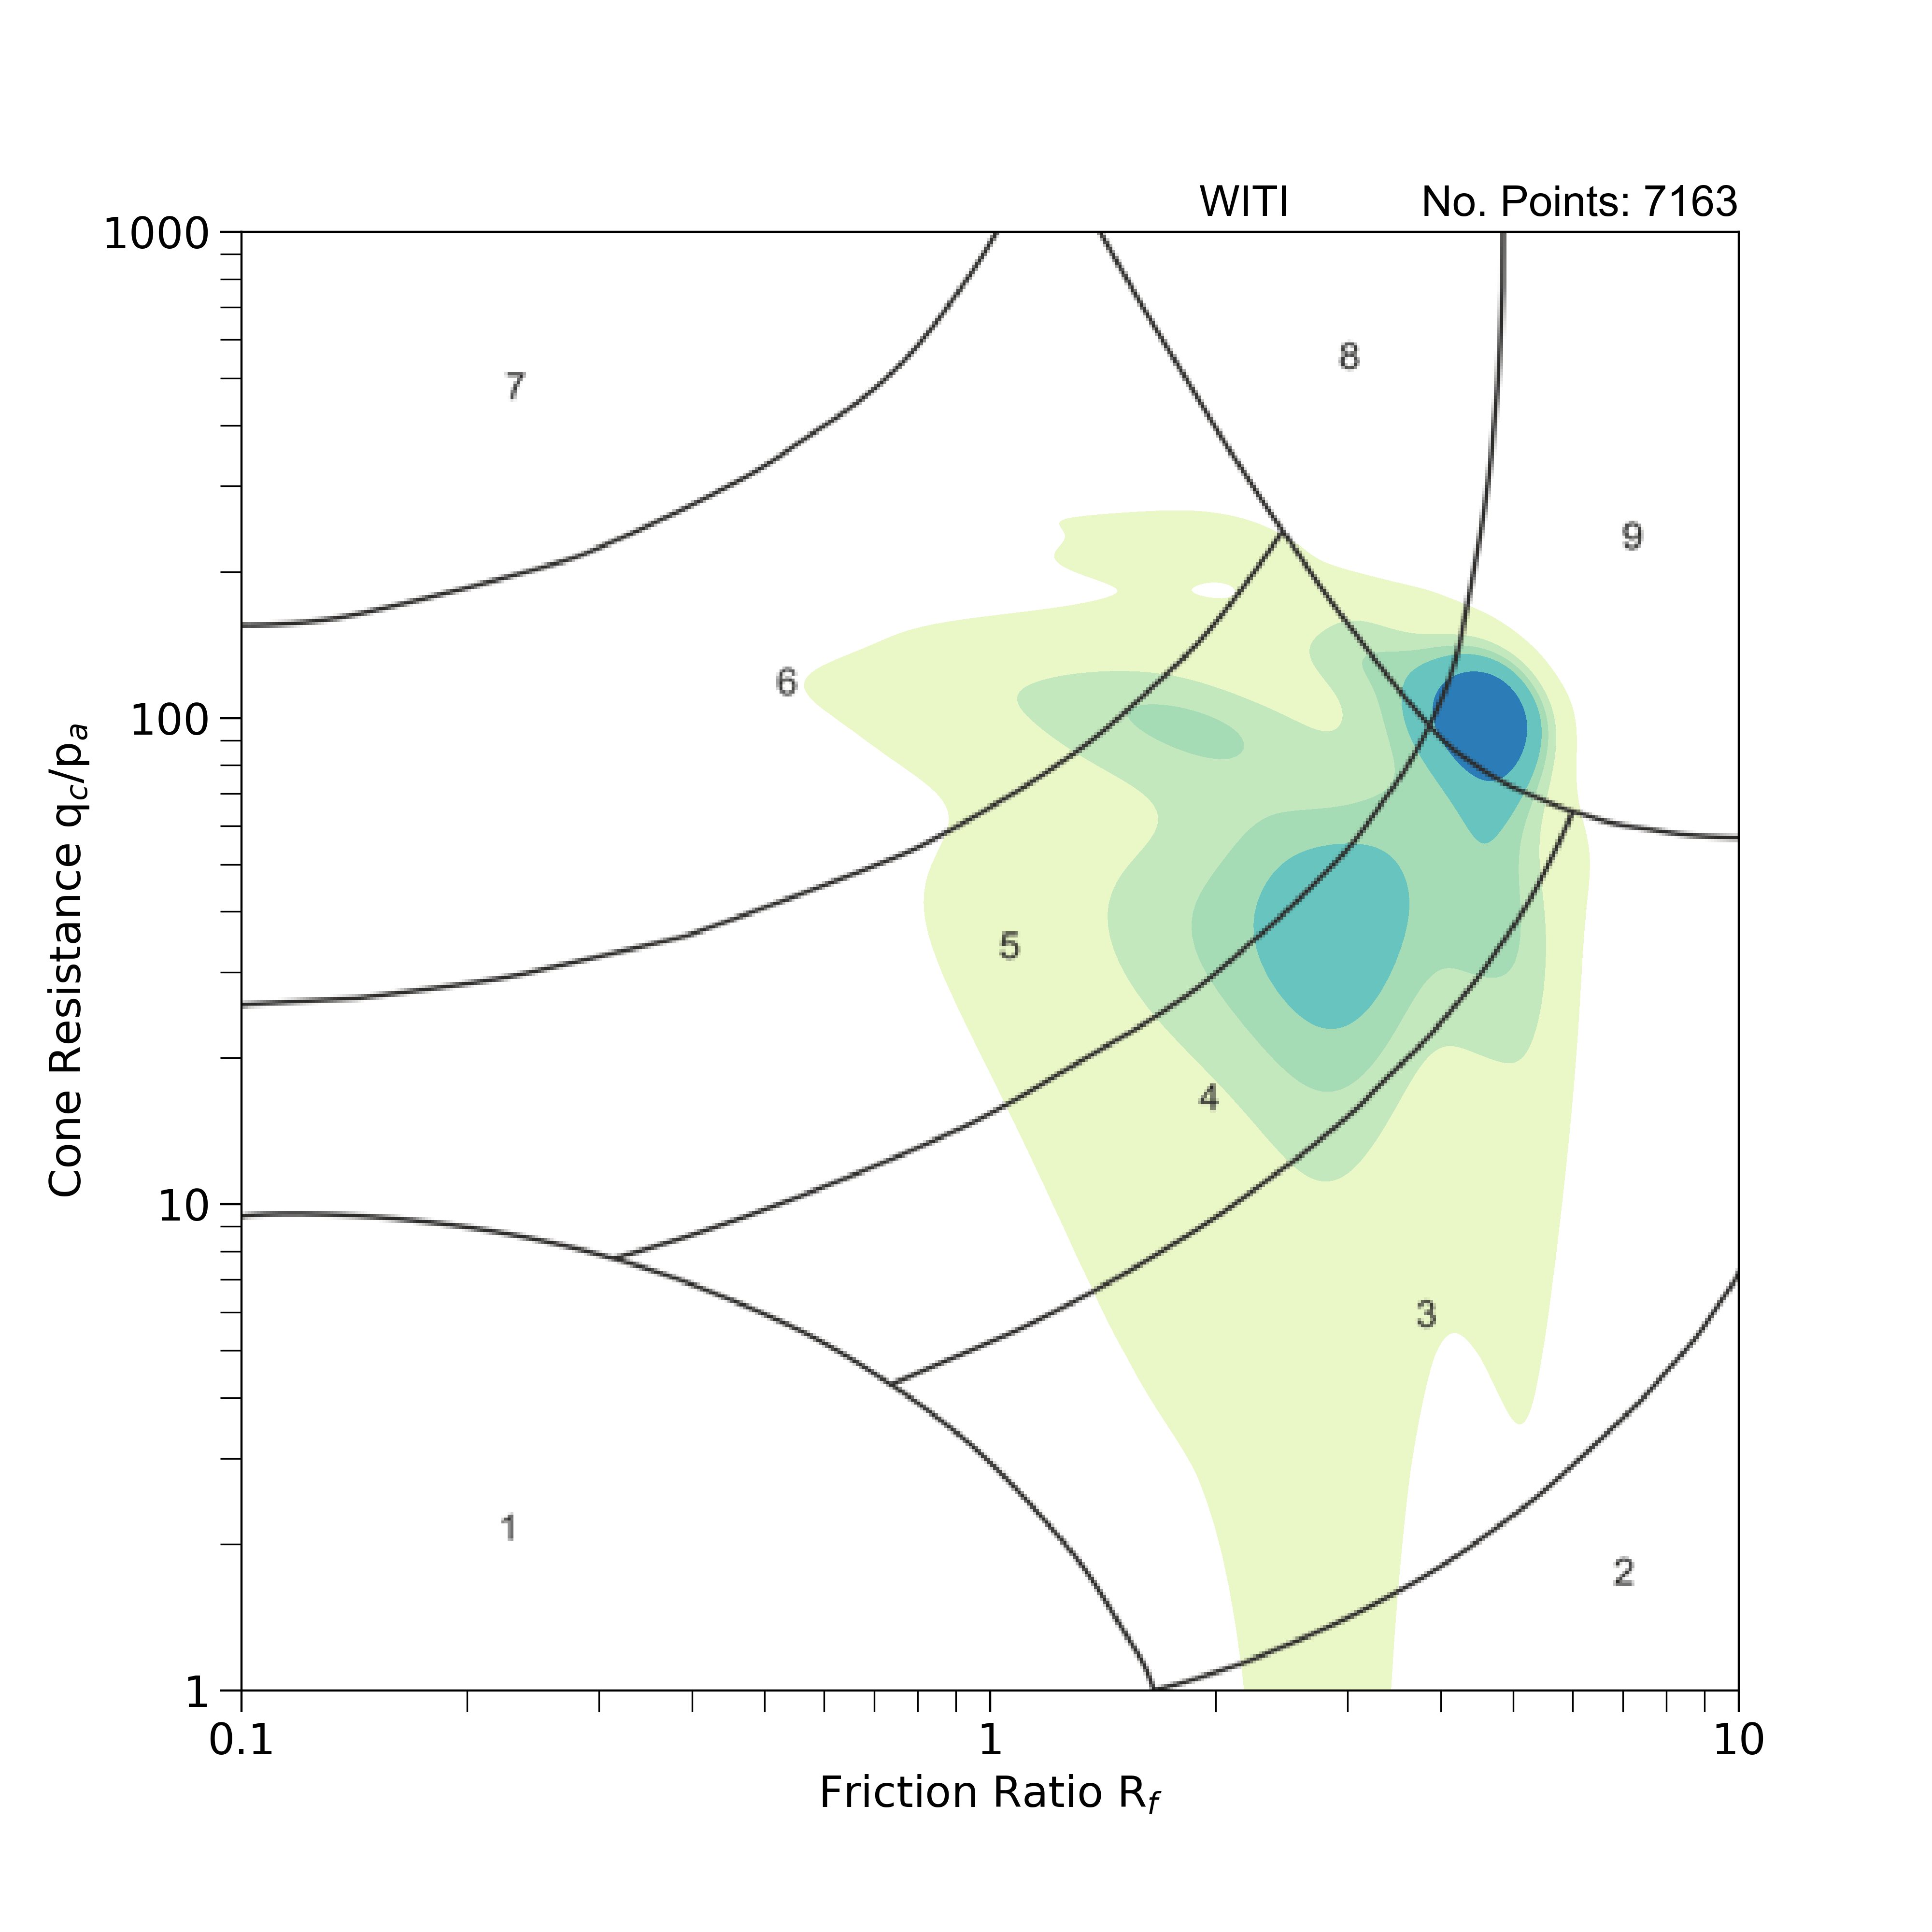
Geotechnical properties: strength tests
Non-normalised soil behaviour type chart after Robertson (2010) with 2D kernel density estimation of dimensionless cone resistance and friction ratio obtained from cone penetration tests. 1: sensitive fine-grained; 2: clay — organic soil; 3: clays — clay to silty clay; 4: silt mixtures — clayey silt and silty clay; 5: sand mixtures — silty sand to sandy silt; 6: sands — cleans sands to silty sands; 7: dense sand to gravelly sand; 8: stiff sand to clayey sand (overconsolidated or cemented); 9: stiff fine-grained (overconsolidated or cemented). BGD © UKRI.