
In the south of England, 251 sites have been sampled for methane from a number of different aquifers. The two main aquifers are the Chalk Group and the Lower Greensand Group.
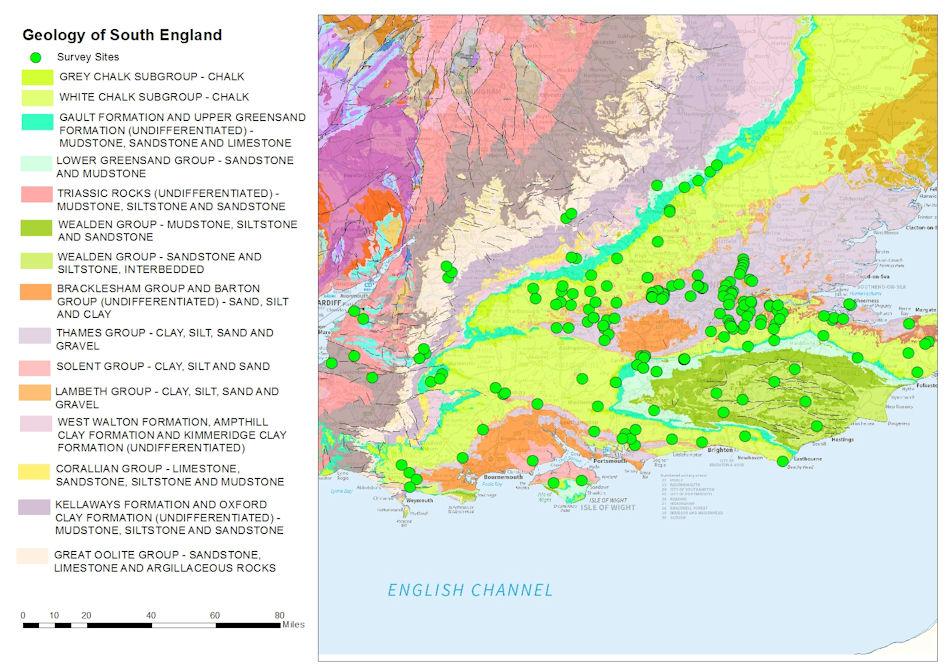

Geology of southern England. Contains Ordnance Survey data © Crown copyright and database rights 2015. BGS © UKRI.
Chalk
The Chalk is a principal aquifer in southern England, used extensively for public water supply. It has a high porosity but low matrix permeability, and groundwater flows through a well-developed interconnected network of fractures. The Chalk crops out in the Chilterns, the North and South Downs, Salisbury Plain, the Wessex Downs and on the south coast. It reaches a maximum thickness of 200 m.
Lower Greensand
The Lower Greensand aquifer consists of sands and sandstones, and groundwater flow is mainly through the pore spaces in the rock where the sand is unconsolidated. Groundwater from this aquifer is also used for public water supply. The Lower Greensand crops out around the edge of the Weald and reaches a maximum thickness of 220 m.
Shale units
A NSTA report on the Jurassic shales of the Weald Basin reported that there is unlikely to be any shale gas potential in this region, but there could be shale oil reserves, although how much of this could be recovered is unknown. The shale units present in this region are:
- Kimmeridge Clay Formation
- Ampthill Clay Formation
- Kellaways Formation
- Oxford Clay Formation
- Osgodby Formation
- Lias Group
The Kimmeridge Clay and Amptill Clay formations consist of mainly black shales; the Kellaways, Oxford Clay and Osgodby formations consist of mudstones, clays and siltstones.
Results
These summaries are based on the results collected from single visits to each site for the purpose of the methane baseline project. The data are summarised for the Southern England region as a whole, and also for individual aquifers, where enough data are available.
The blue boxes highlight where summary data are available for baseline groundwater quality in the different aquifers present in this region, and link to the summaries for each region.

Methane concentrations chart for southern England. BGS © UKRI.
| Area | Concentration | (mg/l) | No. samples | |
|---|---|---|---|---|
| Minimum | Median | Maximum | ||
| Southern England | <0.00005 | 0.0013 | 4.72 | 251 |
| Chalk | <0.00005 | 0.0005 | 0.083 | 137 |
| Greensand | <0.00005 | 0.0049 | 0.105 | 54 |
Methane samples and concentrations in Southern England. Note: values less than the analytical detection limit have been converted to half the detection limit for the purposes of this statistical summary and graph, but the relevant detection limit is quoted in the table. Thames Water and the Environment Agency are acknowledged for additional sample collection.
Baseline groundwater quality data
This data was collected as part of a collaborative project between BGS and the Environment Agency to investigate the baseline quality of groundwater in major UK aquifers. The UK baseline study results page provides downloads of all the reports produced by the project.
Chalk of the North Downs, Kent and east Surrey
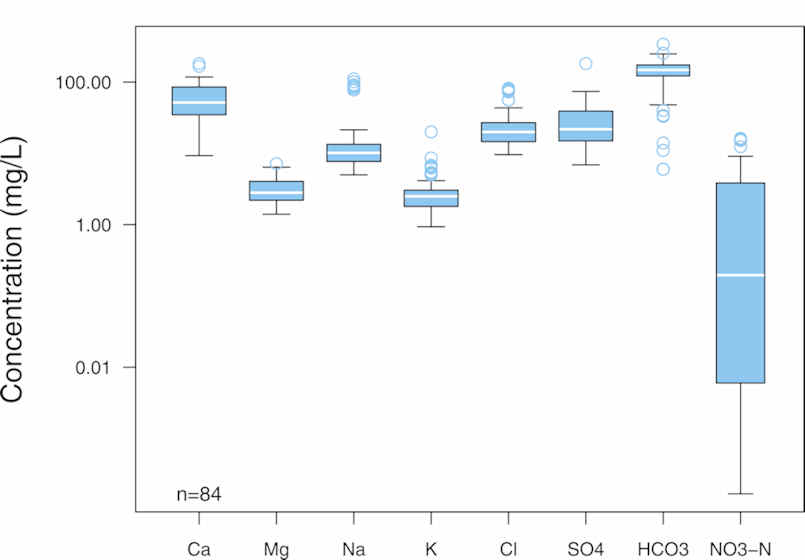
The Chalk in this region generally contains water of high quality, the main properties being determined by natural reactions between rain water and the carbonate rock (HCO3).
Groundwater is oxidising in the unconfined areas, but becomes rapidly reducing once confined by the Palaeogene deposits. The confined groundwaters are typically fresh and of pristine pre-industrial quality but may contain residual concentrations of chloride (Cl) from older water at depth. Some unconfined Chalk groundwaters show the effects of pollution from industrial, domestic and agricultural sources.
| Analysis | Concentration | (mg/l) | No. samples | |
|---|---|---|---|---|
| Minimum | Median | Maximum | ||
| Ca | 15.7 | 116 | 399 | 132 |
| Mg | 1.1 | 2.8 | 689 | 132 |
| Na | 6.2 | 15 | 5820 | 132 |
| K | <0.4 | 1.92 | 175 | 132 |
| Cl | 10 | 26 | 10700 | 134 |
| SO4 | <10 | 21.4 | 1140 | 133 |
| HCO3 | 162 | 274 | 493 | 108 |
| NO3.N | <0.01 | 6.2 | 28.2 | 133 |
Baseline quality data for the Chalk in the North Downs, Kent and east Surrey.
Lower Greensand
The groundwater in the Lower Greensand is fresher than water from most other aquifers in the UK, mainly due to the relative purity of the sands and often short residence times. The low salinity of the groundwater even in the deep confined parts of the aquifer shows that it has been well flushed of any older water.
Where the aquifer is confined, the groundwater is more reducing and has higher iron concentrations.
| Analysis | Concentration | (mg/l) | No. samples | |
|---|---|---|---|---|
| Minimum | Median | Maximum | ||
| Ca | 37 | 106 | 143 | 59 |
| Mg | 1.59 | 2.5 | 19.4 | 59 |
| Na | 6 | 11.2 | 155 | 59 |
| K | 0.5 | 1.7 | 7 | 33 |
| Cl | 14 | 21 | 223 | 59 |
| SO4 | <5 | 13.6 | 52.2 | 60 |
| HCO3 | 107 | 271 | 324 | 33 |
| NO3.N | <0.1 | 6.6 | 12 | 59 |
Baseline quality data for the Lower Greensand in southern England.
Chalk in Dorset
The Dorset Chalk contains groundwater predominately of very high quality. However, much of the area is farmed, the long-term effects of which have affected the natural groundwater quality. The main observed effect of agricultural activity has been the increase in nitrate (NO3.N) and potassium (K) over several decades. Apart from these examples, there is no evidence of widespread contamination from urban and rural wastes or other sources of pollution.
Oxidising conditions found in the unconfined aquifer rapidly give way to a reducing environment as the aquifer becomes confined beneath Palaeogene deposits.
| Analysis | Concentration | (mg/l) | No. samples | |
|---|---|---|---|---|
| Minimum | Median | Maximum | ||
| Ca | 37 | 106 | 143 | 59 |
| Mg | 1.59 | 2.5 | 19.4 | 59 |
| Na | 6 | 11.2 | 155 | 59 |
| K | 0.5 | 1.7 | 7 | 33 |
| Cl | 14 | 21 | 223 | 59 |
| SO4 | <5 | 13.6 | 52.2 | 60 |
| HCO3 | 107 | 271 | 324 | 33 |
| NO3.N | <0.1 | 6.6 | 12 | 59 |
Baseline quality data for the Lower Greensand in southern England.
Palaeogene
The water quality of oxidising Palaeogene groundwaters of near-neutral pH is, in the most part, good. High iron and manganese as well as slightly acidic conditions are characteristics of the Palaeogene groundwaters. In these more acidic groundwaters, mobilisation of some trace metals can occur.
Some unconfined waters in the Palaeogene are influenced by agricultural activities, showing elevated nitrate (NO3.N) concentrations.
The hydrochemical properties of the groundwaters in the Palaeogene aquifers are primarily determined by natural reactions between recharge water and the Palaeogene host rocks.

| Analysis | Concentration | (mg/l) | No. samples | |
|---|---|---|---|---|
| Minimum | Median | Maximum | ||
| Ca | 5.2 | 46.1 | 128 | 26 |
| Mg | 1.72 | 5.35 | 15.7 | 26 |
| Na | 11.4 | 19 | 111 | 26 |
| K | 0.9 | 2.4 | 15.5 | 26 |
| Cl | 17.4 | 33.3 | 108 | 26 |
| SO4 | 2.7 | 27.4 | 91.8 | 26 |
| HCO3 | 5 | 153 | 315 | 25 |
| NO3.N | <0.01 | 0.0244 | 34.8 | 26 |
Baseline quality data for the Palaeogene in southern England.