
In the East Midlands, 93 sites have been sampled in the three main aquifers: the Lincolnshire Limestone Formation, Permo-Triassic sandstone and the Chalk Group.
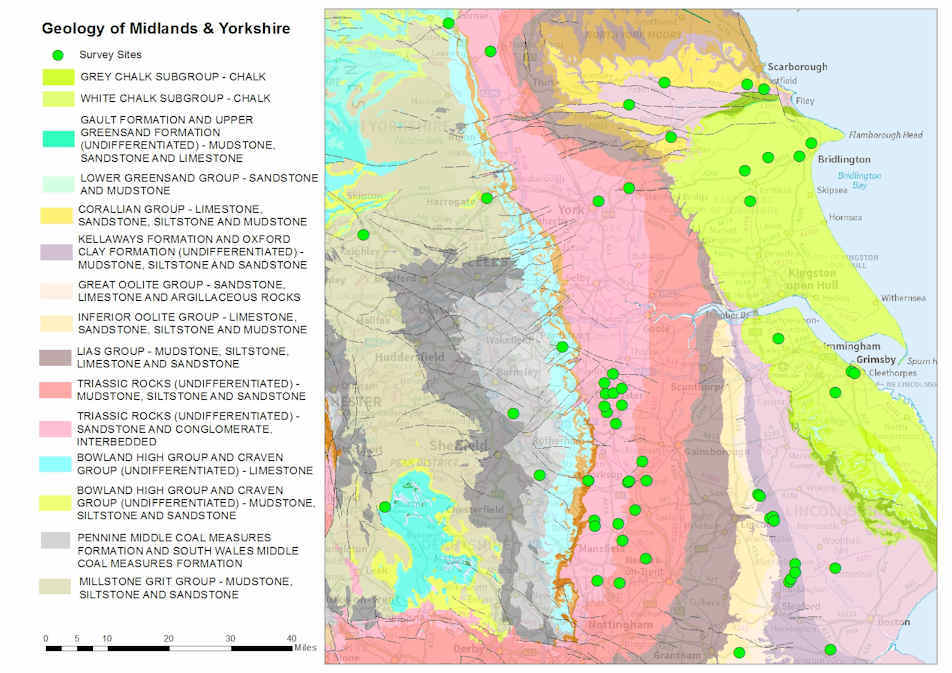

Geology of the East Midlands. Contains Ordnance Survey data © Crown copyright and database rights 2015. BGS © UKRI.
Lincolnshire Limestone
The Lincolnshire Limestone is a hard, fractured aquifer and groundwater flows almost entirely by fracture flow along bedding planes. Abstraction for public water supply takes place mainly in the confined region, where the groundwater is artesian. It has a maximum thickness of 40 m in south Lincolnshire.
Permo–Triassic sandstone
Permo–Triassic sandstone is the UK’s second most important aquifer and has a high porosity, which means the majority of flow occurs through the pore spaces in the rock. The water from this aquifer is generally of good quality and is exploited for a wide range of uses. It has a maximum thickness of 180 m in Yorkshire.
Chalk
The Chalk aquifer of Yorkshire and Humberside is a productive fractured aquifer that crops out in the Yorkshire Wolds. It has a total thickness of 430 m. A large proportion of public water supply in the region is derived from this aquifer.
Shale units
There are a number of shale units present in this area, including:
The Bowland Shale Formation and the Craven Group are reported to have the potential to form a shale gas resource (NSTA Bowland shale gas study 2013) in addition to the Kimmeridge Clay Formation (The unconventional hydrocarbons of Britain’s onshore basins: shale gas).
The Lias Group, Kellaways Formation, Oxford Clay Formation and Osgodby Formation are thought to be too immature for shale gas.
Results
These summaries are based on the results collected from single visits to each site for the purpose of the methane baseline project. The data is summarised for the Midlands and Yorkshire as a whole and for individual aquifers, where enough data is available.
The blue boxes highlight where summary data is available for baseline groundwater quality in the different aquifers present in this region and link to the summaries for each region.
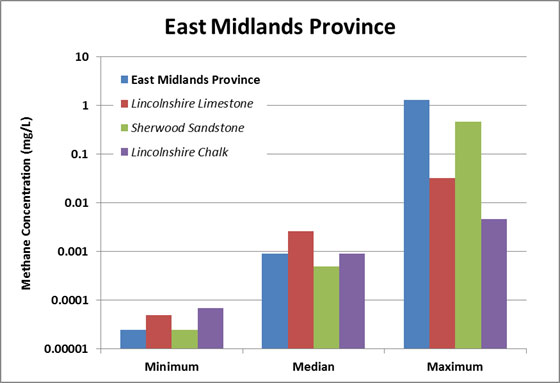
Methane concentrations chart for the East Midlands and Yorkshire. BGS © UKRI.
| Area | Concentration | (mg/l) | No. samples | |
|---|---|---|---|---|
| Minimum | Median | Maximum | ||
| East Midlands | <0.00005 | 0.0009 | 1.32 | 93 |
| Lincolnshire Limestone | 0.00005 | 0.0026 | 0.032 | 13 |
| Sherwood Sandstone (P/T sst) | <0.00005 | 0.0005 | 0.465 | 34 |
| Lincolnshire Chalk | 0.00007 | 0.0009 | 0.0047 | 23 |
Methane samples and concentrations in the East Midlands. Note: values less than the analytical detection limit have been converted to half the detection limit for the purposes of this statistical summary and graph, but the relevant detection limit is quoted in the table.
Baseline groundwater quality data
This data was collected as part of a collaborative project between BGS and the Environment Agency to investigate the baseline quality of groundwater in major UK aquifers. The UK baseline study results page provides downloads of all the reports produced by the project.
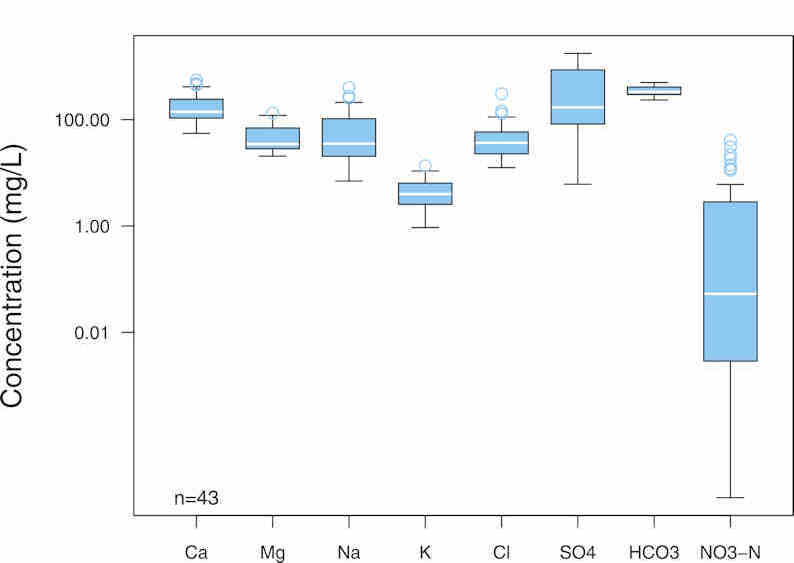
Permo–Triassic sandstone
The quality of groundwater in the Permo–Triassic sandstone is determined by natural reactions between rainwater and the bedrock, which creates a variable baseline. Nitrate (NO3.N) and chloride (Cl) are elevated due to agricultural and industrial practices and the groundwater can have a higher salinity in the confined part of the aquifer.
| Analysis | Concentration | (mg/l) | No. samples | |
|---|---|---|---|---|
| Minimum | Median | Maximum | ||
| Ca | 55.3 | 140 | 556 | 43 |
| Mg | 20.6 | 34.7 | 133 | 43 |
| Na | 7 | 35.3 | 402 | 43 |
| K | <0.6 | 4 | 13.5 | 43 |
| Cl | 12.5 | 36.6 | 307 | 43 |
| SO4 | 6.1 | 170 | 1760 | 43 |
| HCO3 | 234 | 333 | 498 | 43 |
| NO3.N | <0.0025 | 0.053 | 41.1 | 43 |
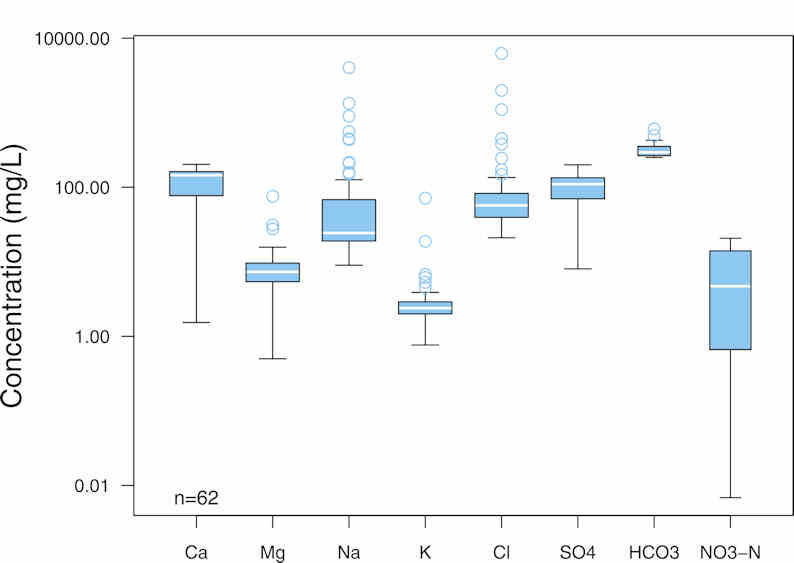
Lincolnshire Limestone
The quality of the water varies considerably between the unconfined and confined regions in the Lincolnshire Limestone. In the recharge areas, the water is fresh, although impacted by agricultural pollution, whereas the confined groundwaters are old and reducing, and can be of poor quality.
| Analysis | Concentration | (mg/l) | No. samples | |
|---|---|---|---|---|
| Minimum | Median | Maximum | ||
| Ca | 1.53 | 144 | 203 | 62 |
| Mg | 0.5 | 7.3 | 75.5 | 62 |
| Na | 9 | 23.7 | 4030 | 62 |
| K | <1 | 2.37 | 71.5 | 62 |
| Cl | 21 | 57.1 | 6250 | 62 |
| SO4 | <0.2 | 110 | 200 | 62 |
| HCO3 | 251 | 294 | 606 | 23 |
| NO3.N | <0.003 | 4.7 | 20.7 | 37 |
Chalk
The quality of groundwater in the Chalk aquifer of Yorkshire and Humberside is very variable due to a number of geochemical processes. The Chalk groundwater is generally hard and the unconfined areas have been affected by sea-water intrusion and human activities, such as pollution from agriculture. Groundwater in the confined and semi-confined sections of the aquifer has some protection from the effects of pollution.
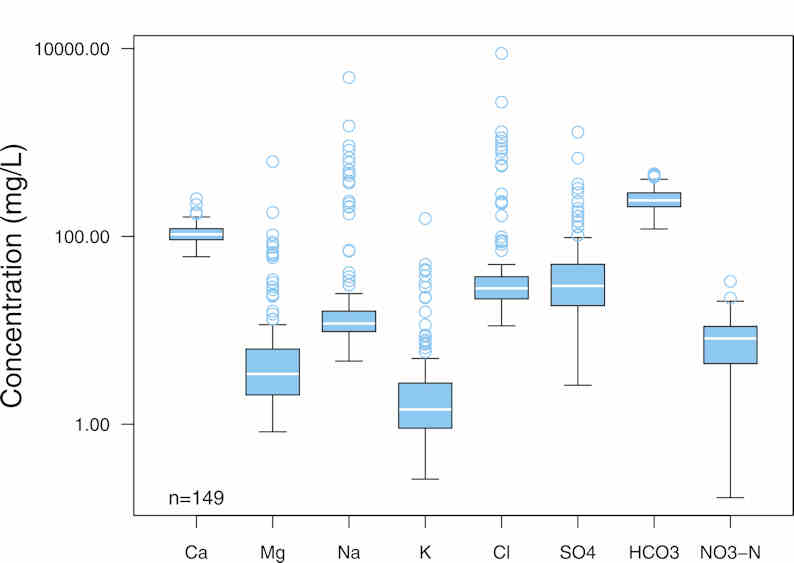
| Analysis | Concentration | (mg/l) | No. samples | |
|---|---|---|---|---|
| Minimum | Median | Maximum | ||
| Ca | 60.8 | 105 | 252 | 149 |
| Mg | 0.83 | 3.43 | 626 | 149 |
| Na | 4.7 | 11.8 | 4910 | 149 |
| K | 0.26 | 1.42 | 155 | 148 |
| Cl | 11.2 | 27.9 | 8890 | 149 |
| SO4 | <5 | 29.7 | 1290 | 149 |
| HCO3 | 120 | 241 | 464 | 148 |
| NO3.N | <0.2 | 8.01 | 33.2 | 148 |