
Two main aquifers exist within the Vale of Pickering. The first is a shallow, superficial aquifer consisting of Quaternary glacial and lake deposits in the lowland central part of the vale. These sediments consist of local sand and gravel horizons within deposits of mainly clay and silt, which reach thicknesses of up to around 40 m in parts of the vale (Figure 1).
The shallow sediments are designated by the Environment Agency (EA) as a secondary B aquifer. The Quaternary deposits are underlain by often weathered clay and occasional sandy horizons of Jurassic age (Kimmeridge Clay Formation). The superficial aquifer is used for small-scale, private water supply.
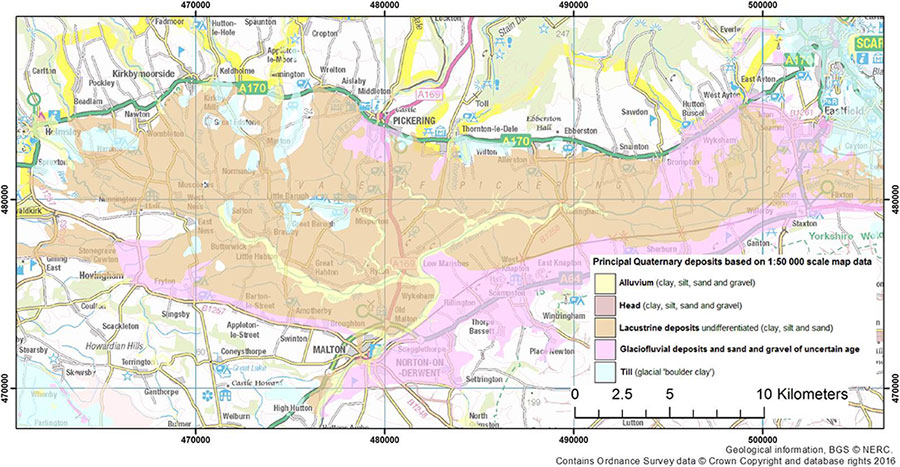

Figure 1 Superficial geology of the Vale of Pickering. BGS © UKRI.

Figure 2 Geological model of the Corallian Group strata showing depth variations, faults and location of boreholes (yellow) used in the construction of the model. BGS © UKRI.
The older Jurassic-aged Corallian Group aquifer crops out on the southern, western and northern margins of the vale and at depth below the Quaternary and Jurassic deposits (of the order of 200 m below ground level in the Kirby Misperton area).
The Corallian Group limestone forms a principal aquifer and is used for both public and private supply in the outcropping areas on the margins of the vale. In the central part, groundwater from the limestone is not used due to its depth and increased salinity. Geological modelling shows the prevalence of faulting, mostly with an east–west orientation, in the central part of the vale (Figure 2).
The Cretaceous-aged Chalk Group forms a further principal aquifer beyond the vale in the south east.
Water sampling
Note: water-quality monitoring was carried out by the operator at and around the Kirby Misperton (KMA) operational and former planned shale gas site. BGS’s monitoring investigations were additional and independent.
BGS established a monitoring network of groundwater and stream sites across the Vale of Pickering. Groundwater samples were taken (figures 3a and 3b) from both the superficial (Quaternary and shallow Kimmeridge Clay Formation) and Corallian Group limestone aquifers.
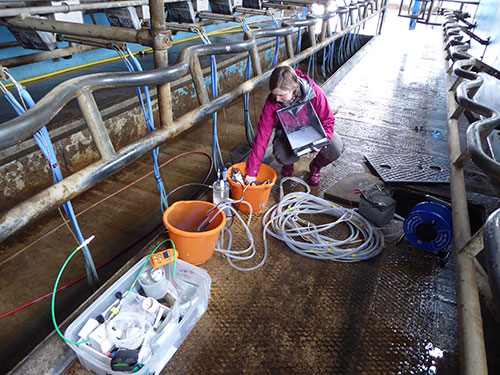
Figure 3a Sampling groundwater, Vale of Pickering. BGS © UKRI.
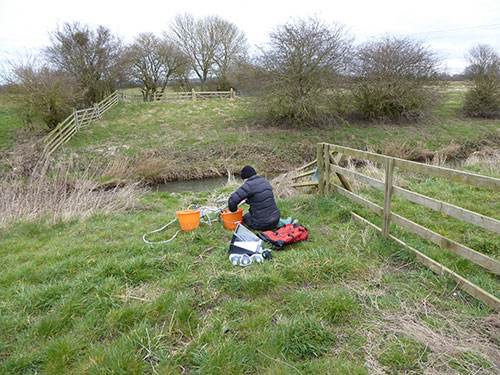
Figure 3b Sampling streams, Vale of Pickering. BGS © UKRI.
Sampling network
The network comprised 24 groundwater sites and 10 stream sites, most located within an approximate 10 km radius of the proposed shale gas exploration borehole at Kirby Misperton (KM8) (Figure 4). Sampling site selection was based on spatial geological and hydrogeological factors and logistic considerations.
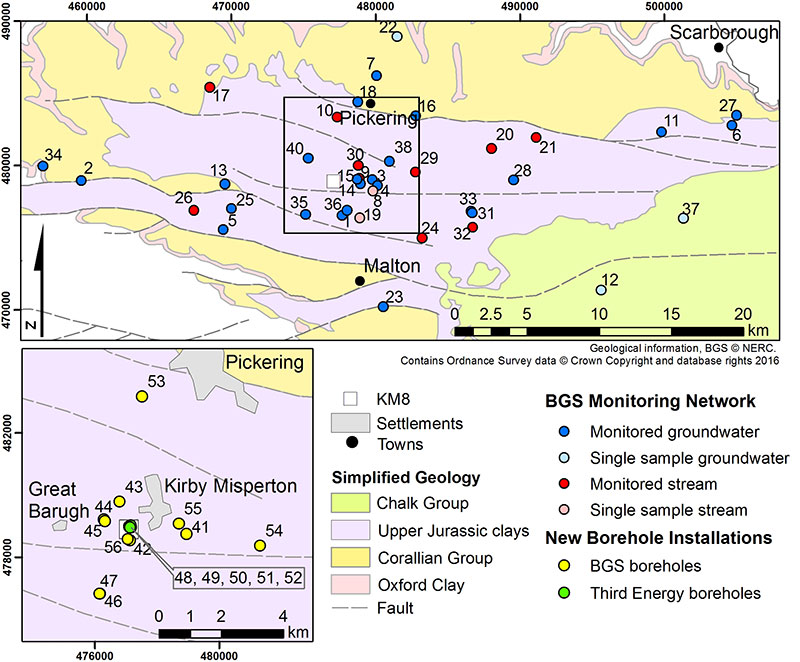
Figure 4 The water-monitoring network the Vale of Pickering, with new BGS boreholes for water and seismic investigations. BGS © UKRI.
Monitoring of water quality at each of the sites involved monthly or quarterly collection of groundwater and stream-water samples. This established a time series for evaluating baseline compositions.
Borehole installations
A set of groundwater monitoring boreholes was installed in the vicinity of the Kirby Misperton site (KMA) and its exploration borehole (KM8) (Figure 4). These include boreholes within the shallow, superficial aquifer (Quaternary and weathered Kimmeridge Clay Formation) and the deeper, Corallian Group limestone aquifer. Borehole locations were determined on the basis of proximity to KMA and on geological data provided by investigations of both the superficial geology (Ford et al., 2015) and geological modelling of the Corallian Group limestone strata. Seismometers were also installed in a number of the boreholes for monitoring of seismicity.
Results
Results from the eleventh round of water sampling (July 2016) are shown as examples of water quality in the figures. Summary data for inorganic constituents (major ions; selected minor constituents) are given for groundwater samples from the superficial aquifer (Figure 5), Corallian Group limestone aquifer (Figure 6) and stream waters (Figure 7). National standards for inorganic constituents in drinking water are given for reference only (red lines) — sites are, in many cases, not used for drinking water; none has been sampled from a compliance point.
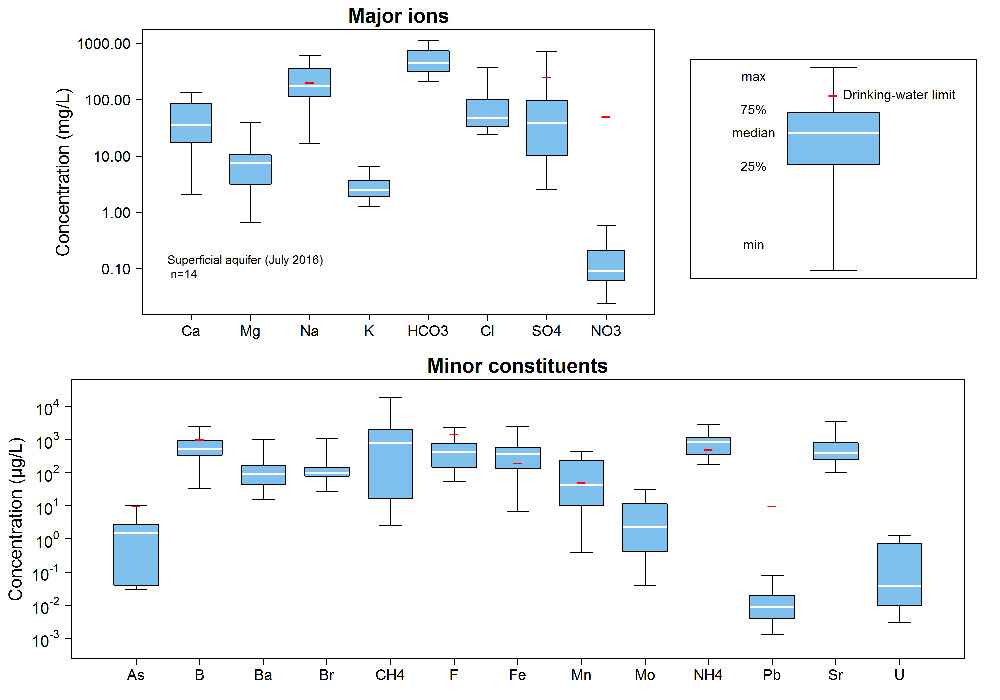
Figure 5 Box plots showing summary data for groundwater samples in the monitoring network from the superficial aquifer of the Vale of Pickering (sampled July 2016). BGS © UKRI.
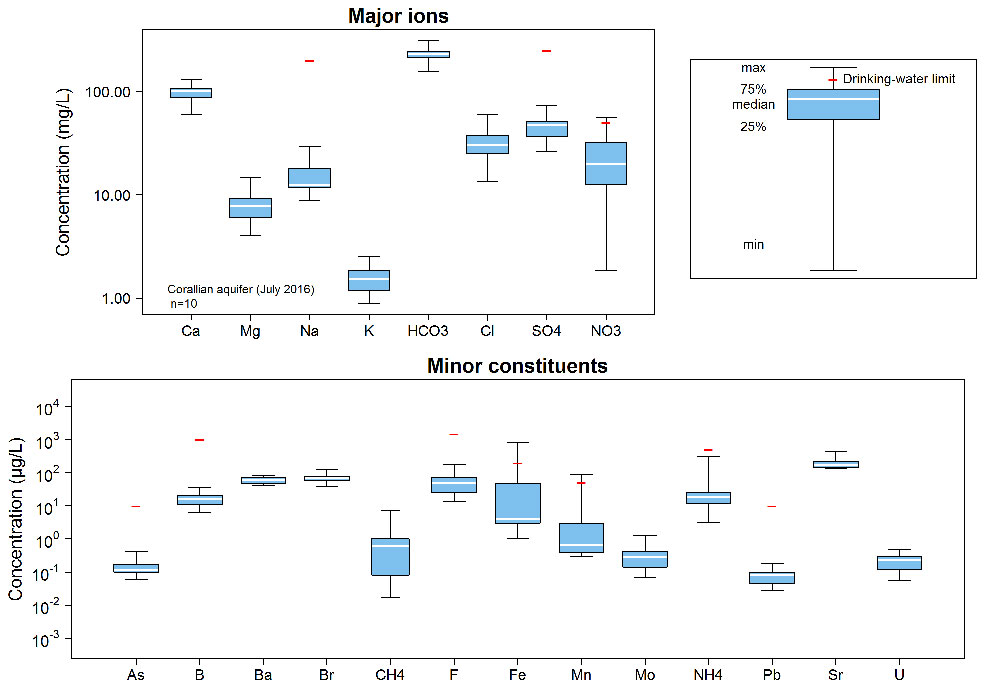
Figure 6 Box plots showing summary data for groundwater samples in the monitoring network from the Corallian Group limestone aquifer (confined and unconfined) on the margins of the Vale of Pickering (sampled July 2016). BGS © UKRI.
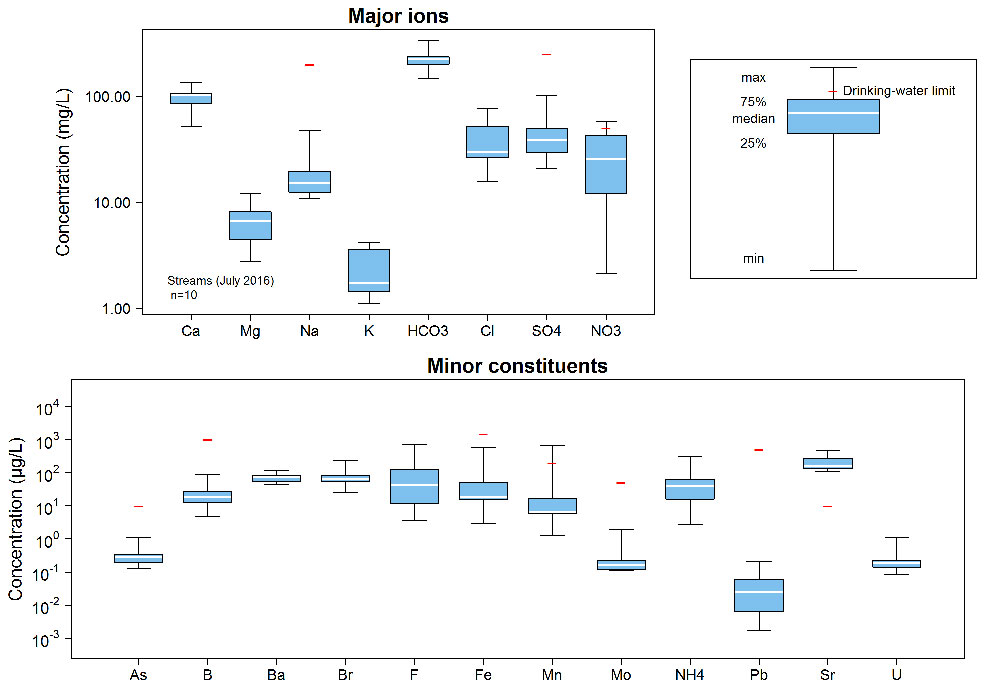
Figure 7 Box plots showing summary data for stream-water samples in the monitoring network from the Vale of Pickering (sampled July 2016). BGS © UKRI.
Results for the superficial aquifer (Figure 5) show the overwhelming anoxic nature of the groundwater, with mostly low concentrations of nitrate (NO3), some low concentrations of sulfate (SO4) and, often, relatively high concentrations of iron (Fe), manganese (Mn), ammonium (NH4) and occasionally arsenic (As). High concentrations of dissolved methane (CH4) are a feature of some groundwaters. Some, though not all, have relatively high salinity (total dissolved solids).
Results for the Corallian Group limestone aquifer along the margins of the vale (Figure 6) show a lower overall salinity (lower concentrations of the dominant ions). Chemistry here is dominated by Ca-HCO3, as expected for a limestone groundwater. A greater proportion of the groundwaters from the Corallian Group limestone aquifer is oxic, as indicated by commonly higher concentrations of NO3, as well as lower concentrations of Fe, Mn, As, NH4 and CH4.
Results for the stream waters (Figure 7) show the dominance of Ca-HCO3, the large range in concentrations of NO3 and relatively large range in NH4. Dissolved CH4 was not analysed in the stream waters but is expected to be low.
A map of CH4 distributions in the Vale of Pickering samples is given in Figure 8. This shows some high concentrations in the superficial and Corallian Group limestone aquifers, in the central part of the vale. There is no evidence that this distribution relates to modern infrastructure (gas mains; boreholes). Concentrations of dissolved CH4 are low in groundwater from the Corallian Limestone aquifer on the periphery of the vale.
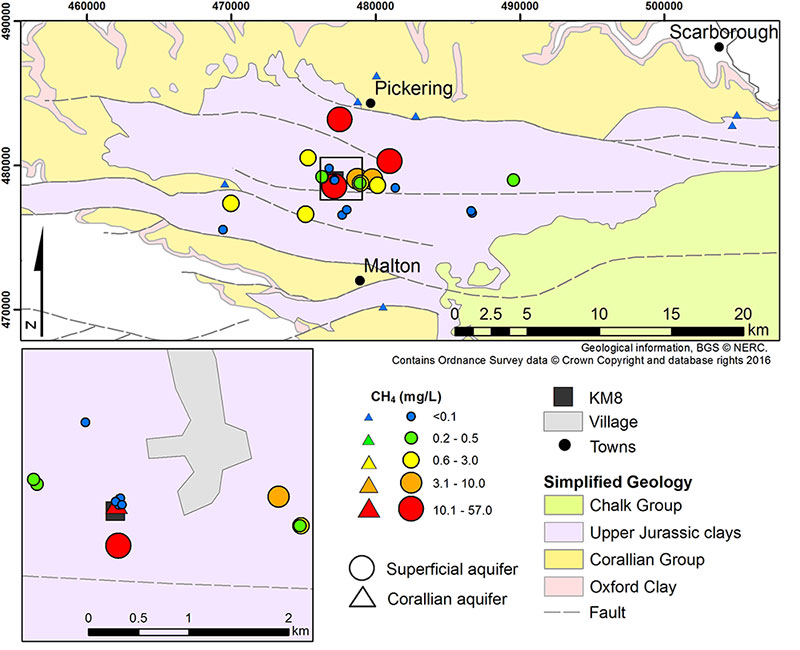
Figure 8 Map of methane (CH4) concentrations in groundwater in the Vale of Pickering (sampled July 2016). BGS © UKRI.
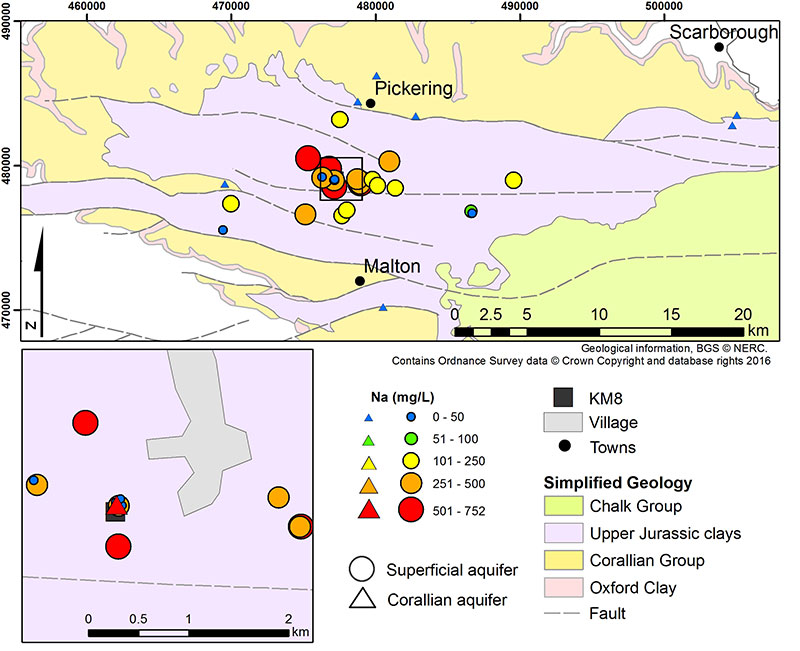
Figure 9 Map of sodium (Na) concentrations in groundwater in the Vale of Pickering (sampled July 2016). BGS © UKRI.
A map of sodium (Na) distributions in the Vale of Pickering samples is given in Figure 9. This shows the highest concentrations in the superficial aquifer caused by groundwater interactions with clay minerals. Concentrations of dissolved Na are mostly low in groundwater from the Corallian Group limestone aquifer. The exception to this is the high value found in the confined Corallian Group limestone aquifer sampled in the centre of the vale, where the Corallian rocks are deep. Deep groundwaters tend to be old and have been in contact with rocks over long periods of time, giving them high concentrations of dissolved constituents such as Na.
Summary results for detected organic compounds in the groundwater samples (superficial and Corallian Group limestone aquifers together, September 2015) are given in Figure 10a. Data shows detection of a large number of compounds, though usually with few occurrences of each. Detected compounds include pesticides, polycyclic aromatic hydrocarbons, plasticisers and pharmaceuticals, in all cases at concentrations of less than 1 µg/L, but lower by more than an order of magnitude in most cases.
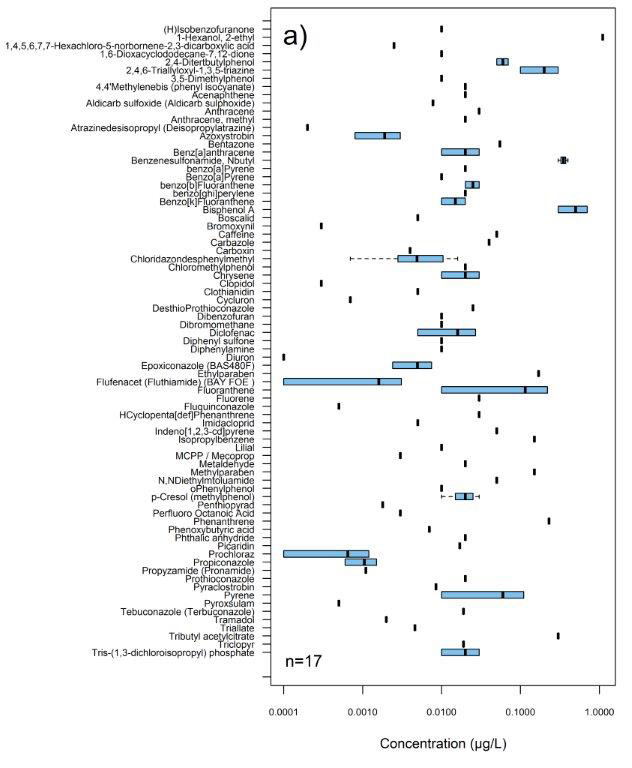
Figure 10a Box plot showing organic compounds detected in groundwater samples (superficial and Corallian Group limestone aquifers) from the Vale of Pickering (September 2015 sampling). BGS © UKRI.
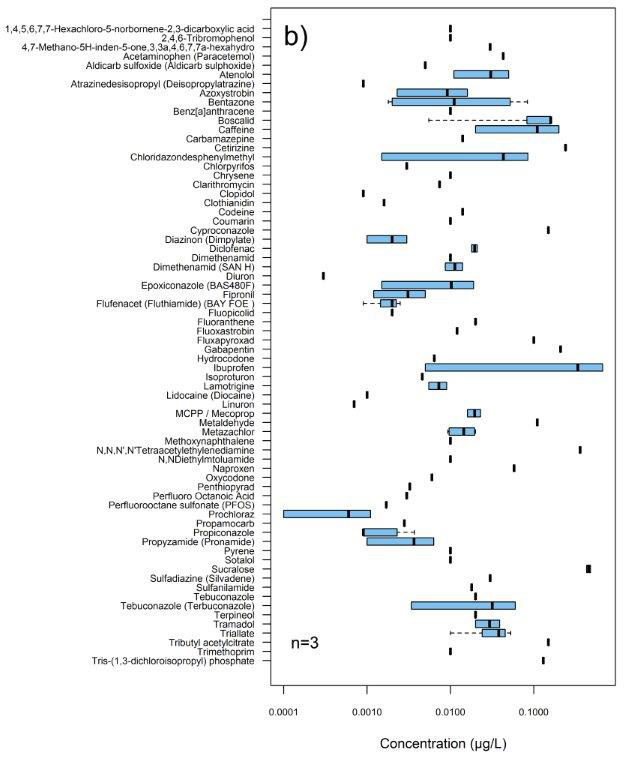
Figure 10b Box plot showing organic compounds detected in stream-water samples (n=3) from the Vale of Pickering (September 2015 sampling). BGS © UKRI.
Summary results for detected compounds in stream-water samples (Figure 6b) show the presence of a smaller number of compounds, albeit with more frequent occurrences (note: only three samples were analysed). Compounds include pesticides, pharmaceuticals and polycyclic aromatic hydrocarbons, though these are in many cases different from those detected in the groundwaters. Again, concentrations of all are less than or much less than 1 μg/L.
Water monitoring
Monitoring data for the groundwater (superficial deposits and Corallian Group limestone) and stream sites for selected analytes are shown in figures 11, 12 and 13. These show the temporal variability in concentrations over the period of monitoring (from September 2015).
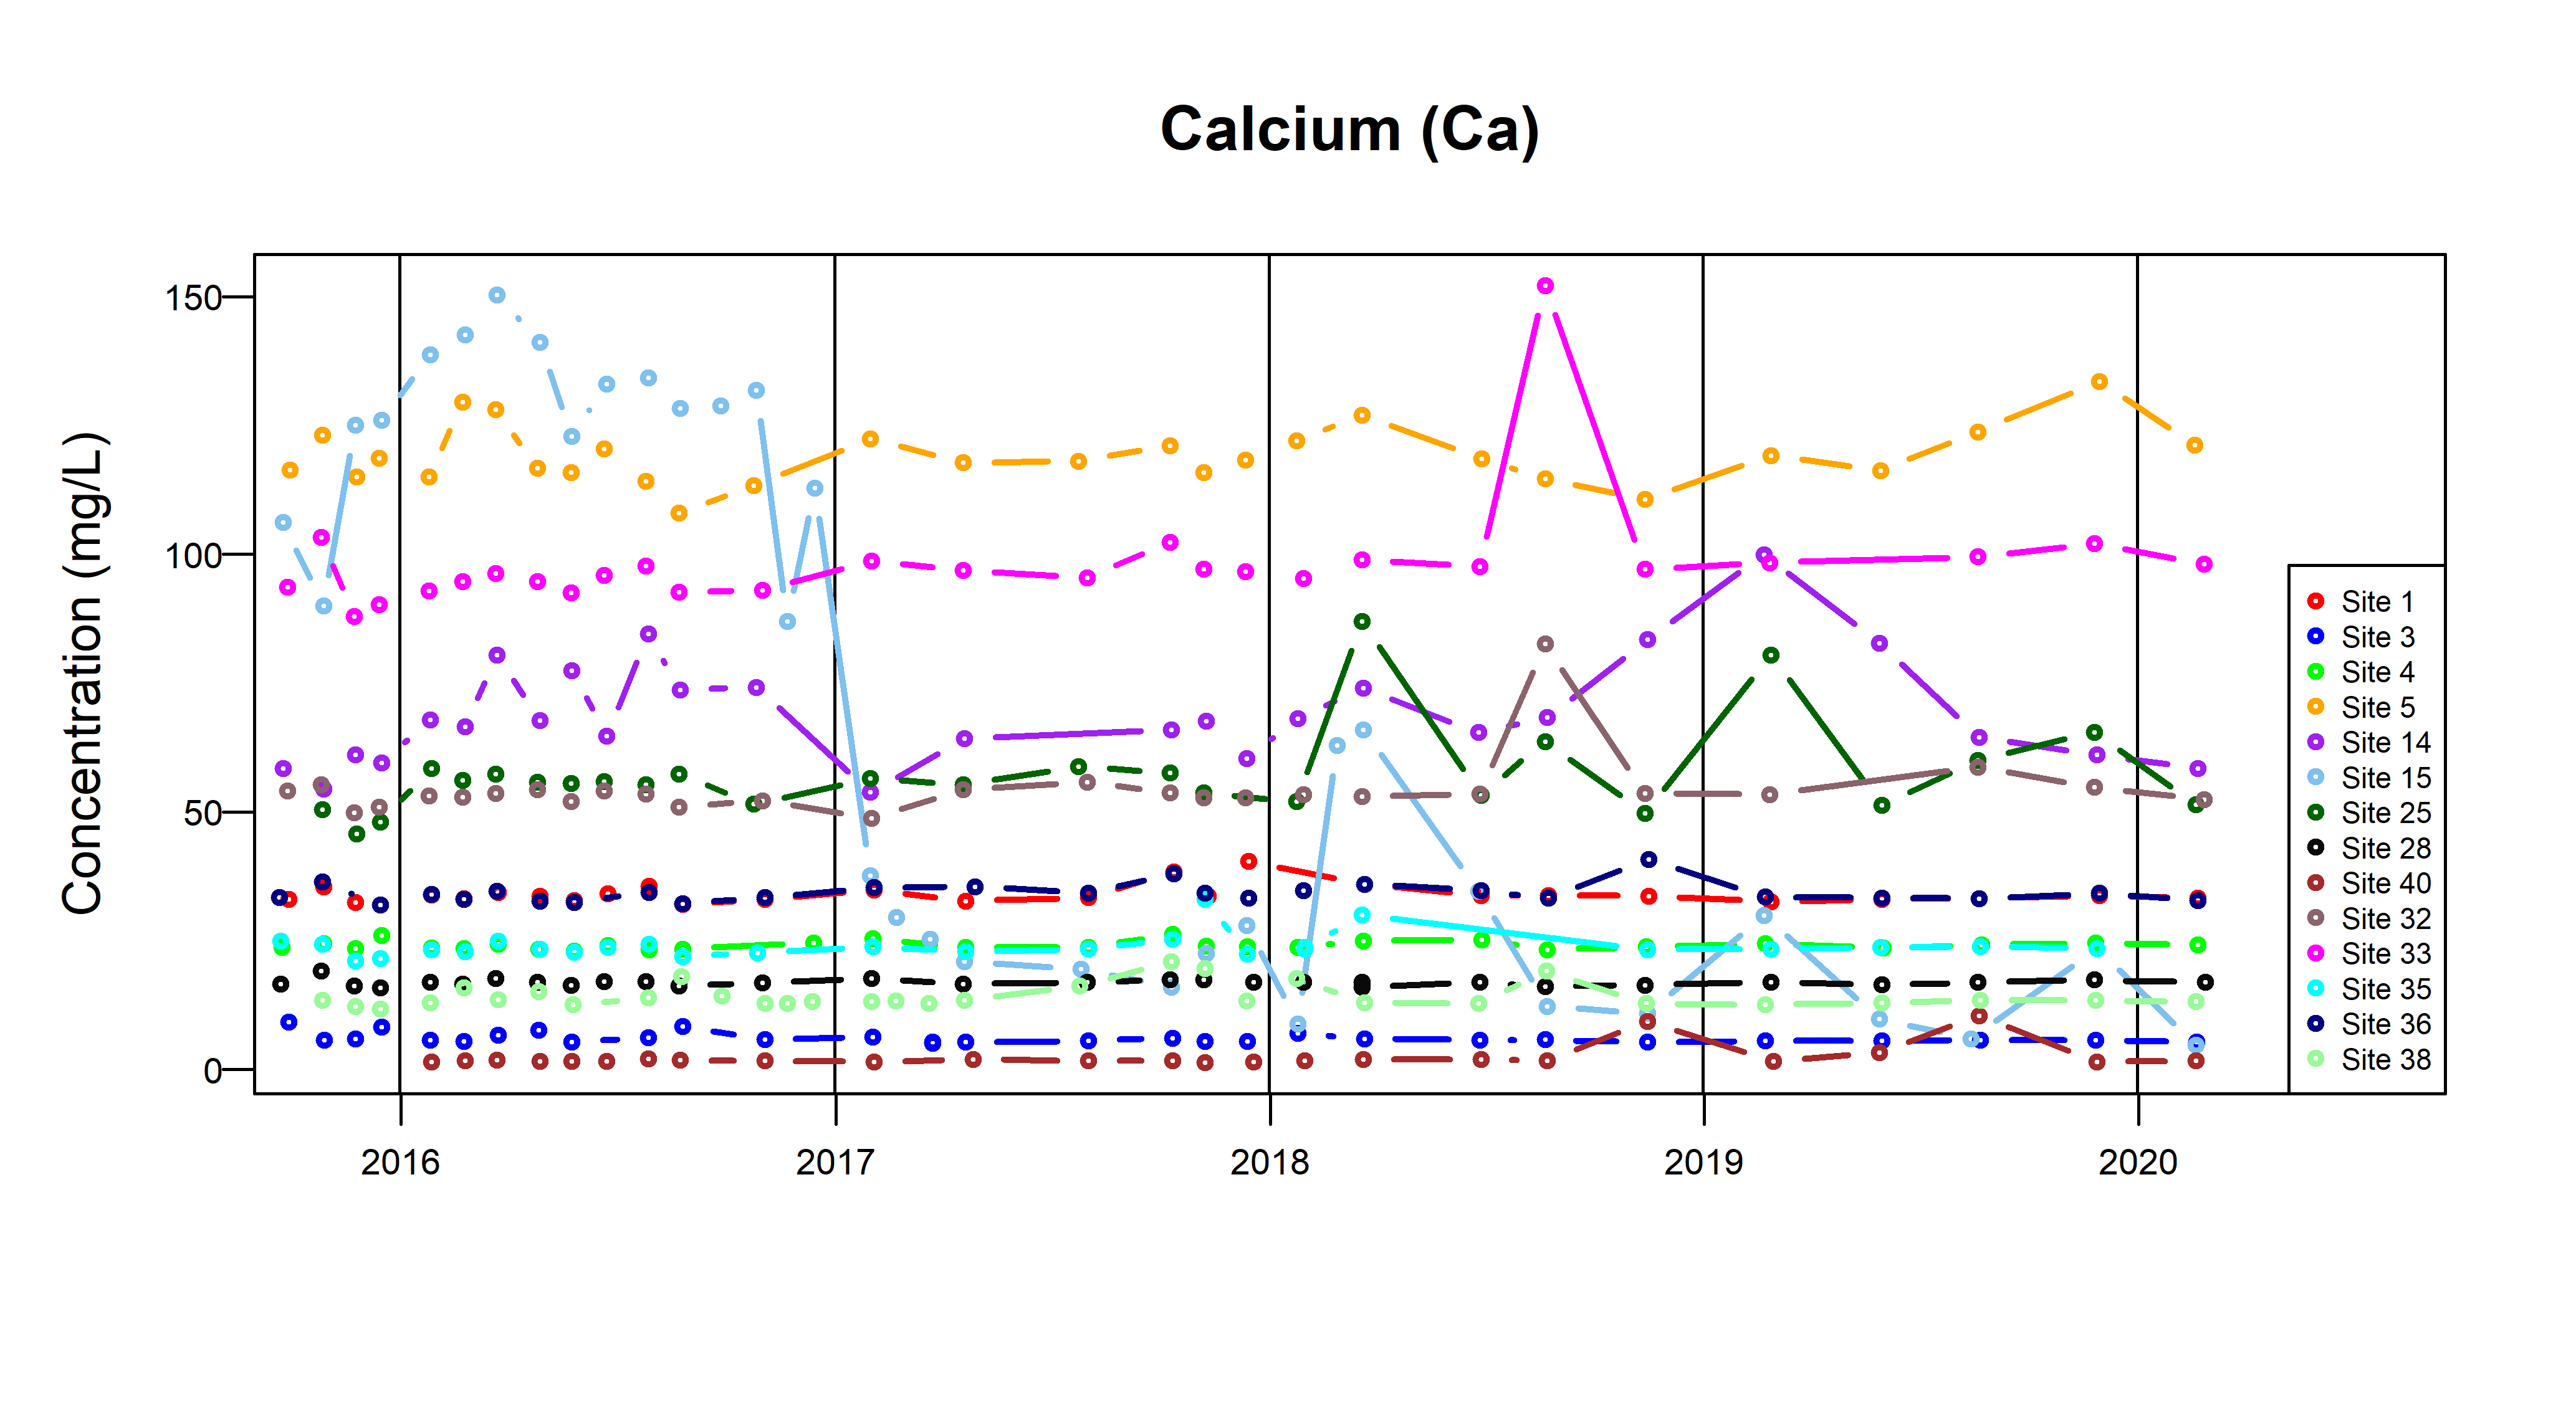
Figure 11a Time-series plots for calcium measured from groundwater in the superficial aquifer (from September 2015). BGS © UKRI.
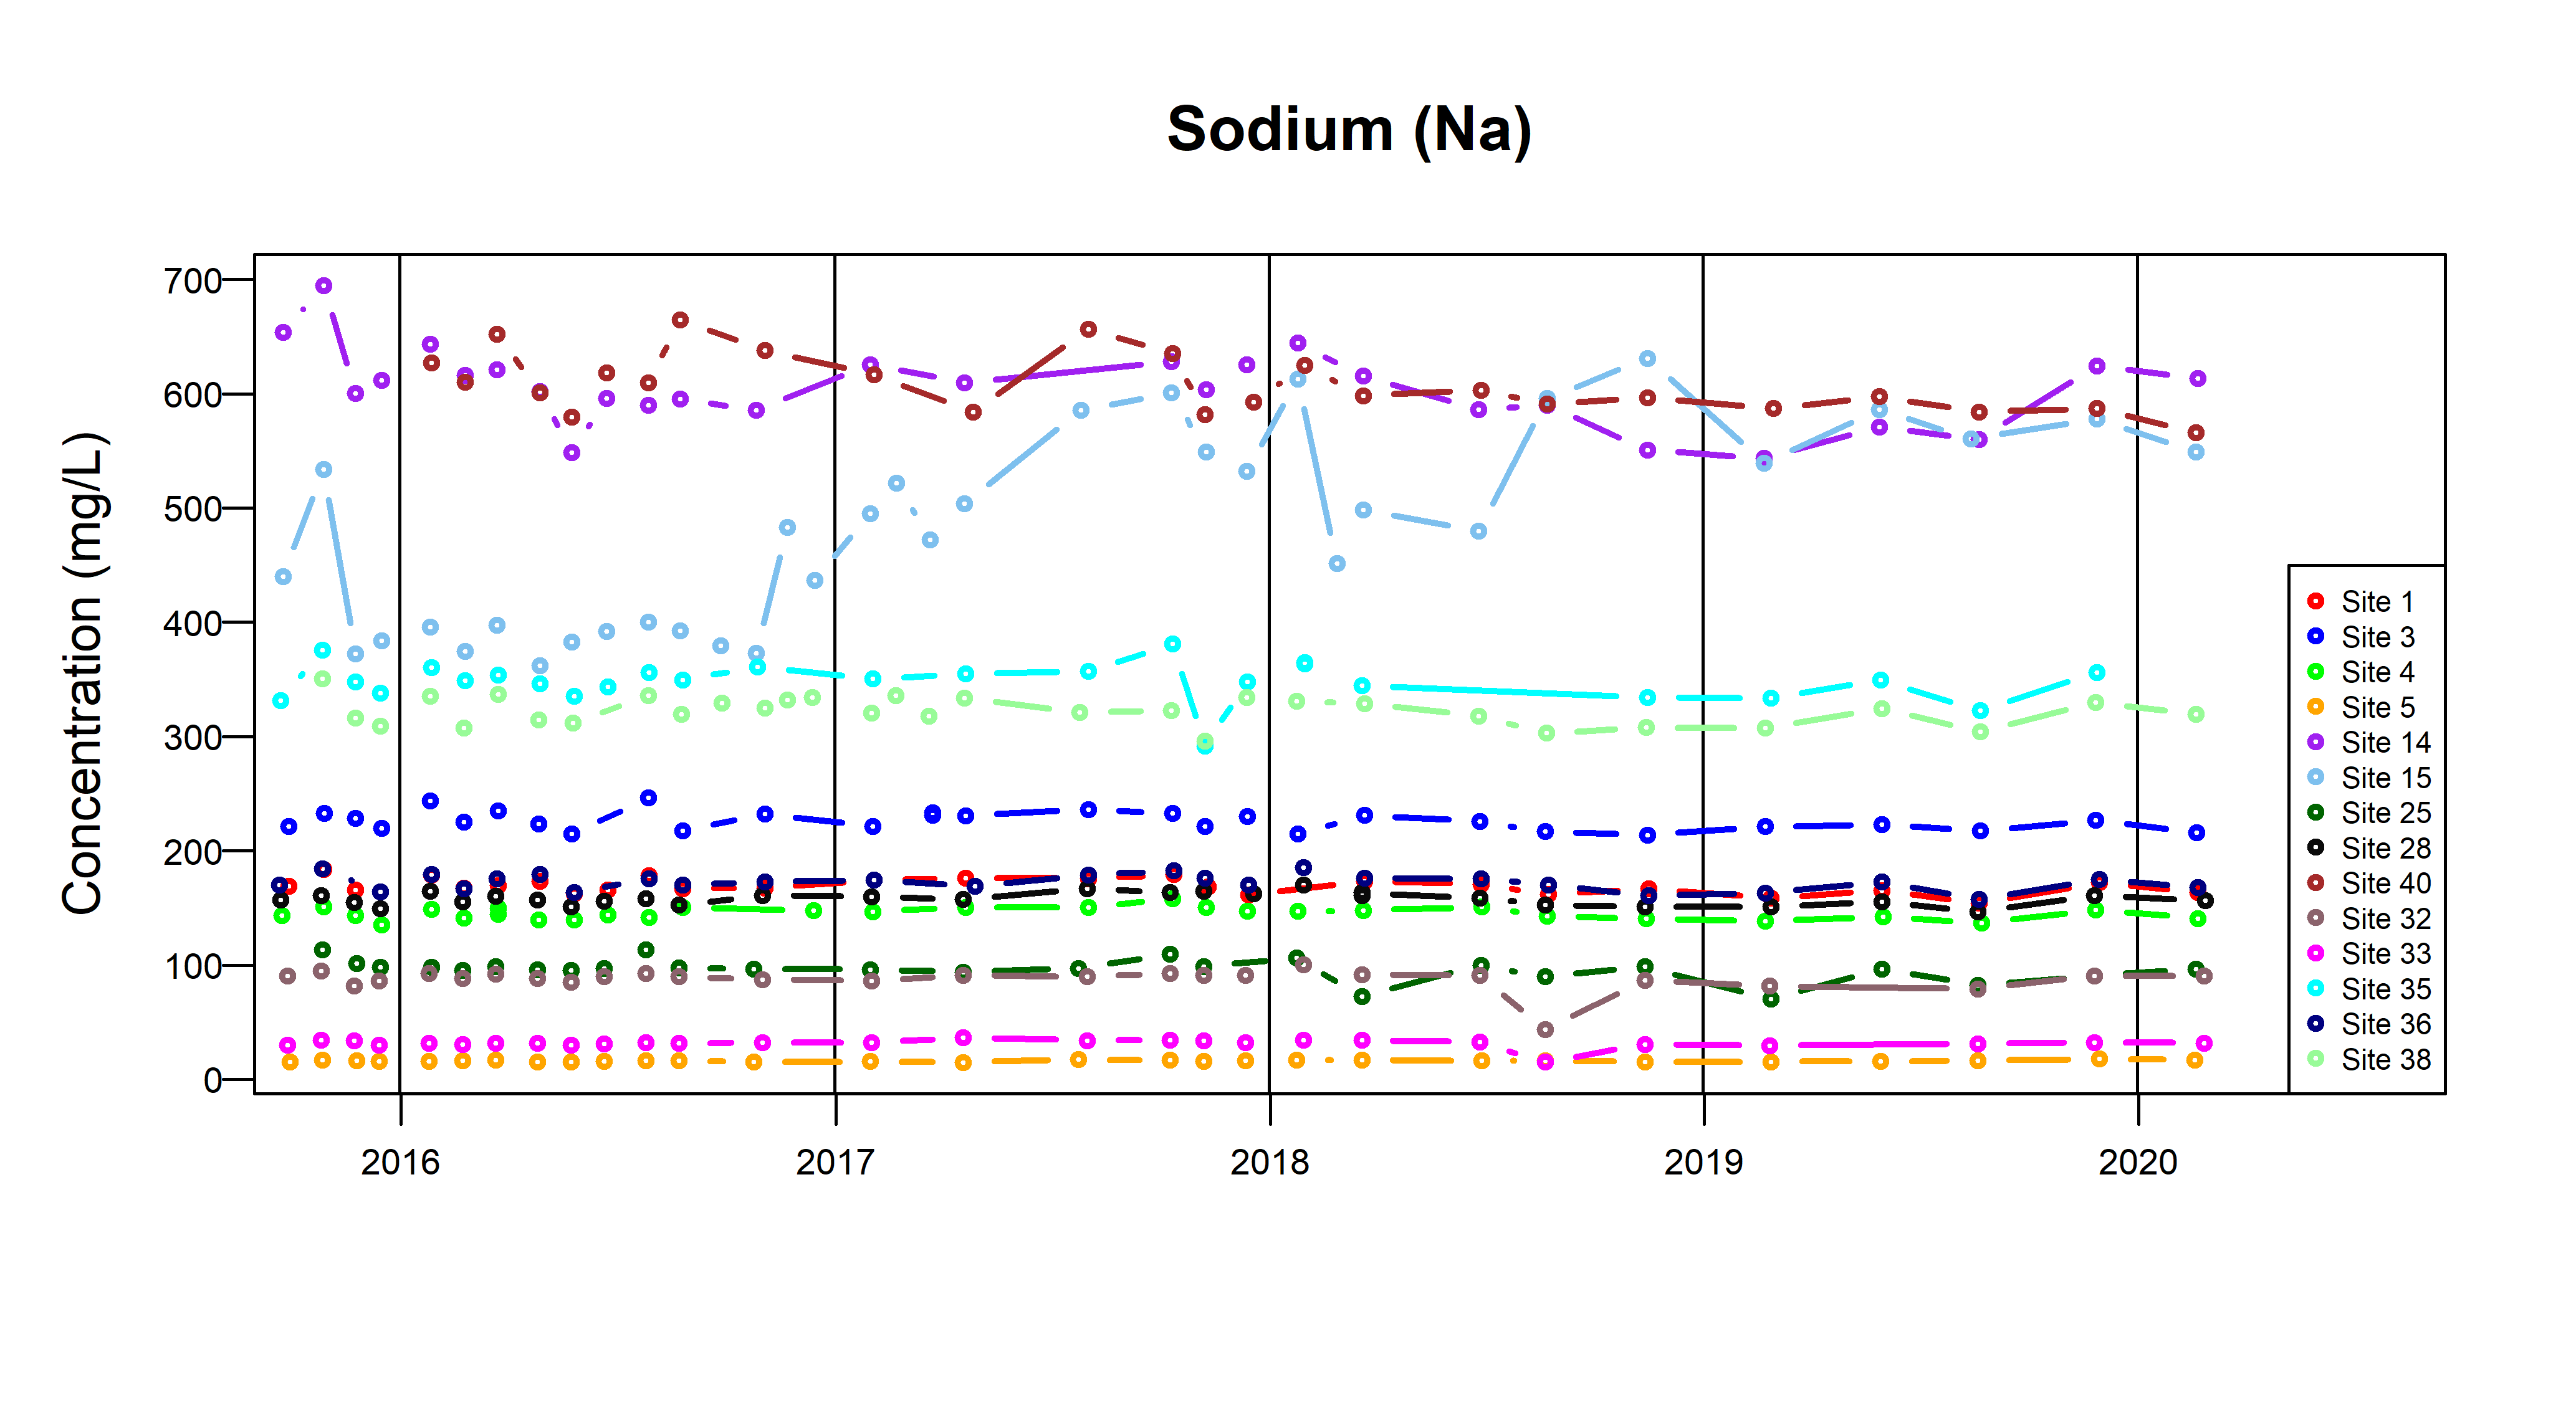
Figure 11b Time-series plots for sodium measured from groundwater in the superficial aquifer (from September 2015). BGS © UKRI.
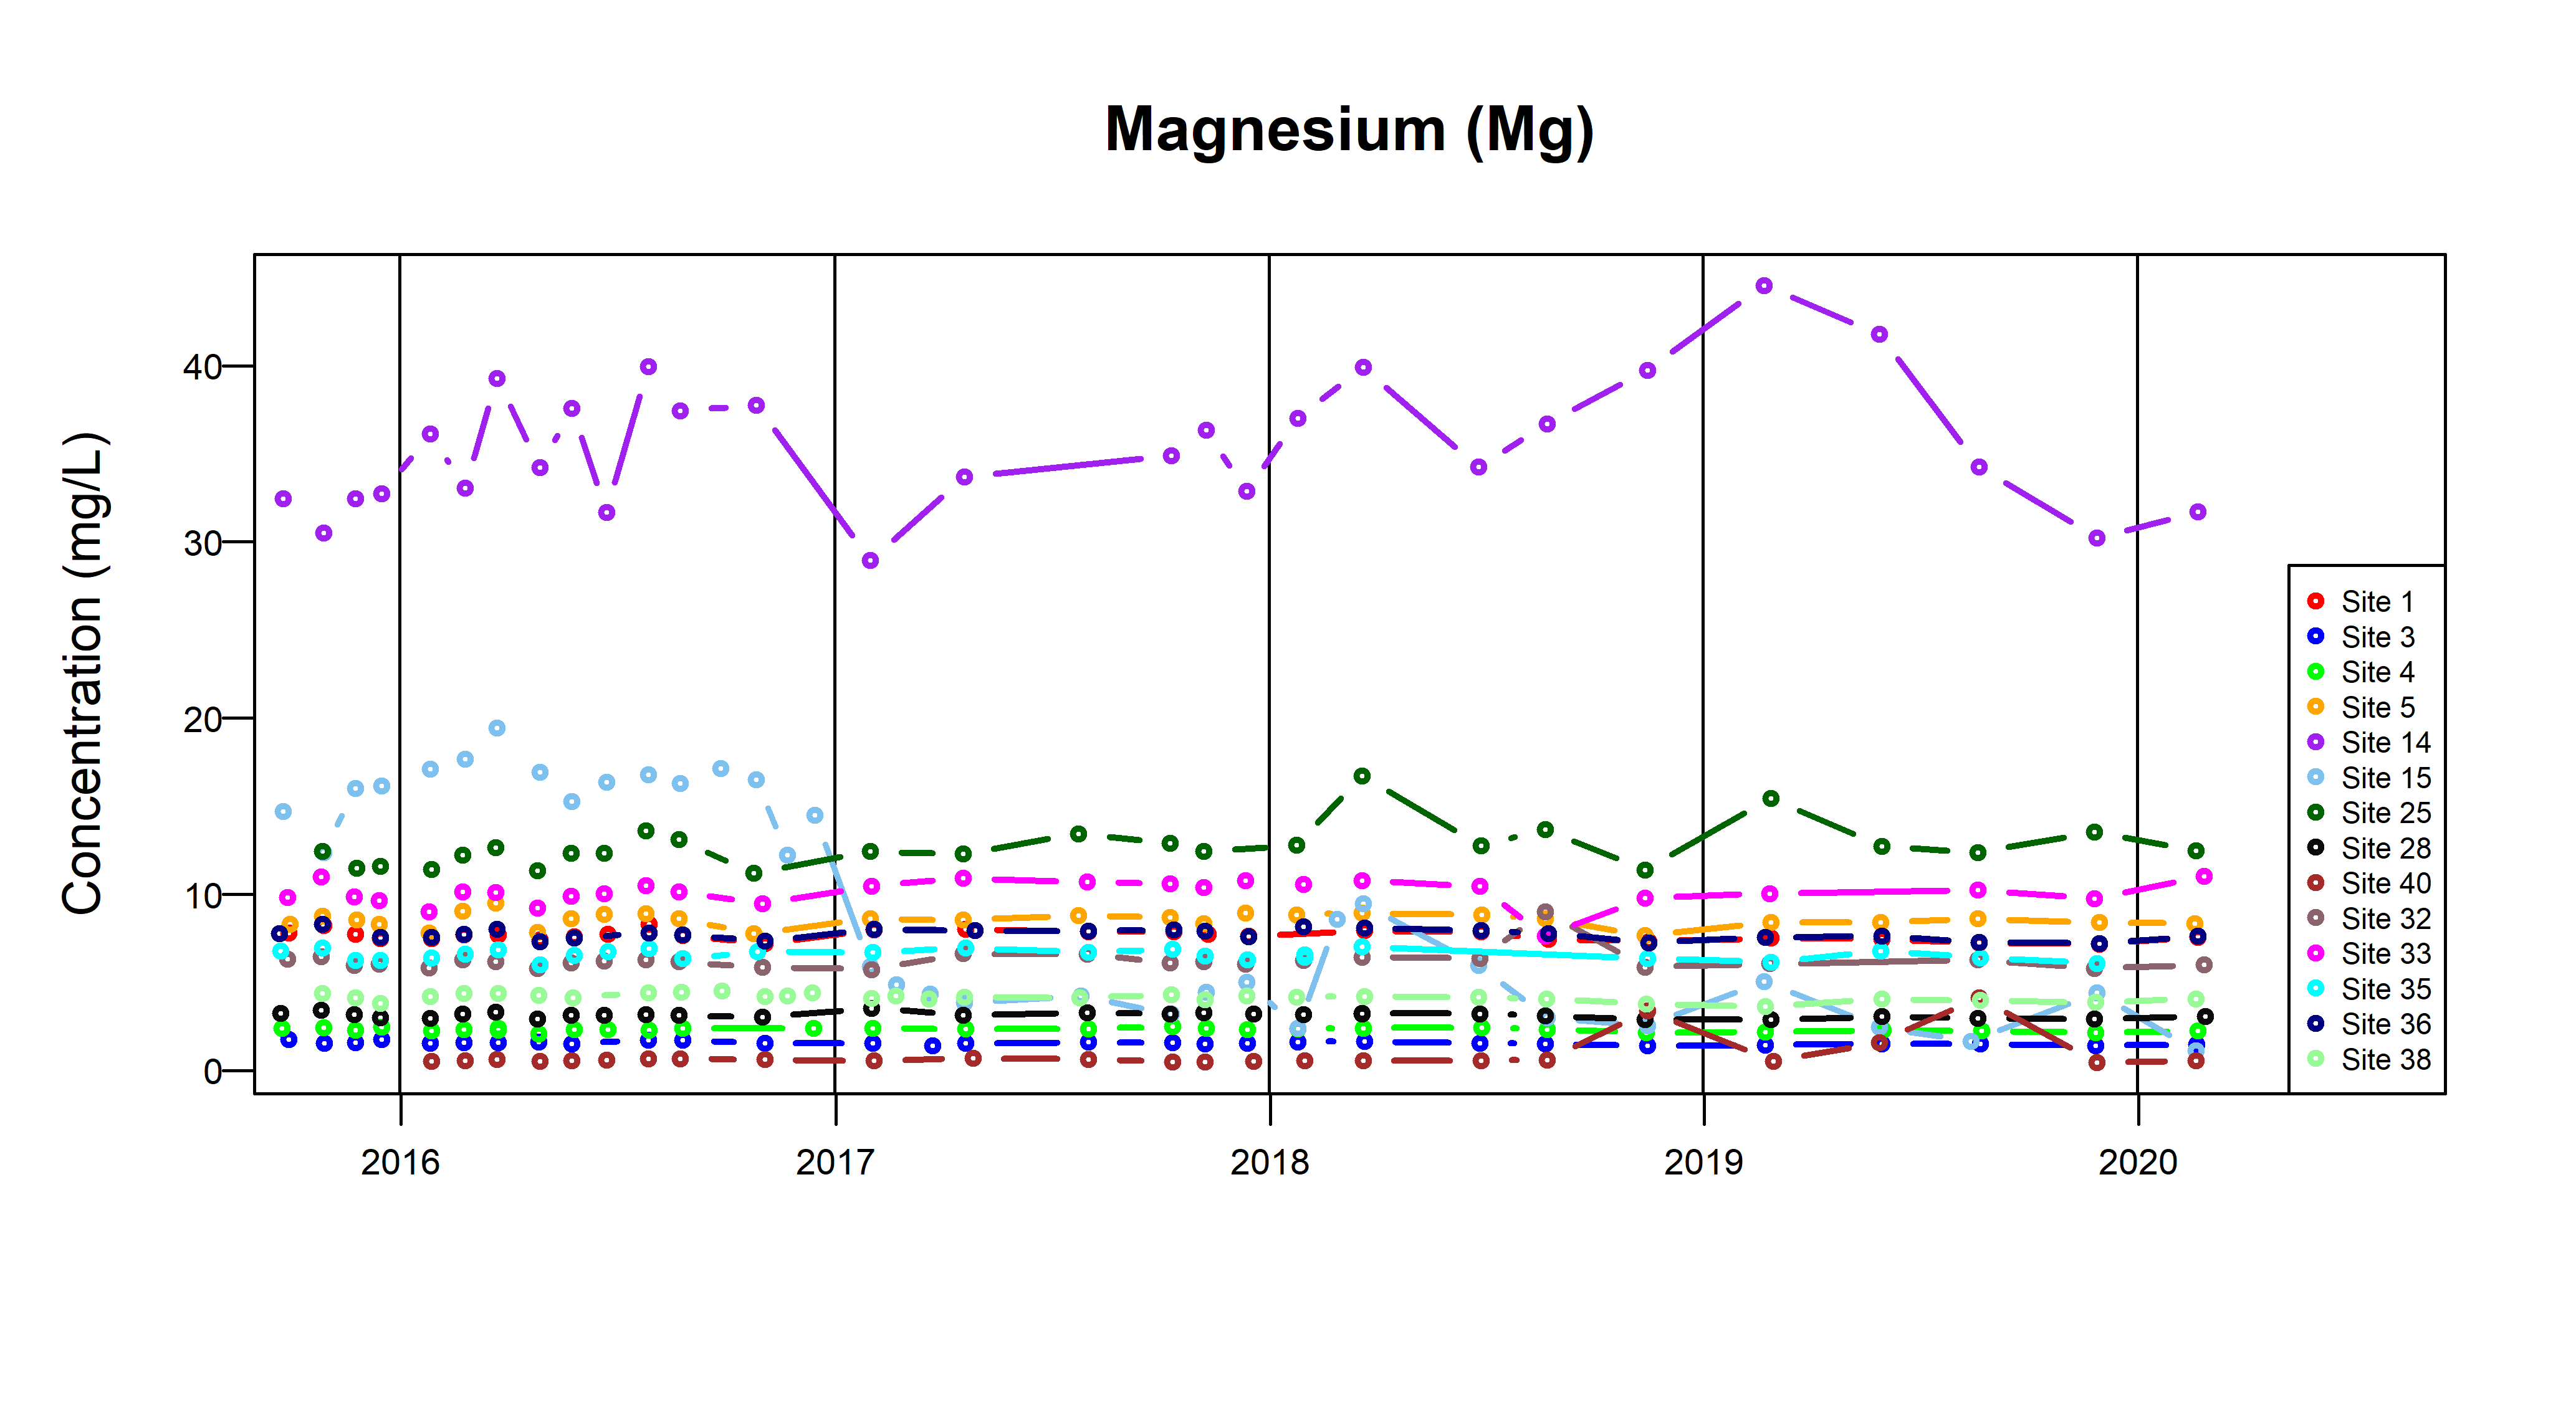
Figure 11c Time-series plots for magnesium measured from groundwater in the superficial aquifer (from September 2015). BGS © UKRI.
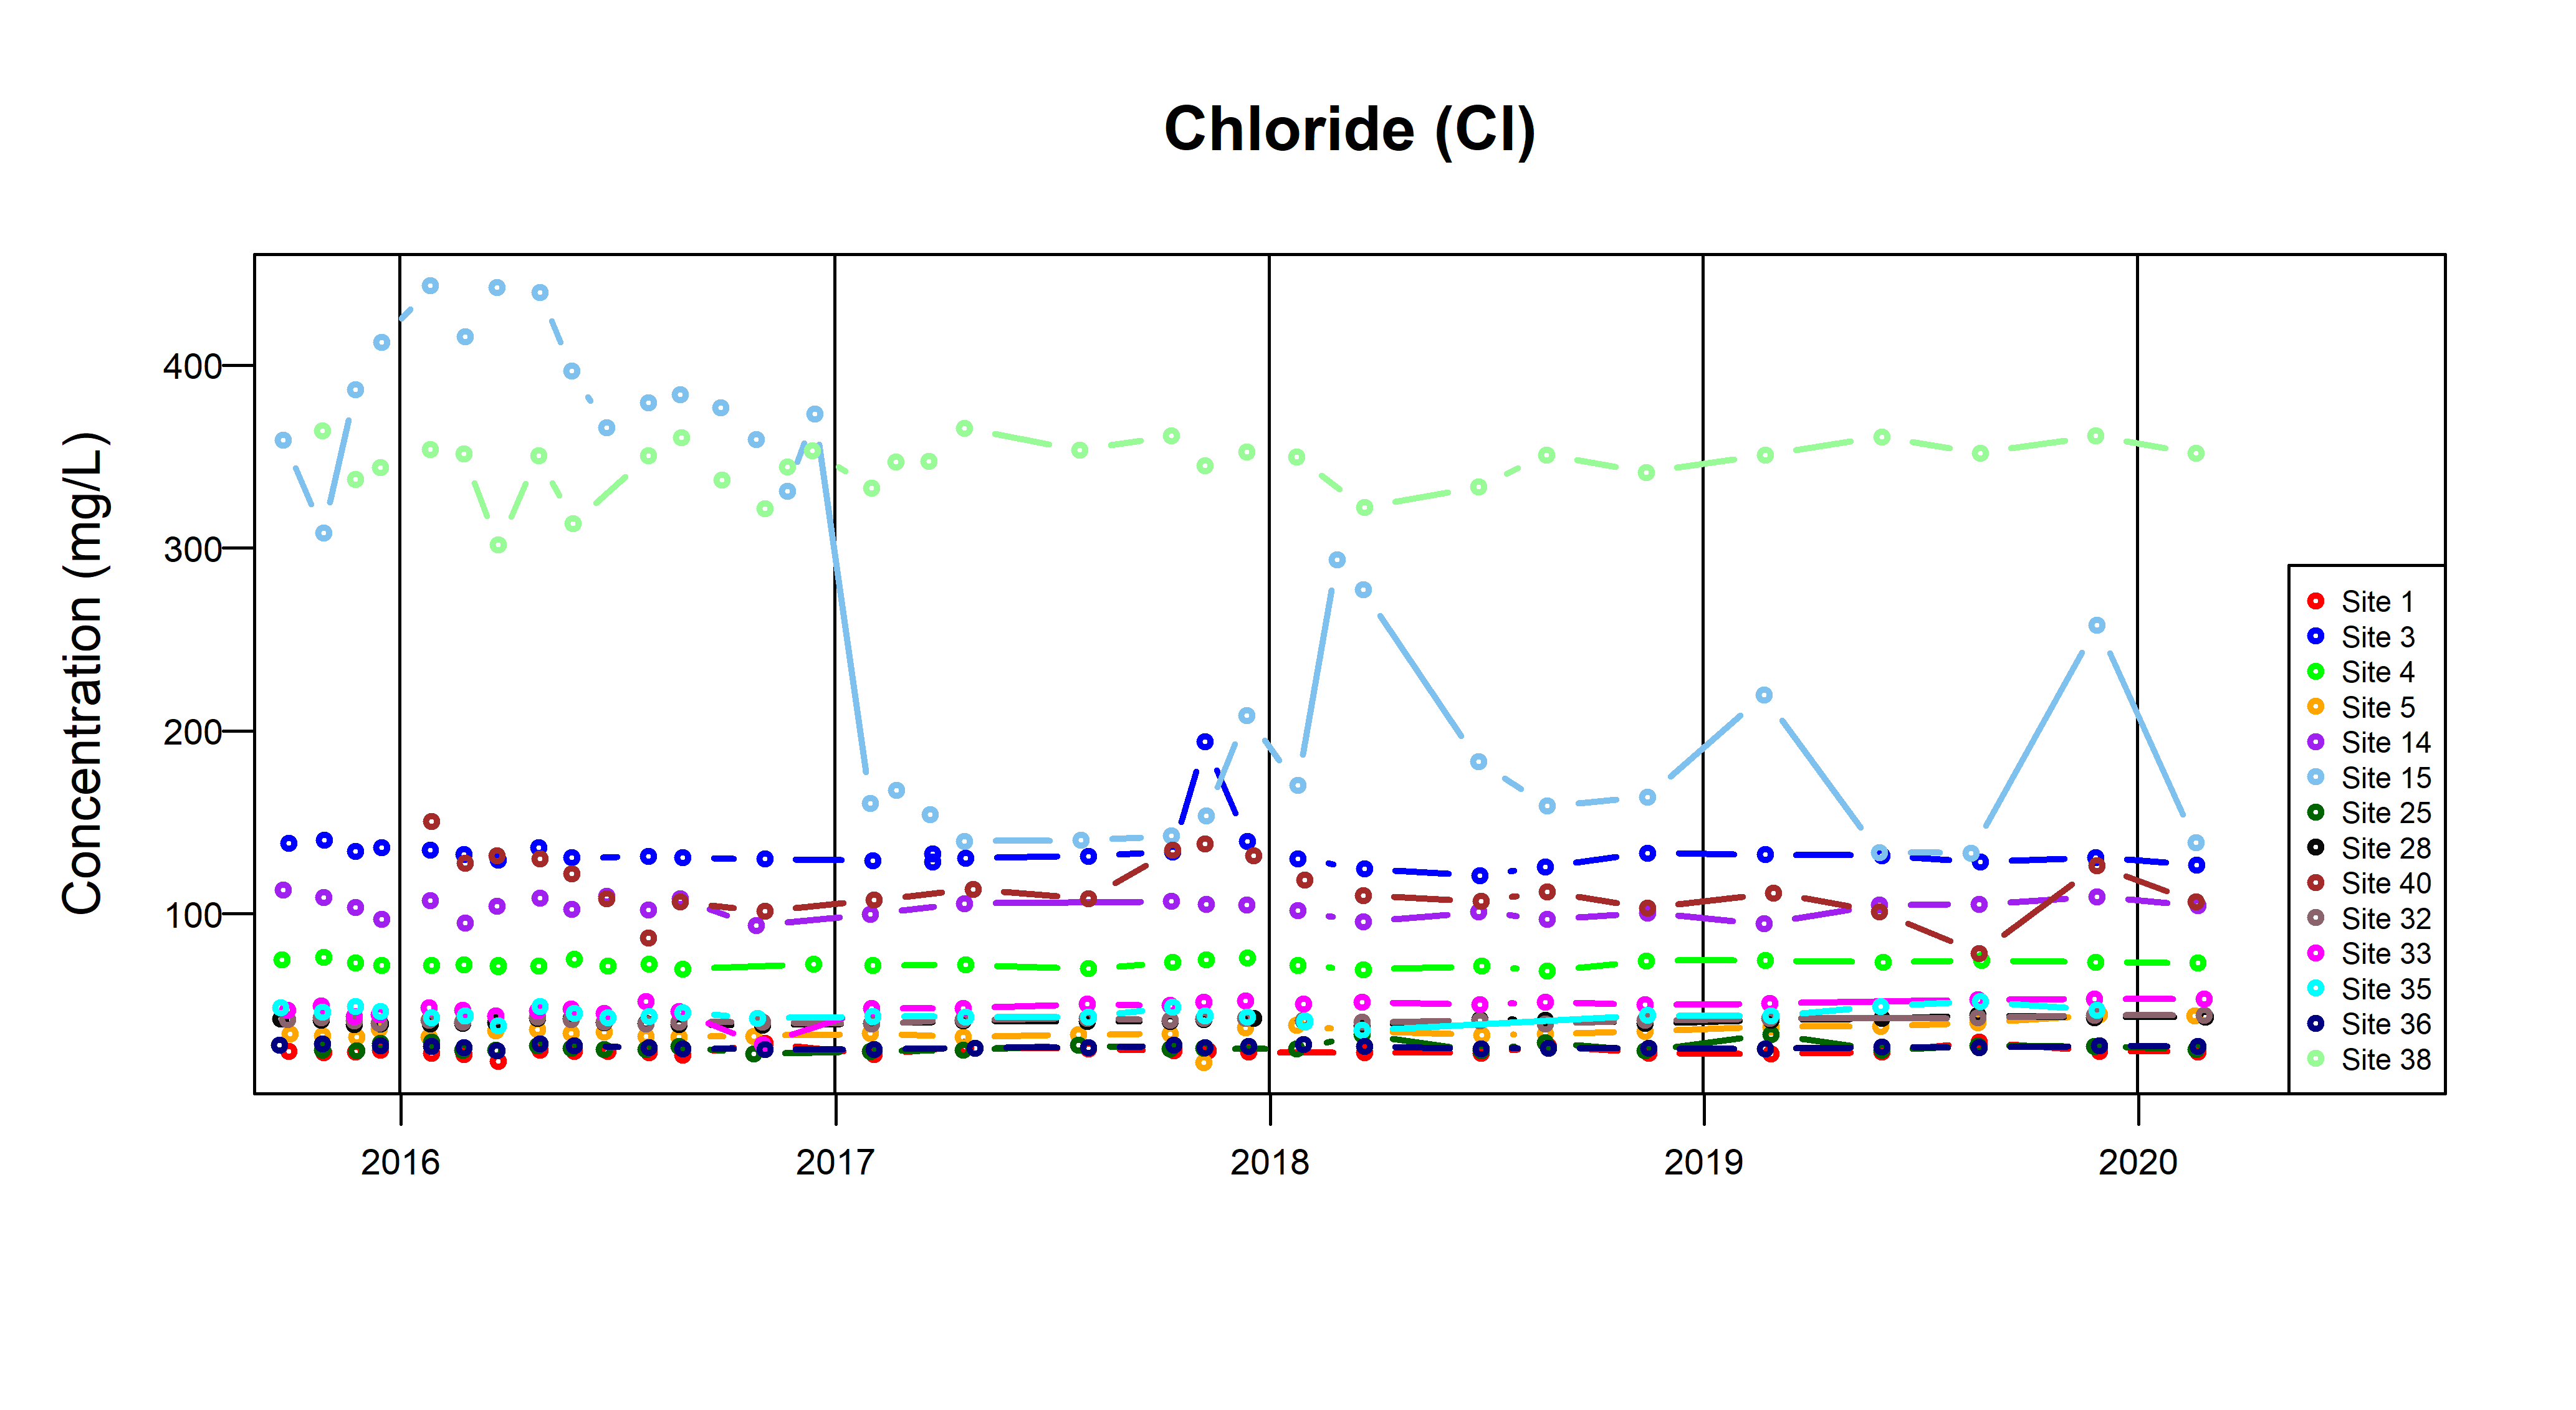
Figure 11d Time-series plots for chloride measured from groundwater in the superficial aquifer (from September 2015). BGS © UKRI.
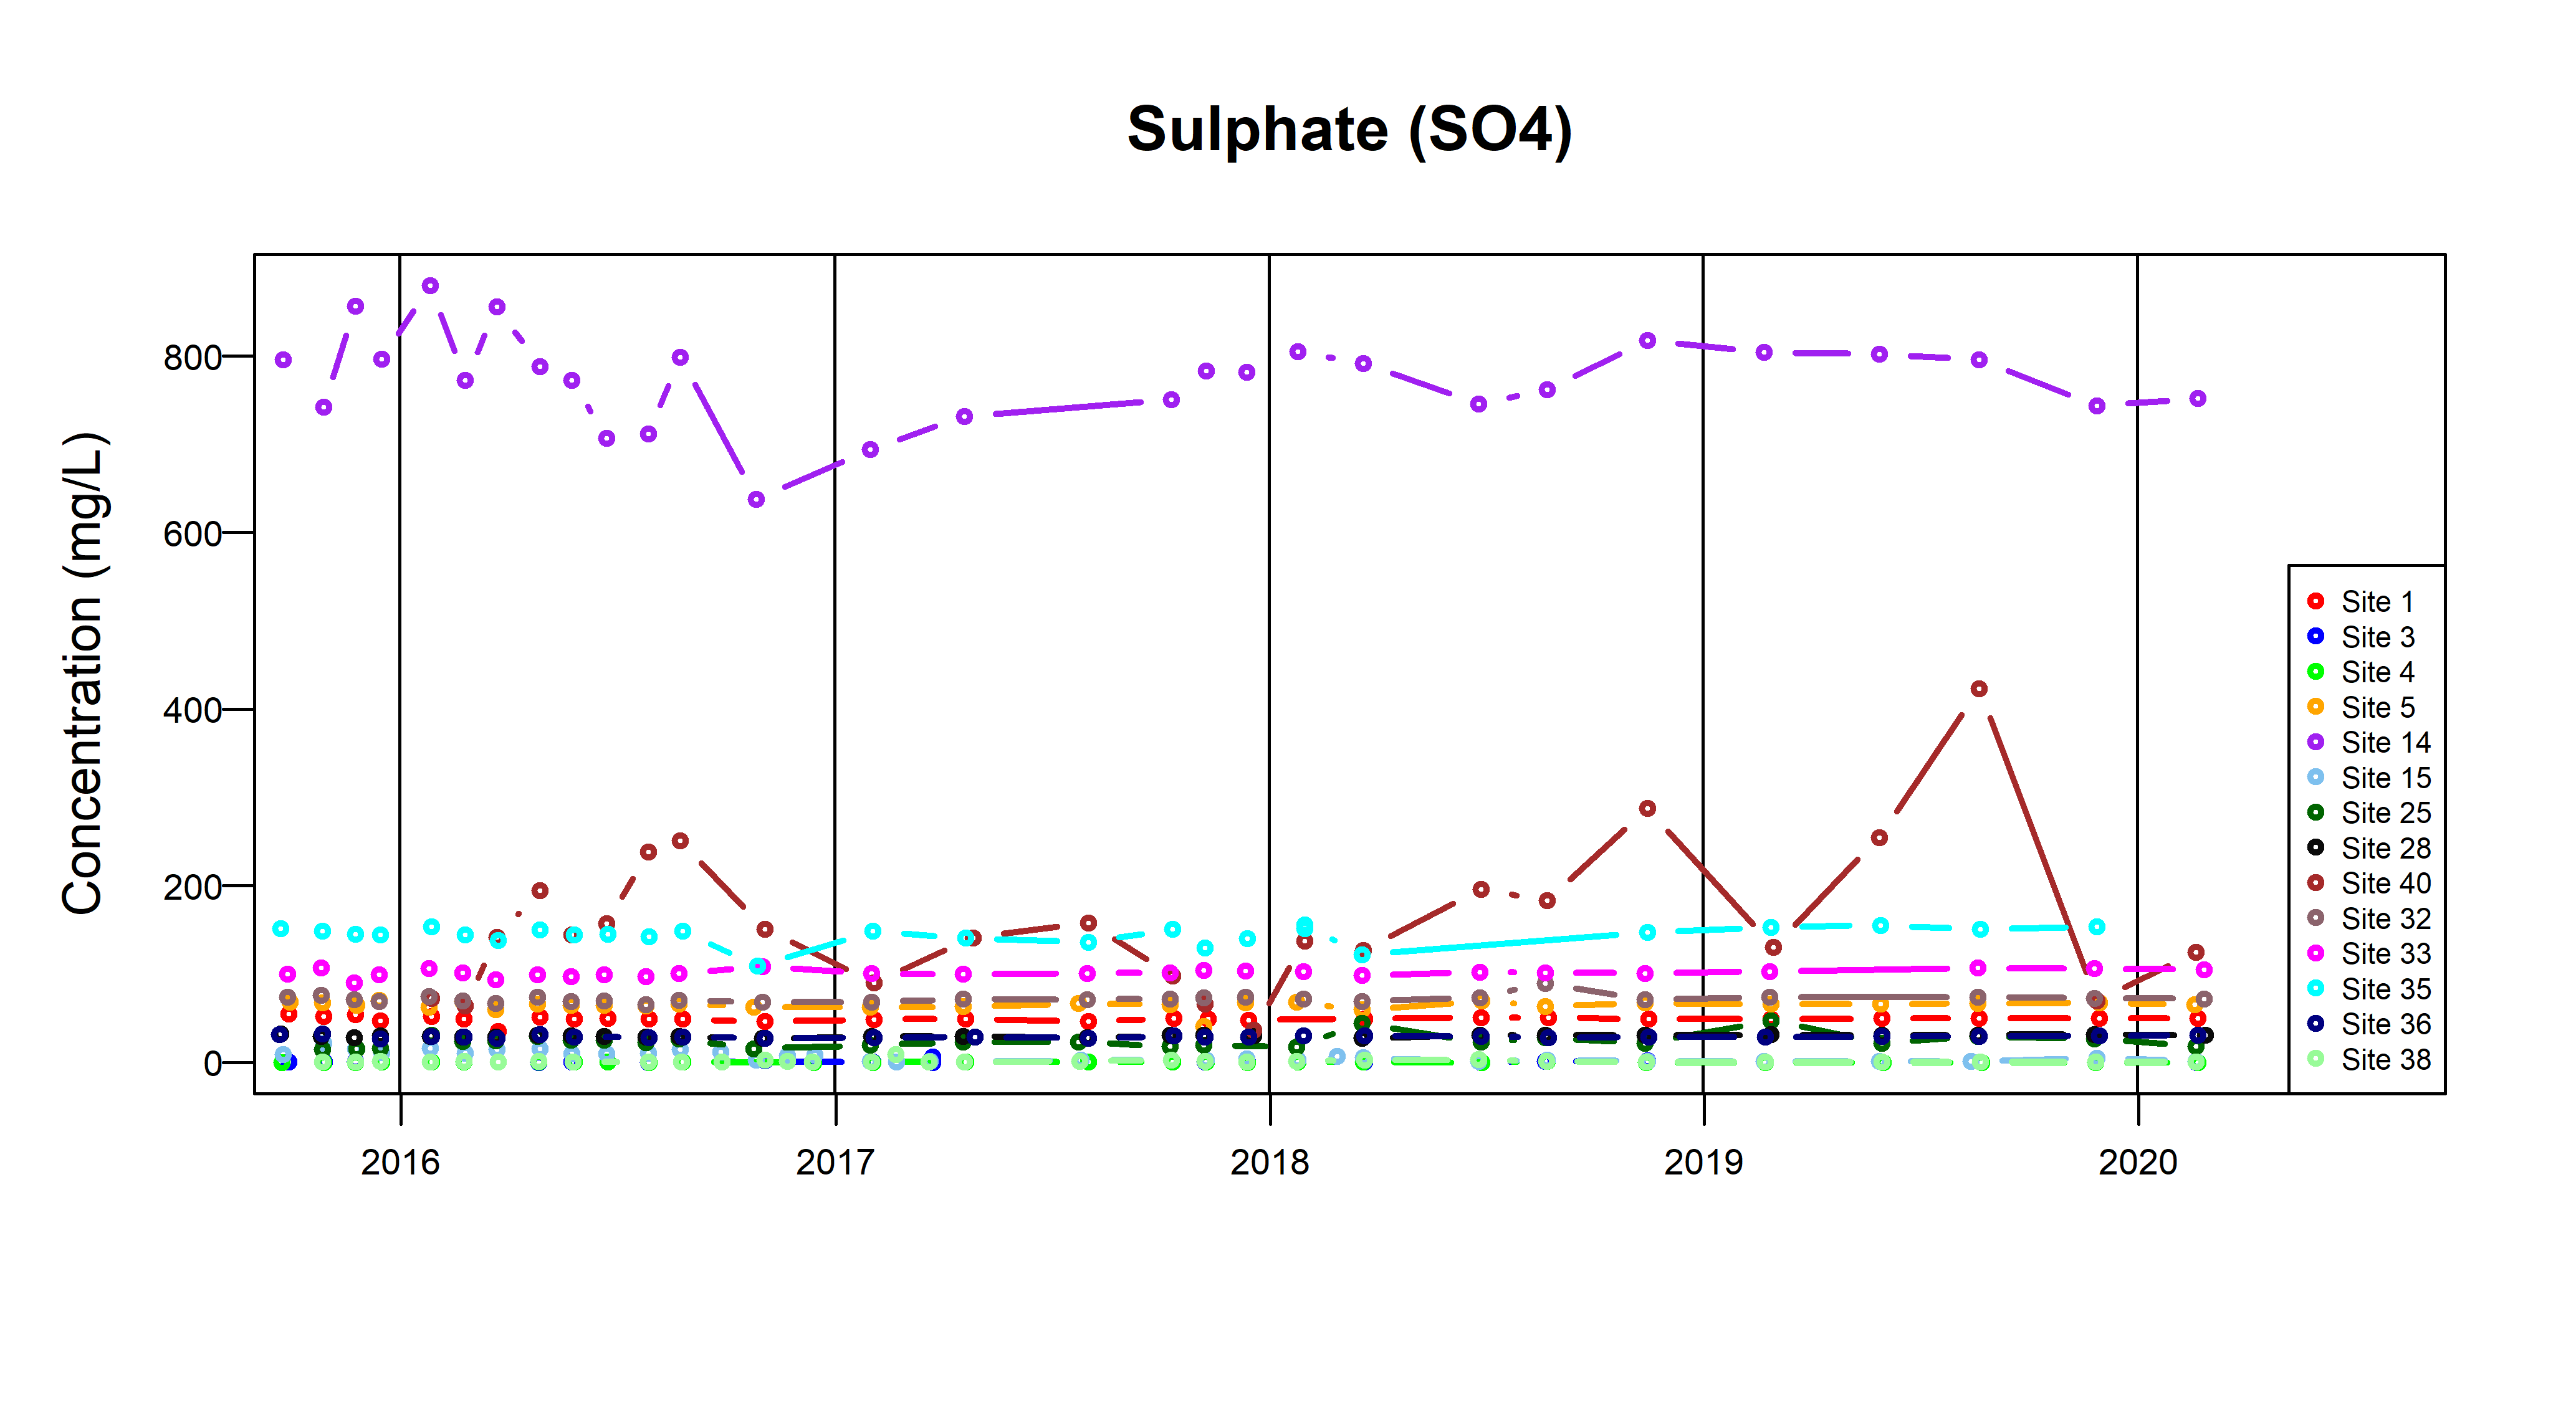
Figure 11e Time-series plots for sulfate measured from groundwater in the superficial aquifer (from September 2015). BGS © UKRI.
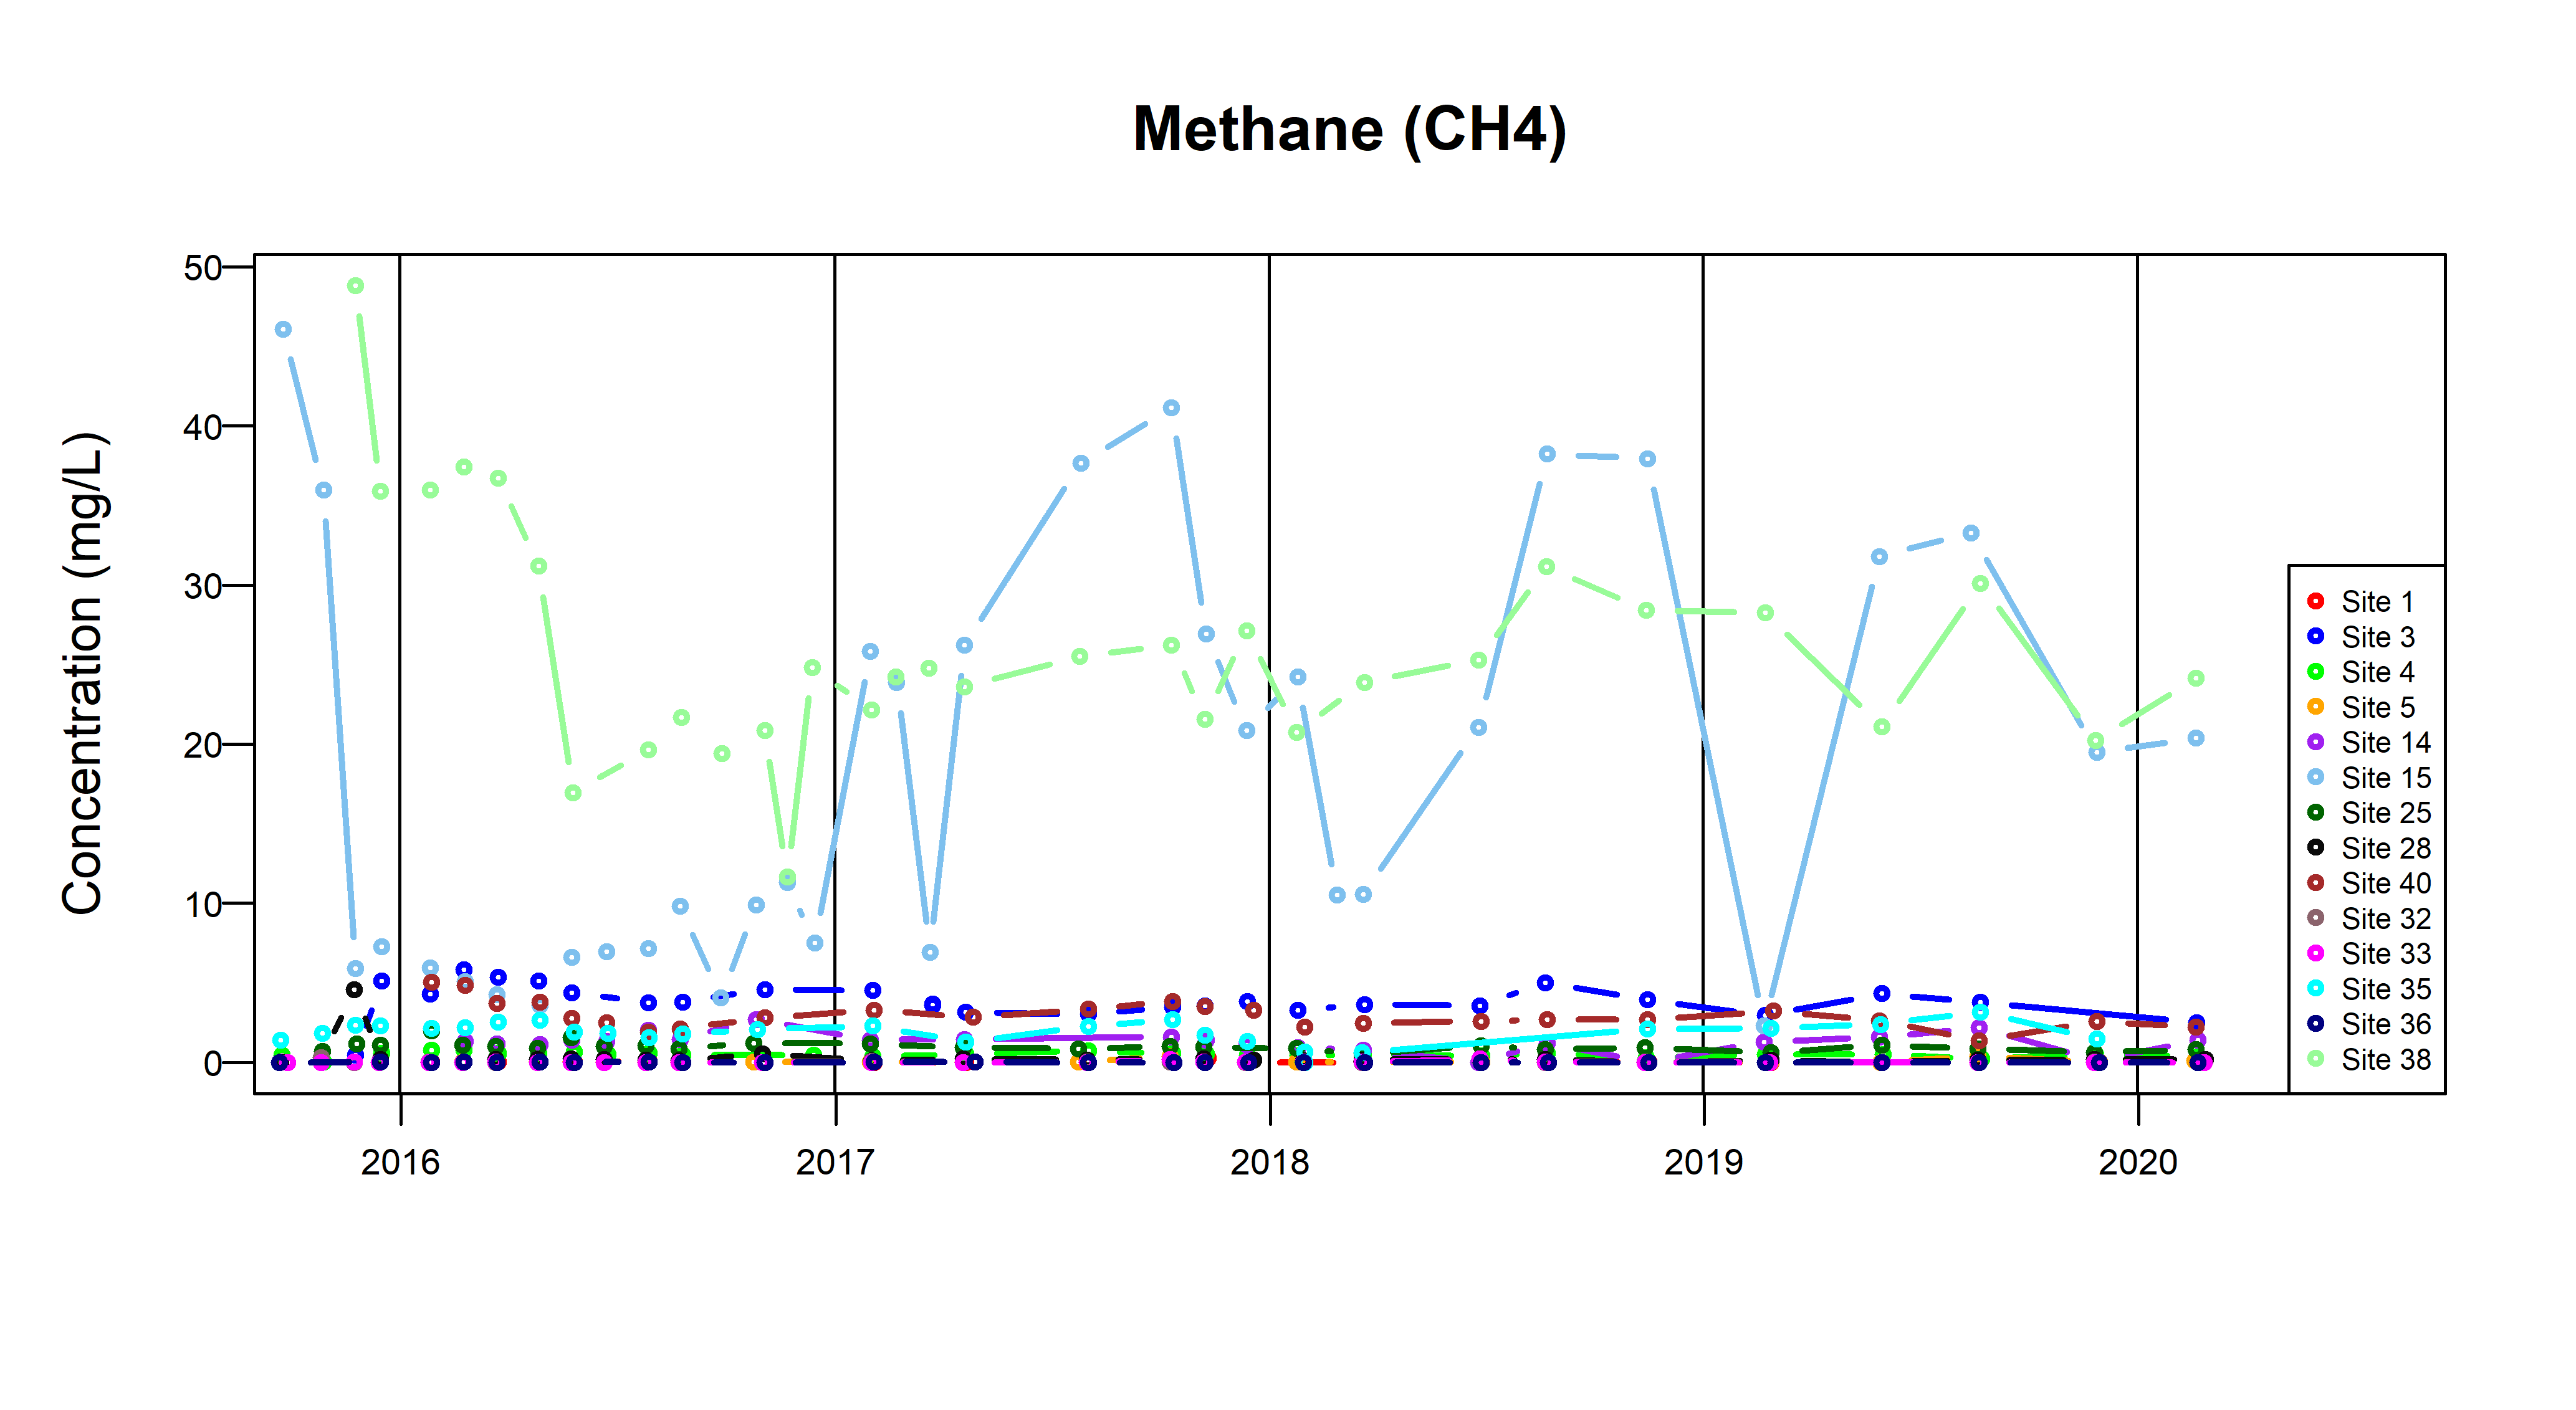
Figure 11f Time-series plots for methane measured from groundwater in the superficial aquifer (from September 2015). BGS © UKRI.
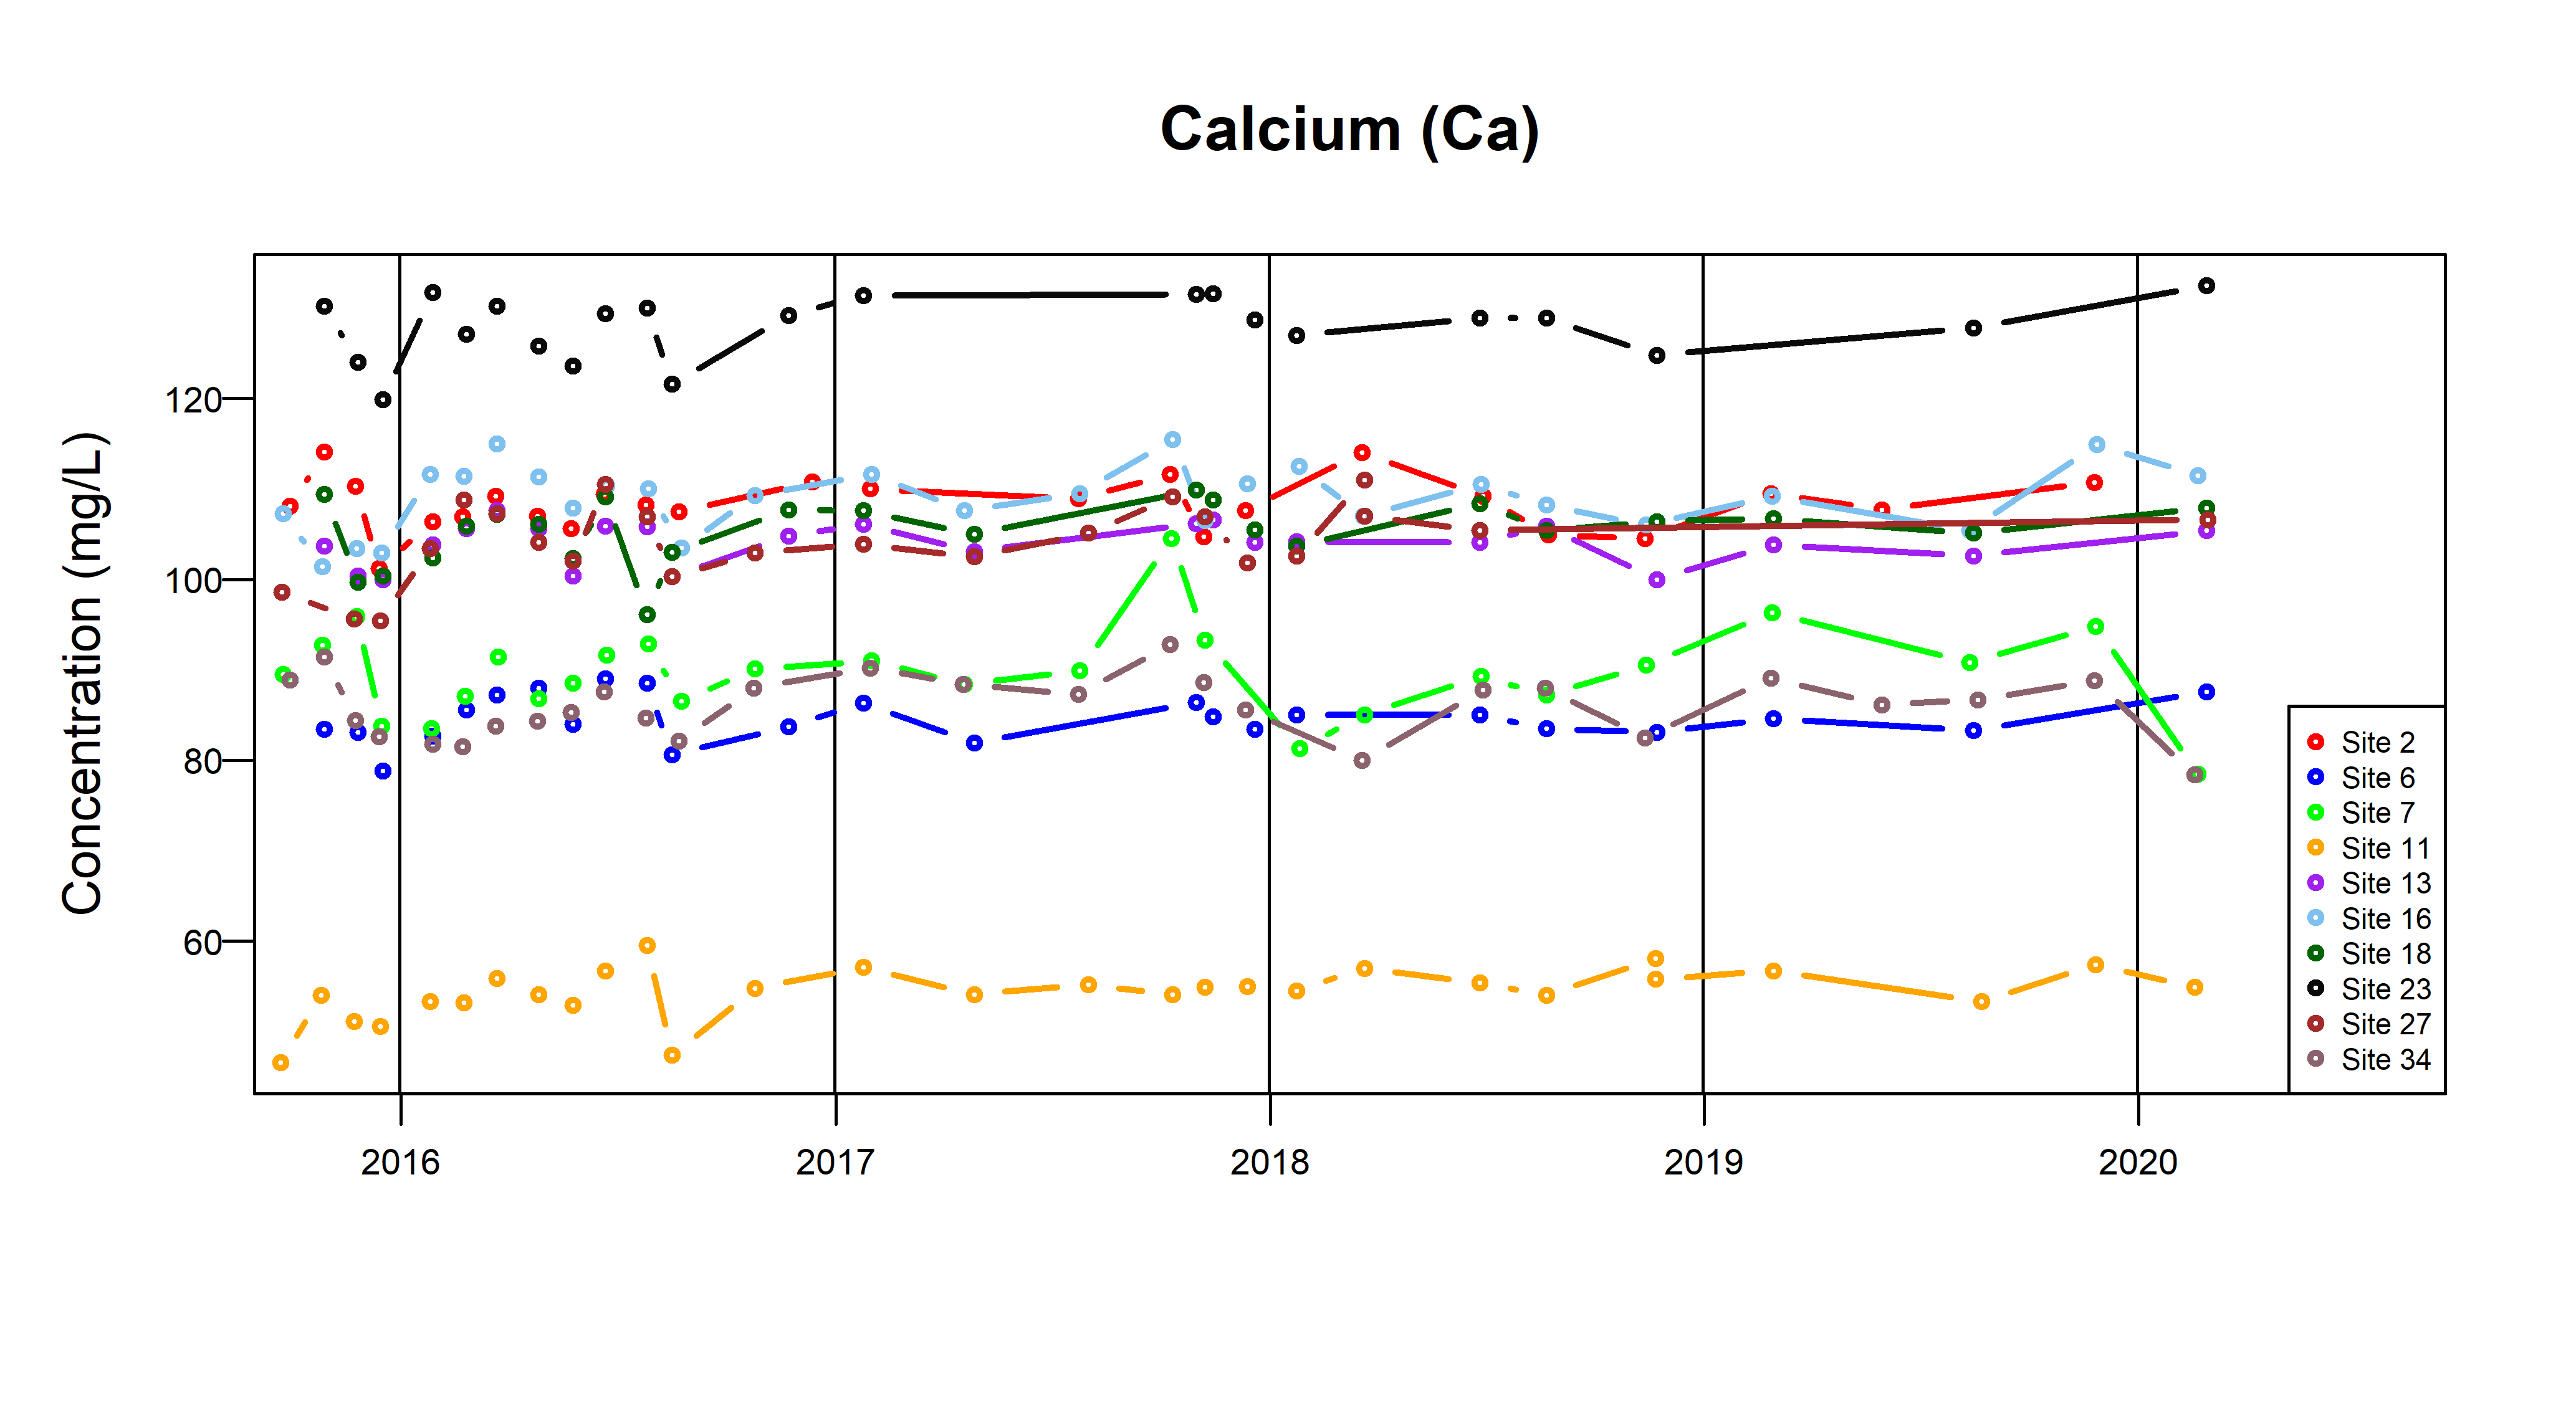
Figure 12a Time-series plots for calcium measured from groundwater in the Corallian Group limestone aquifer (from September 2015). BGS © UKRI.
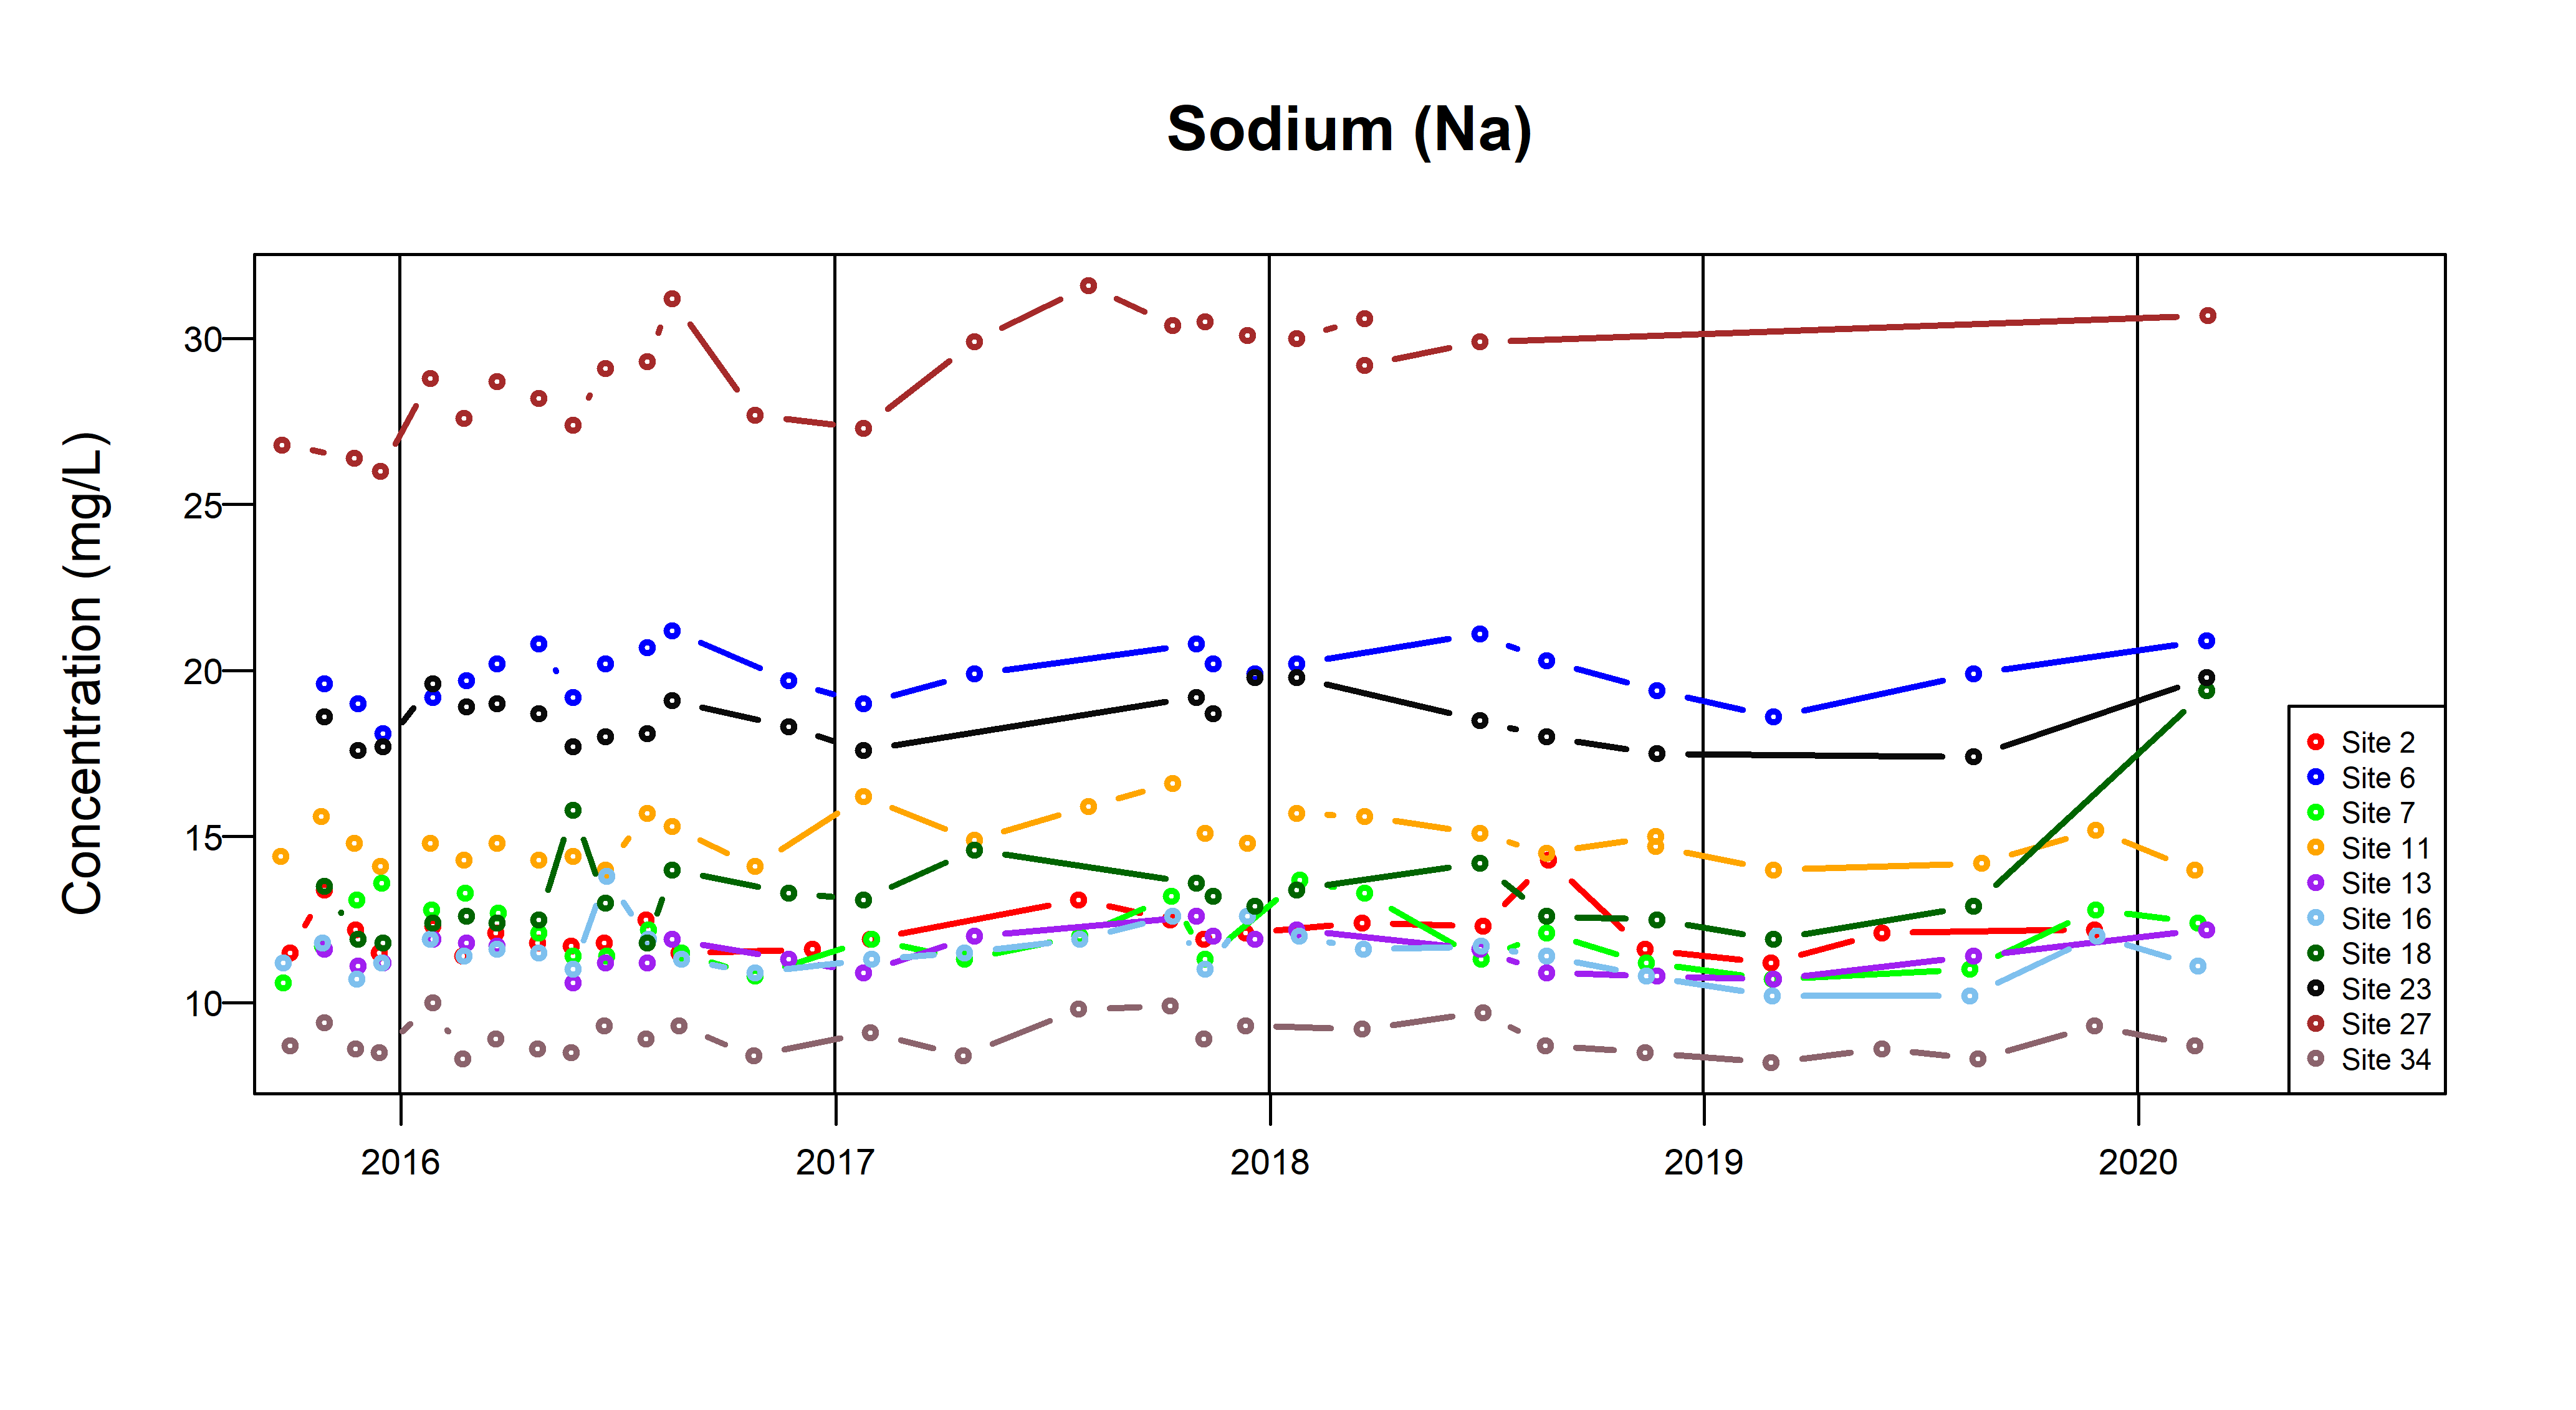
Figure 12b Time-series plots for sodium measured from groundwater in the Corallian Group limestone aquifer (from September 2015). BGS © UKRI.
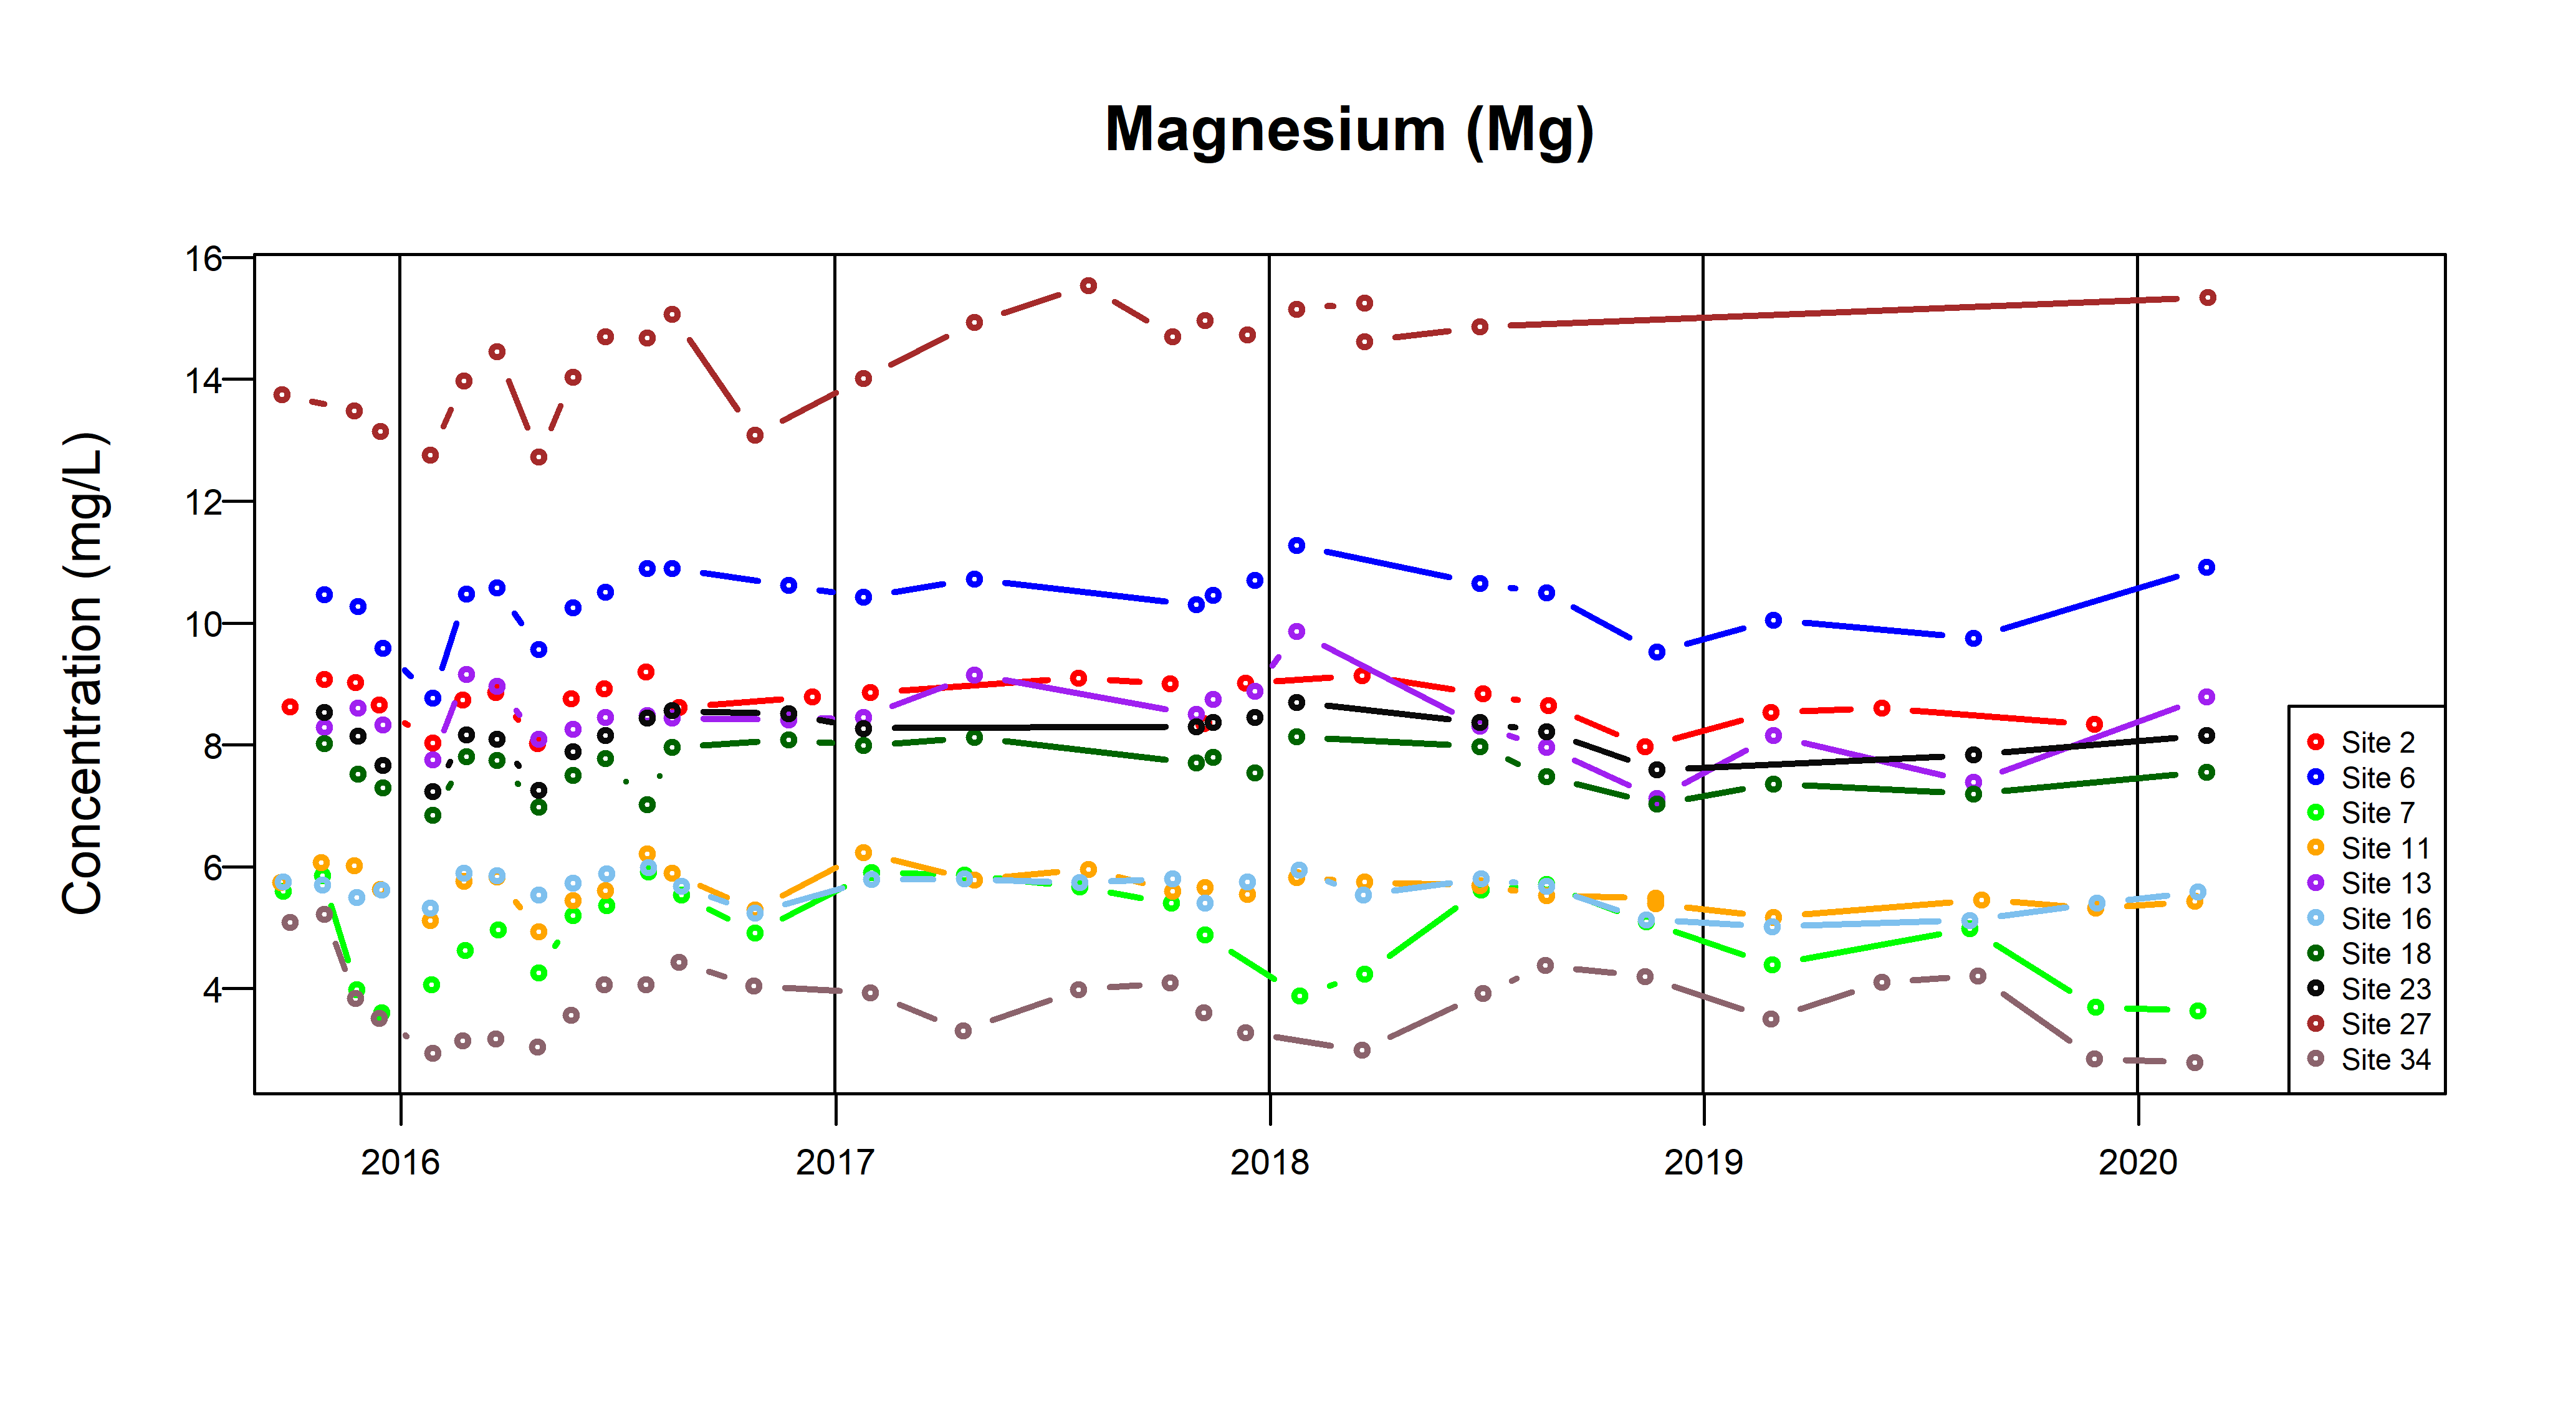
Figure 12c Time-series plots for magnesium measured from groundwater in the Corallian Group limestone aquifer (from September 2015). BGS © UKRI.
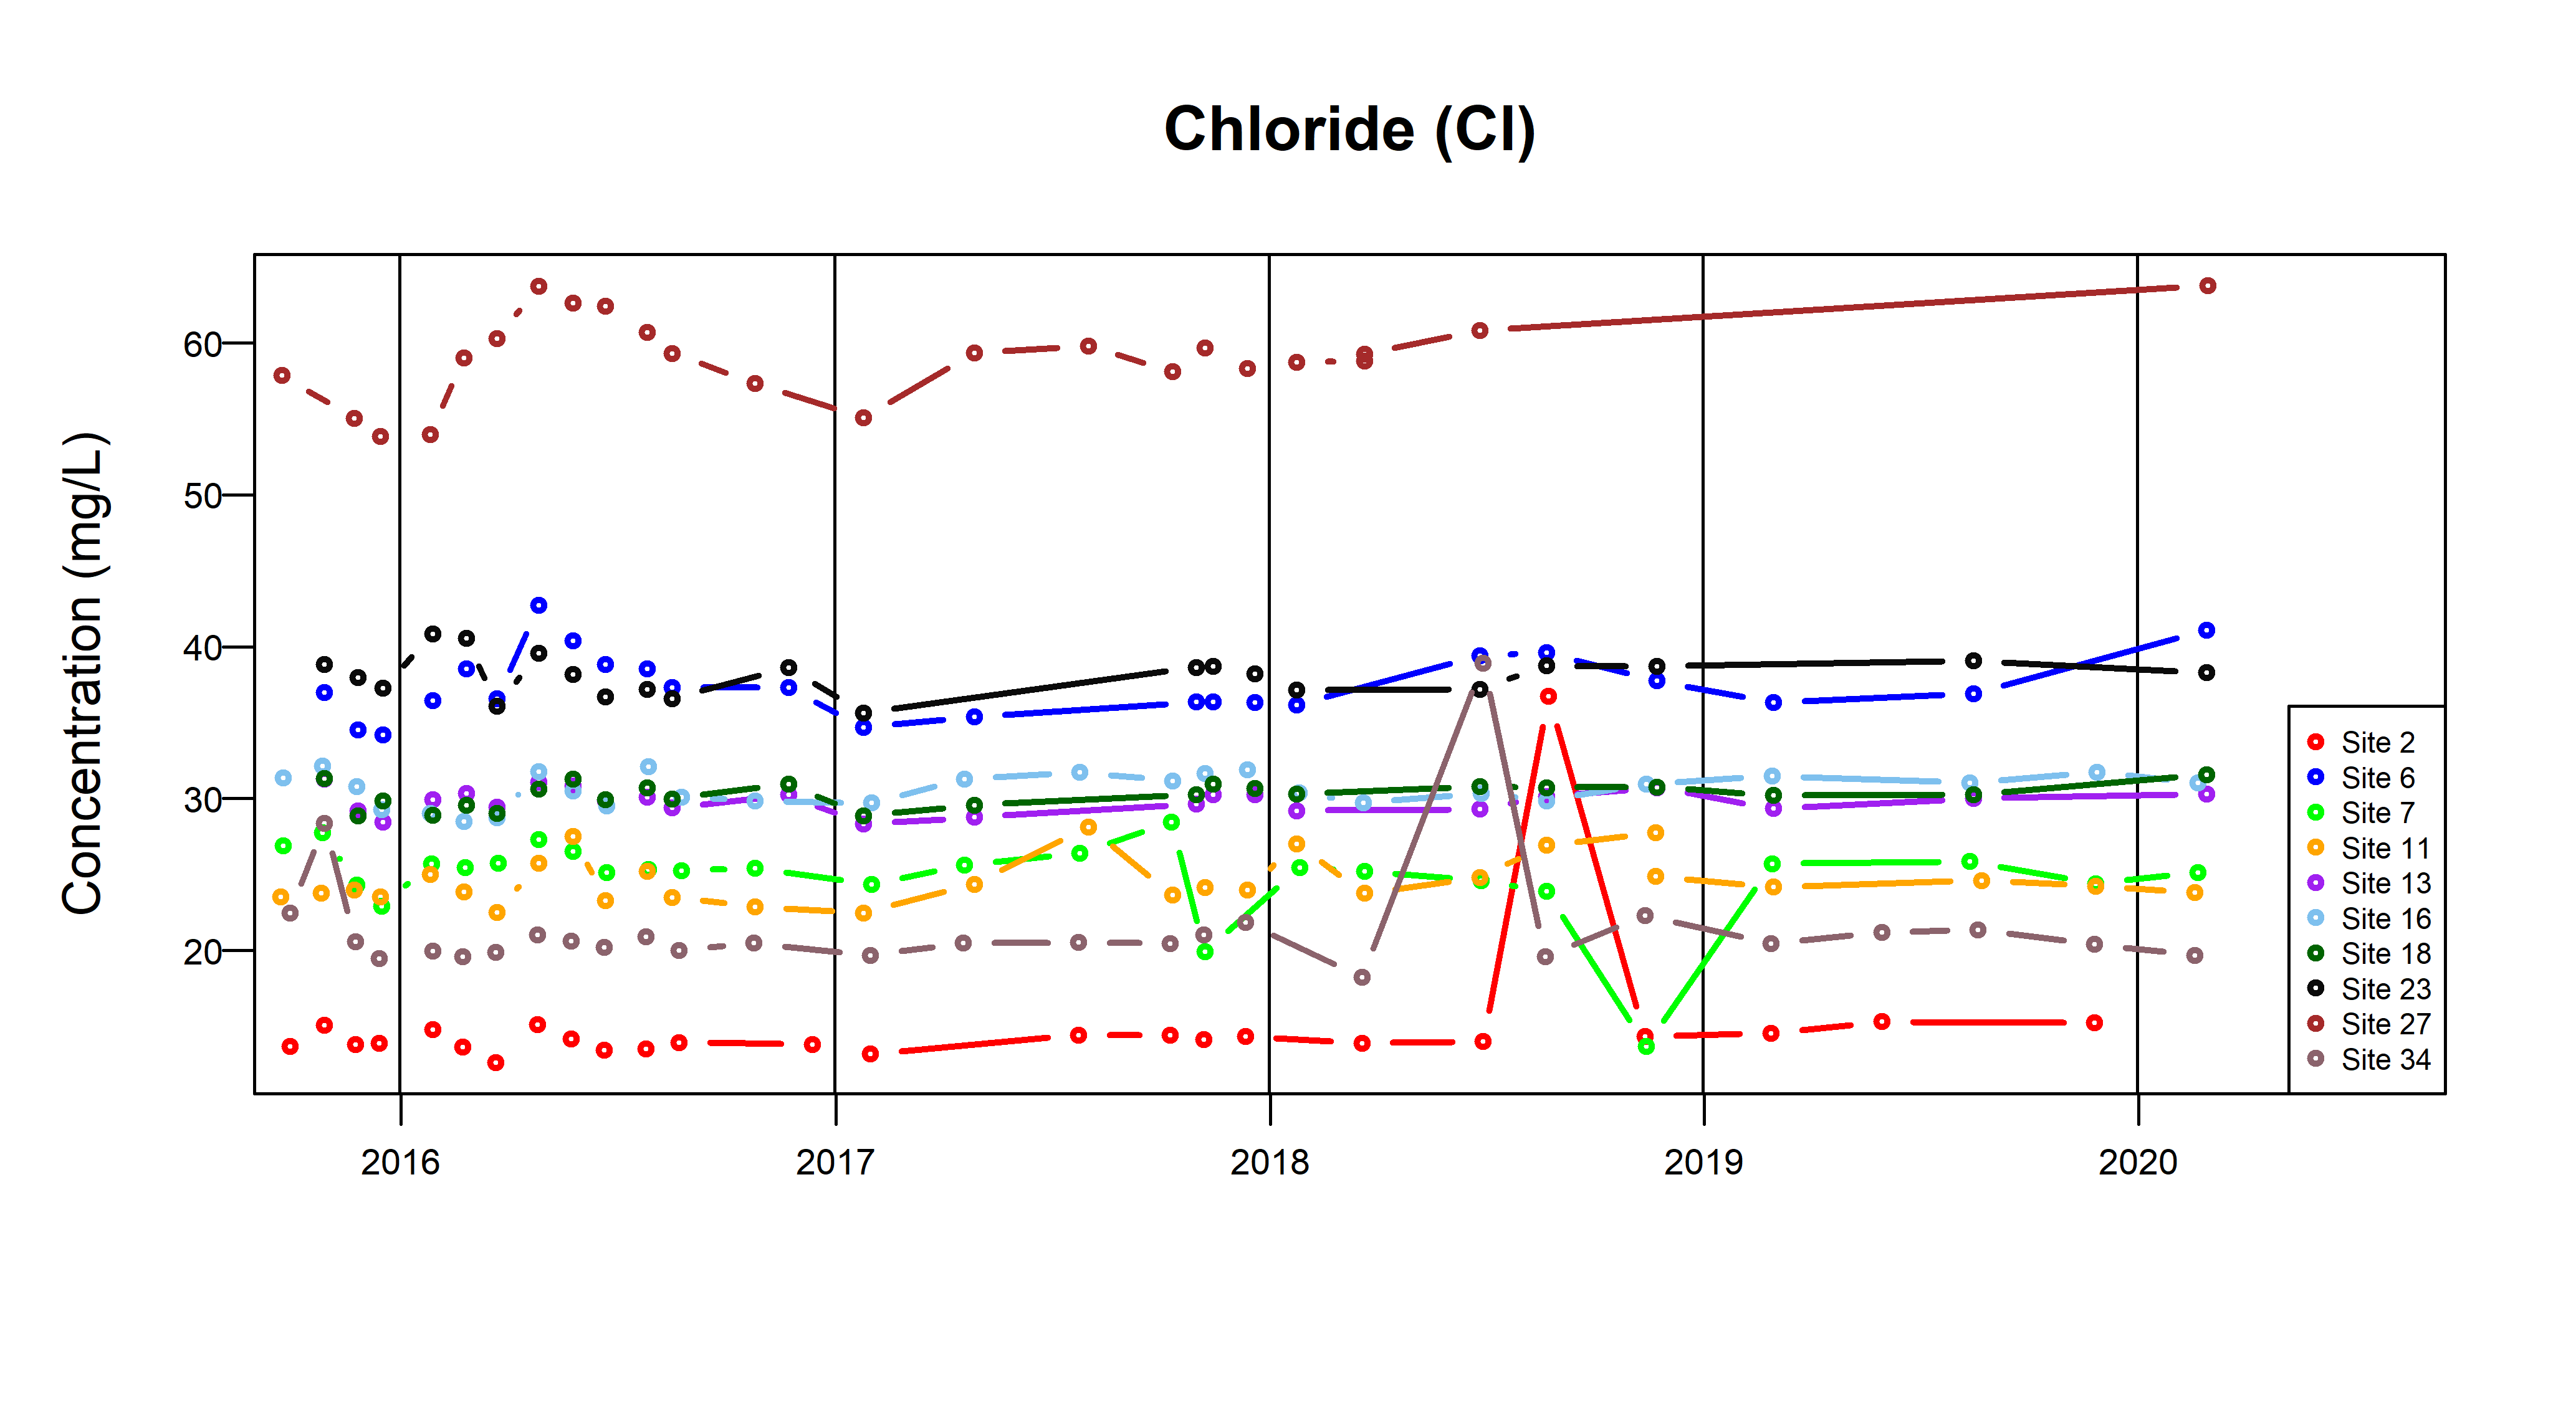
Figure 12d Time-series plots for chloride measured from groundwater in the Corallian Group limestone aquifer (from September 2015). BGS © UKRI.
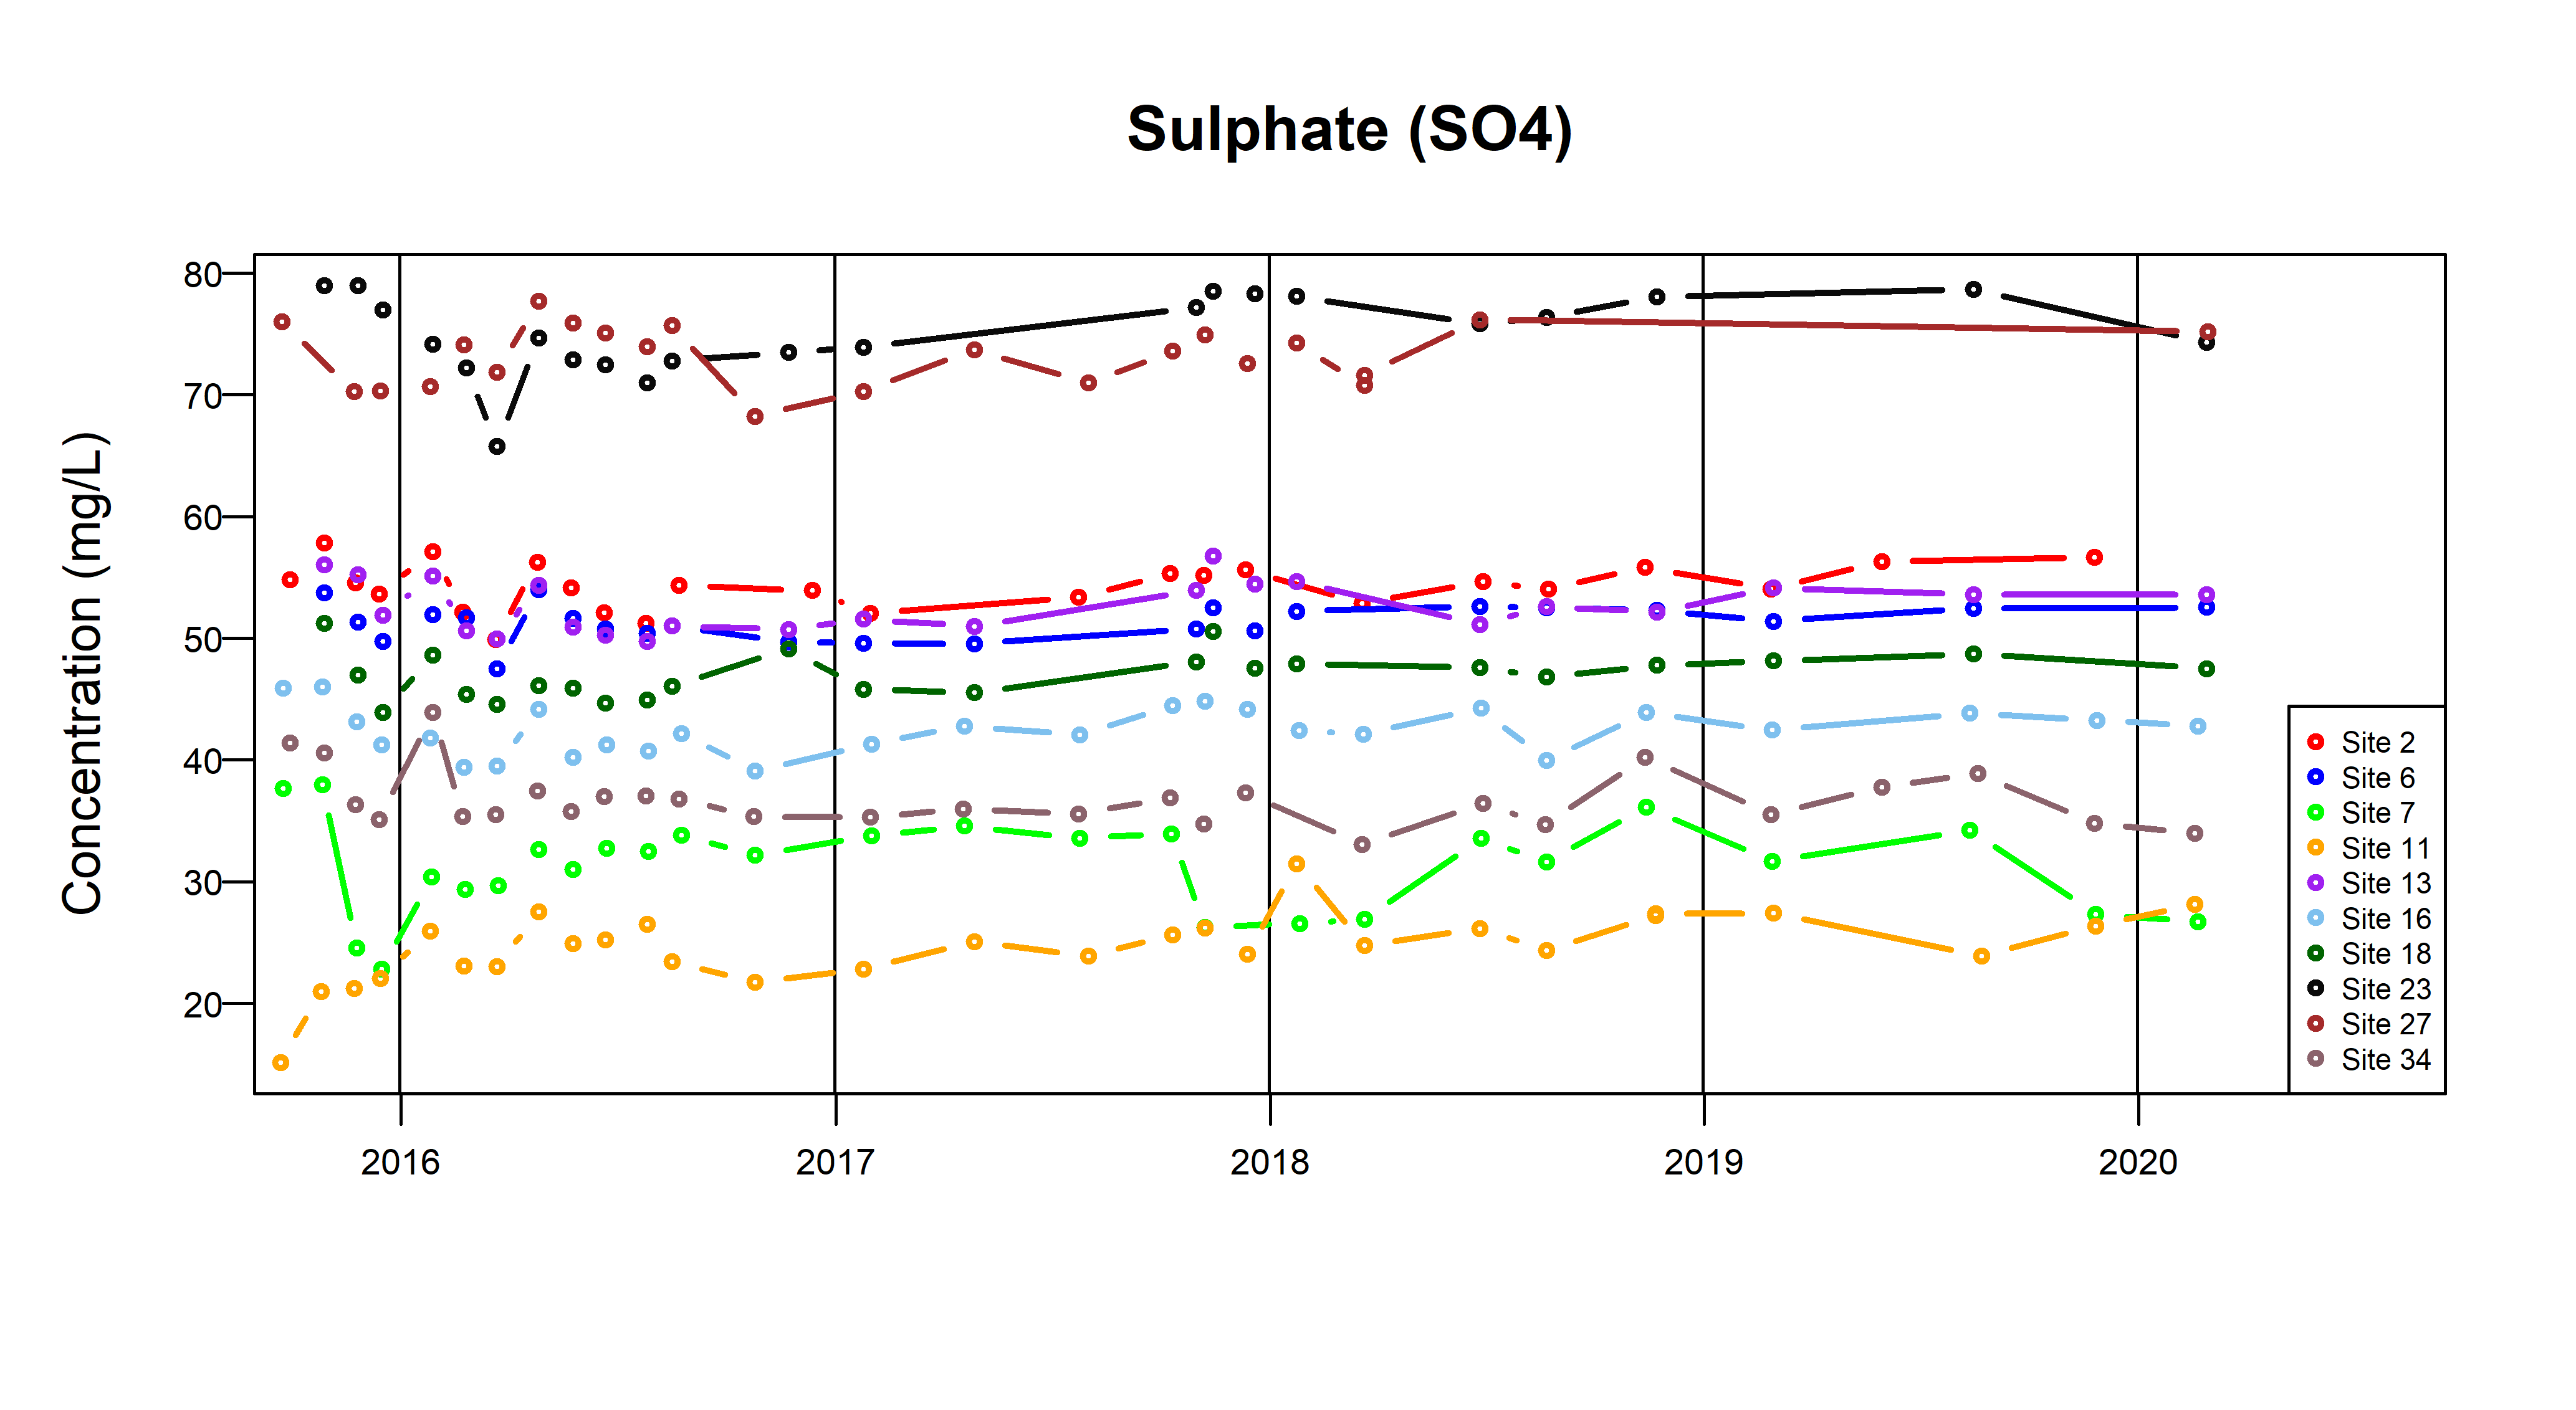
Figure 12e Time-series plots for sulfate measured from groundwater in the Corallian Group limestone aquifer (from September 2015). BGS © UKRI.
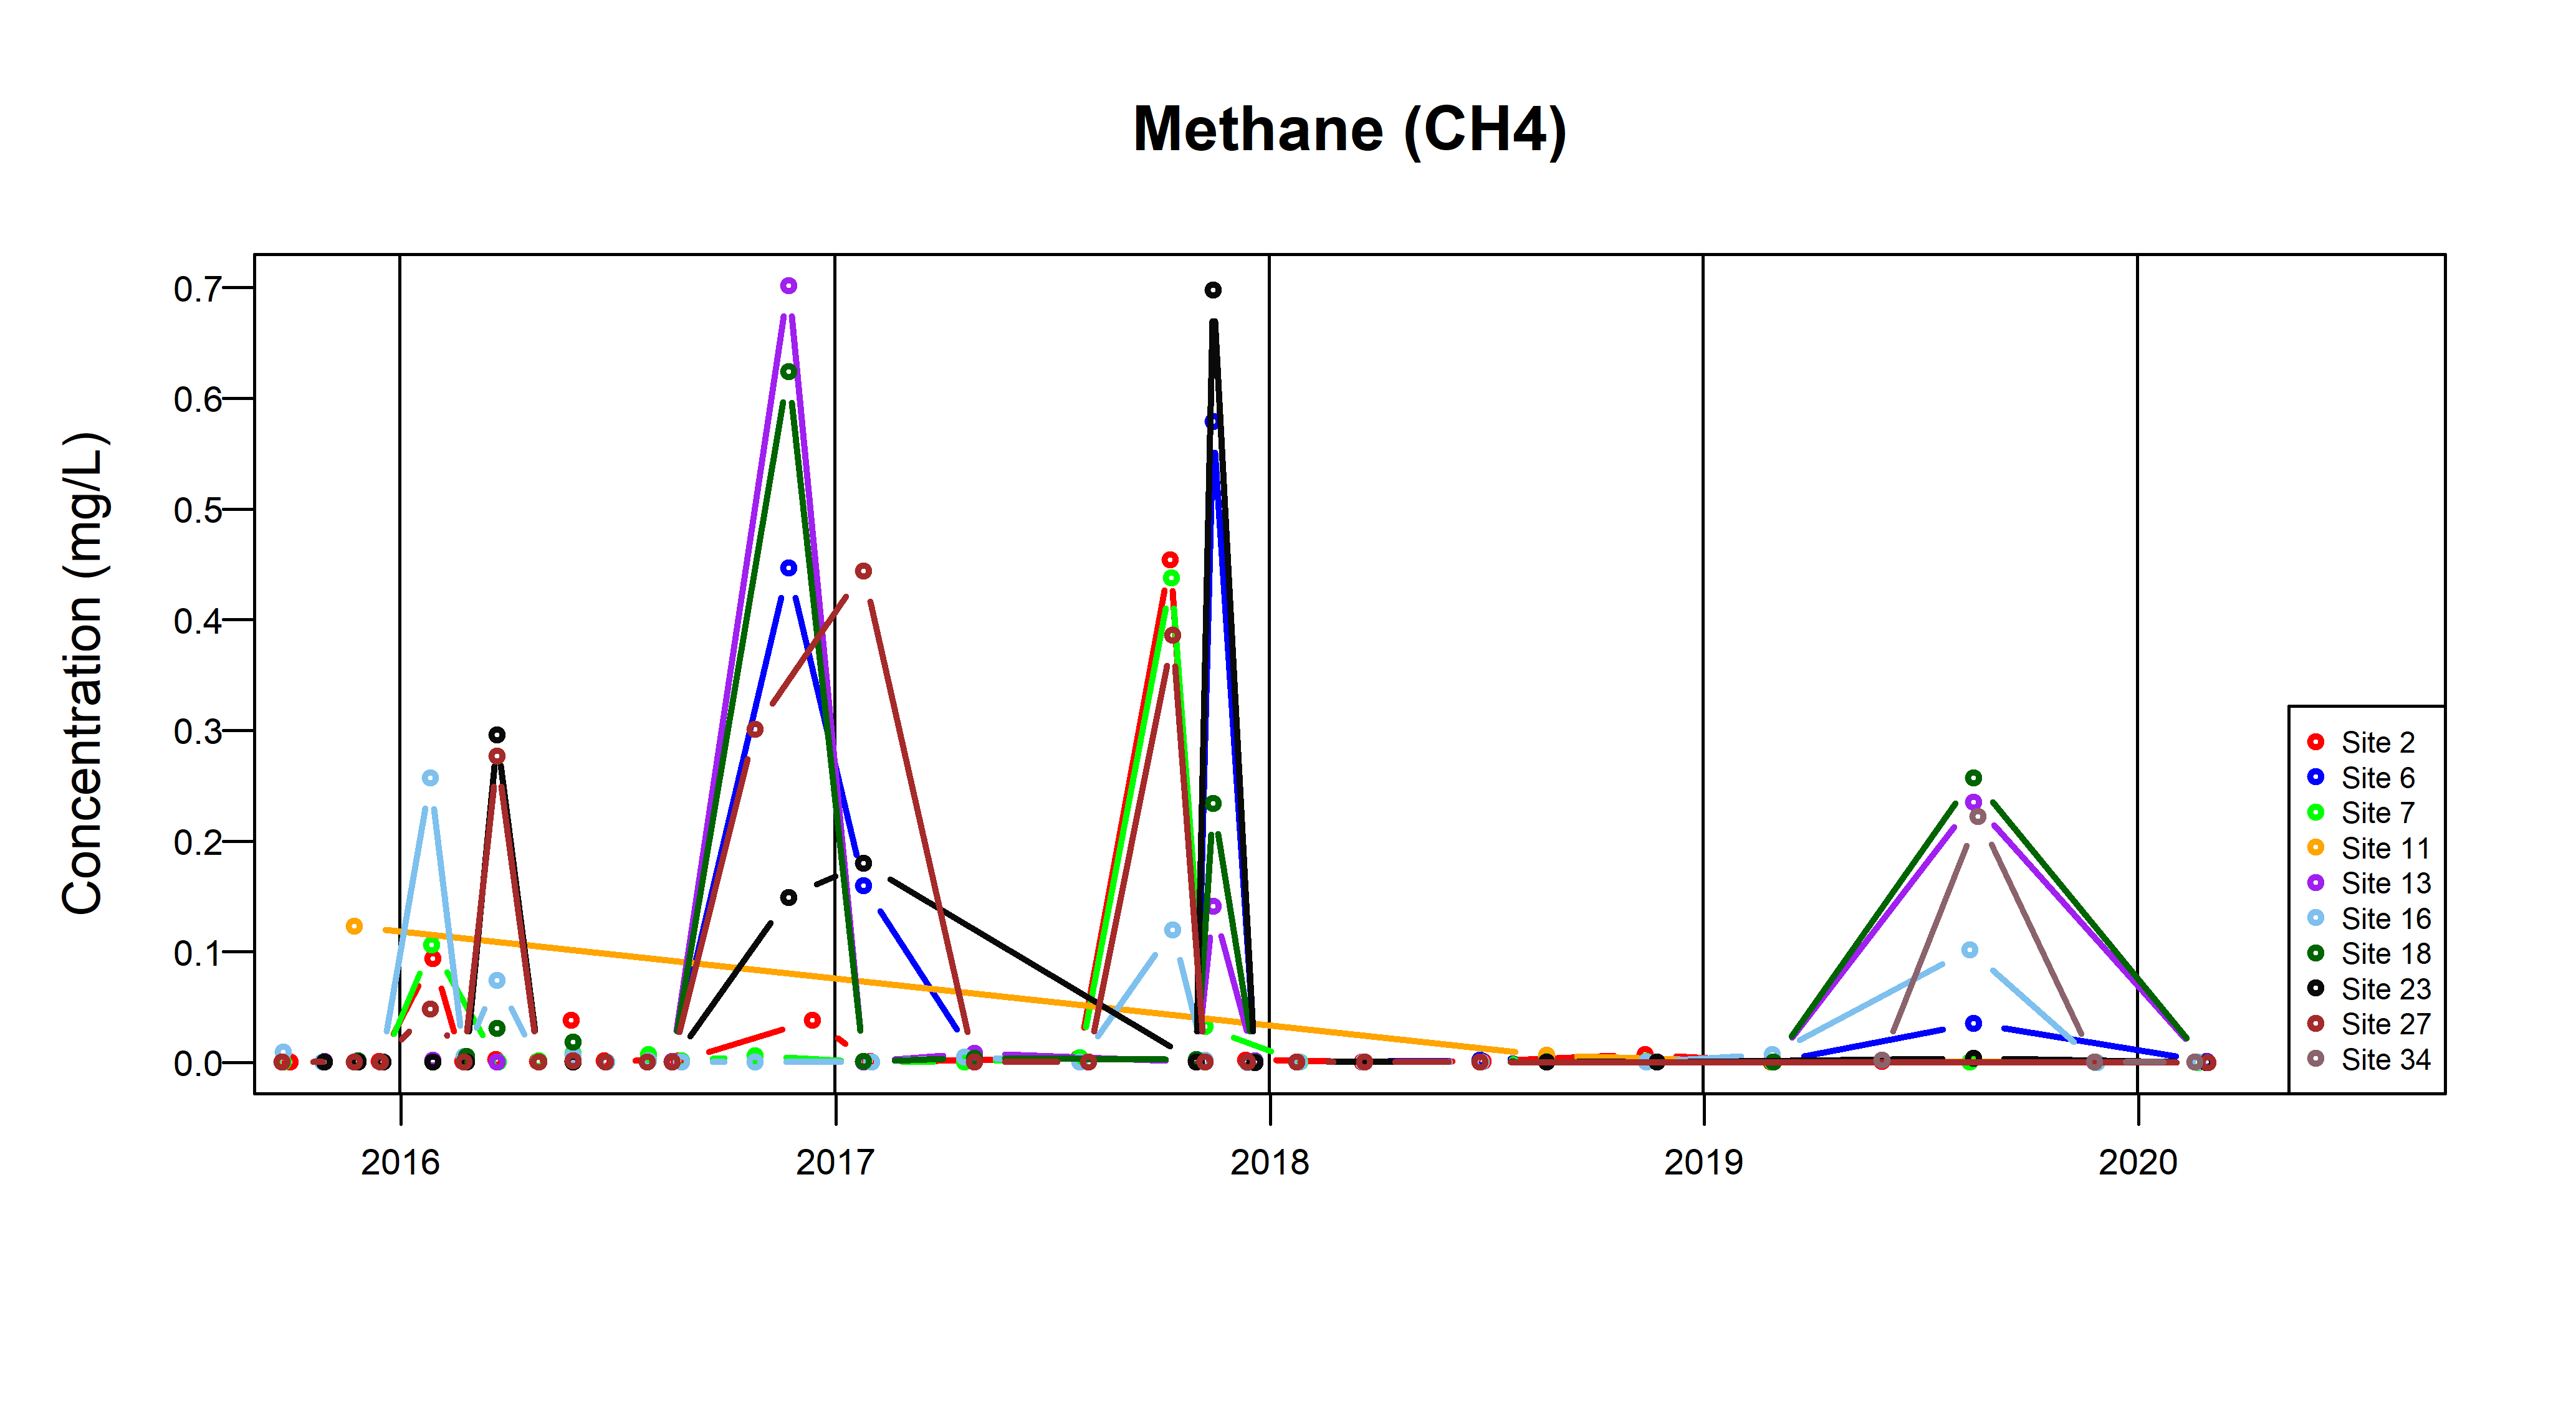
Figure 12f Time-series plots for methane measured from groundwater in the Corallian Group limestone aquifer (from September 2015). BGS © UKRI.
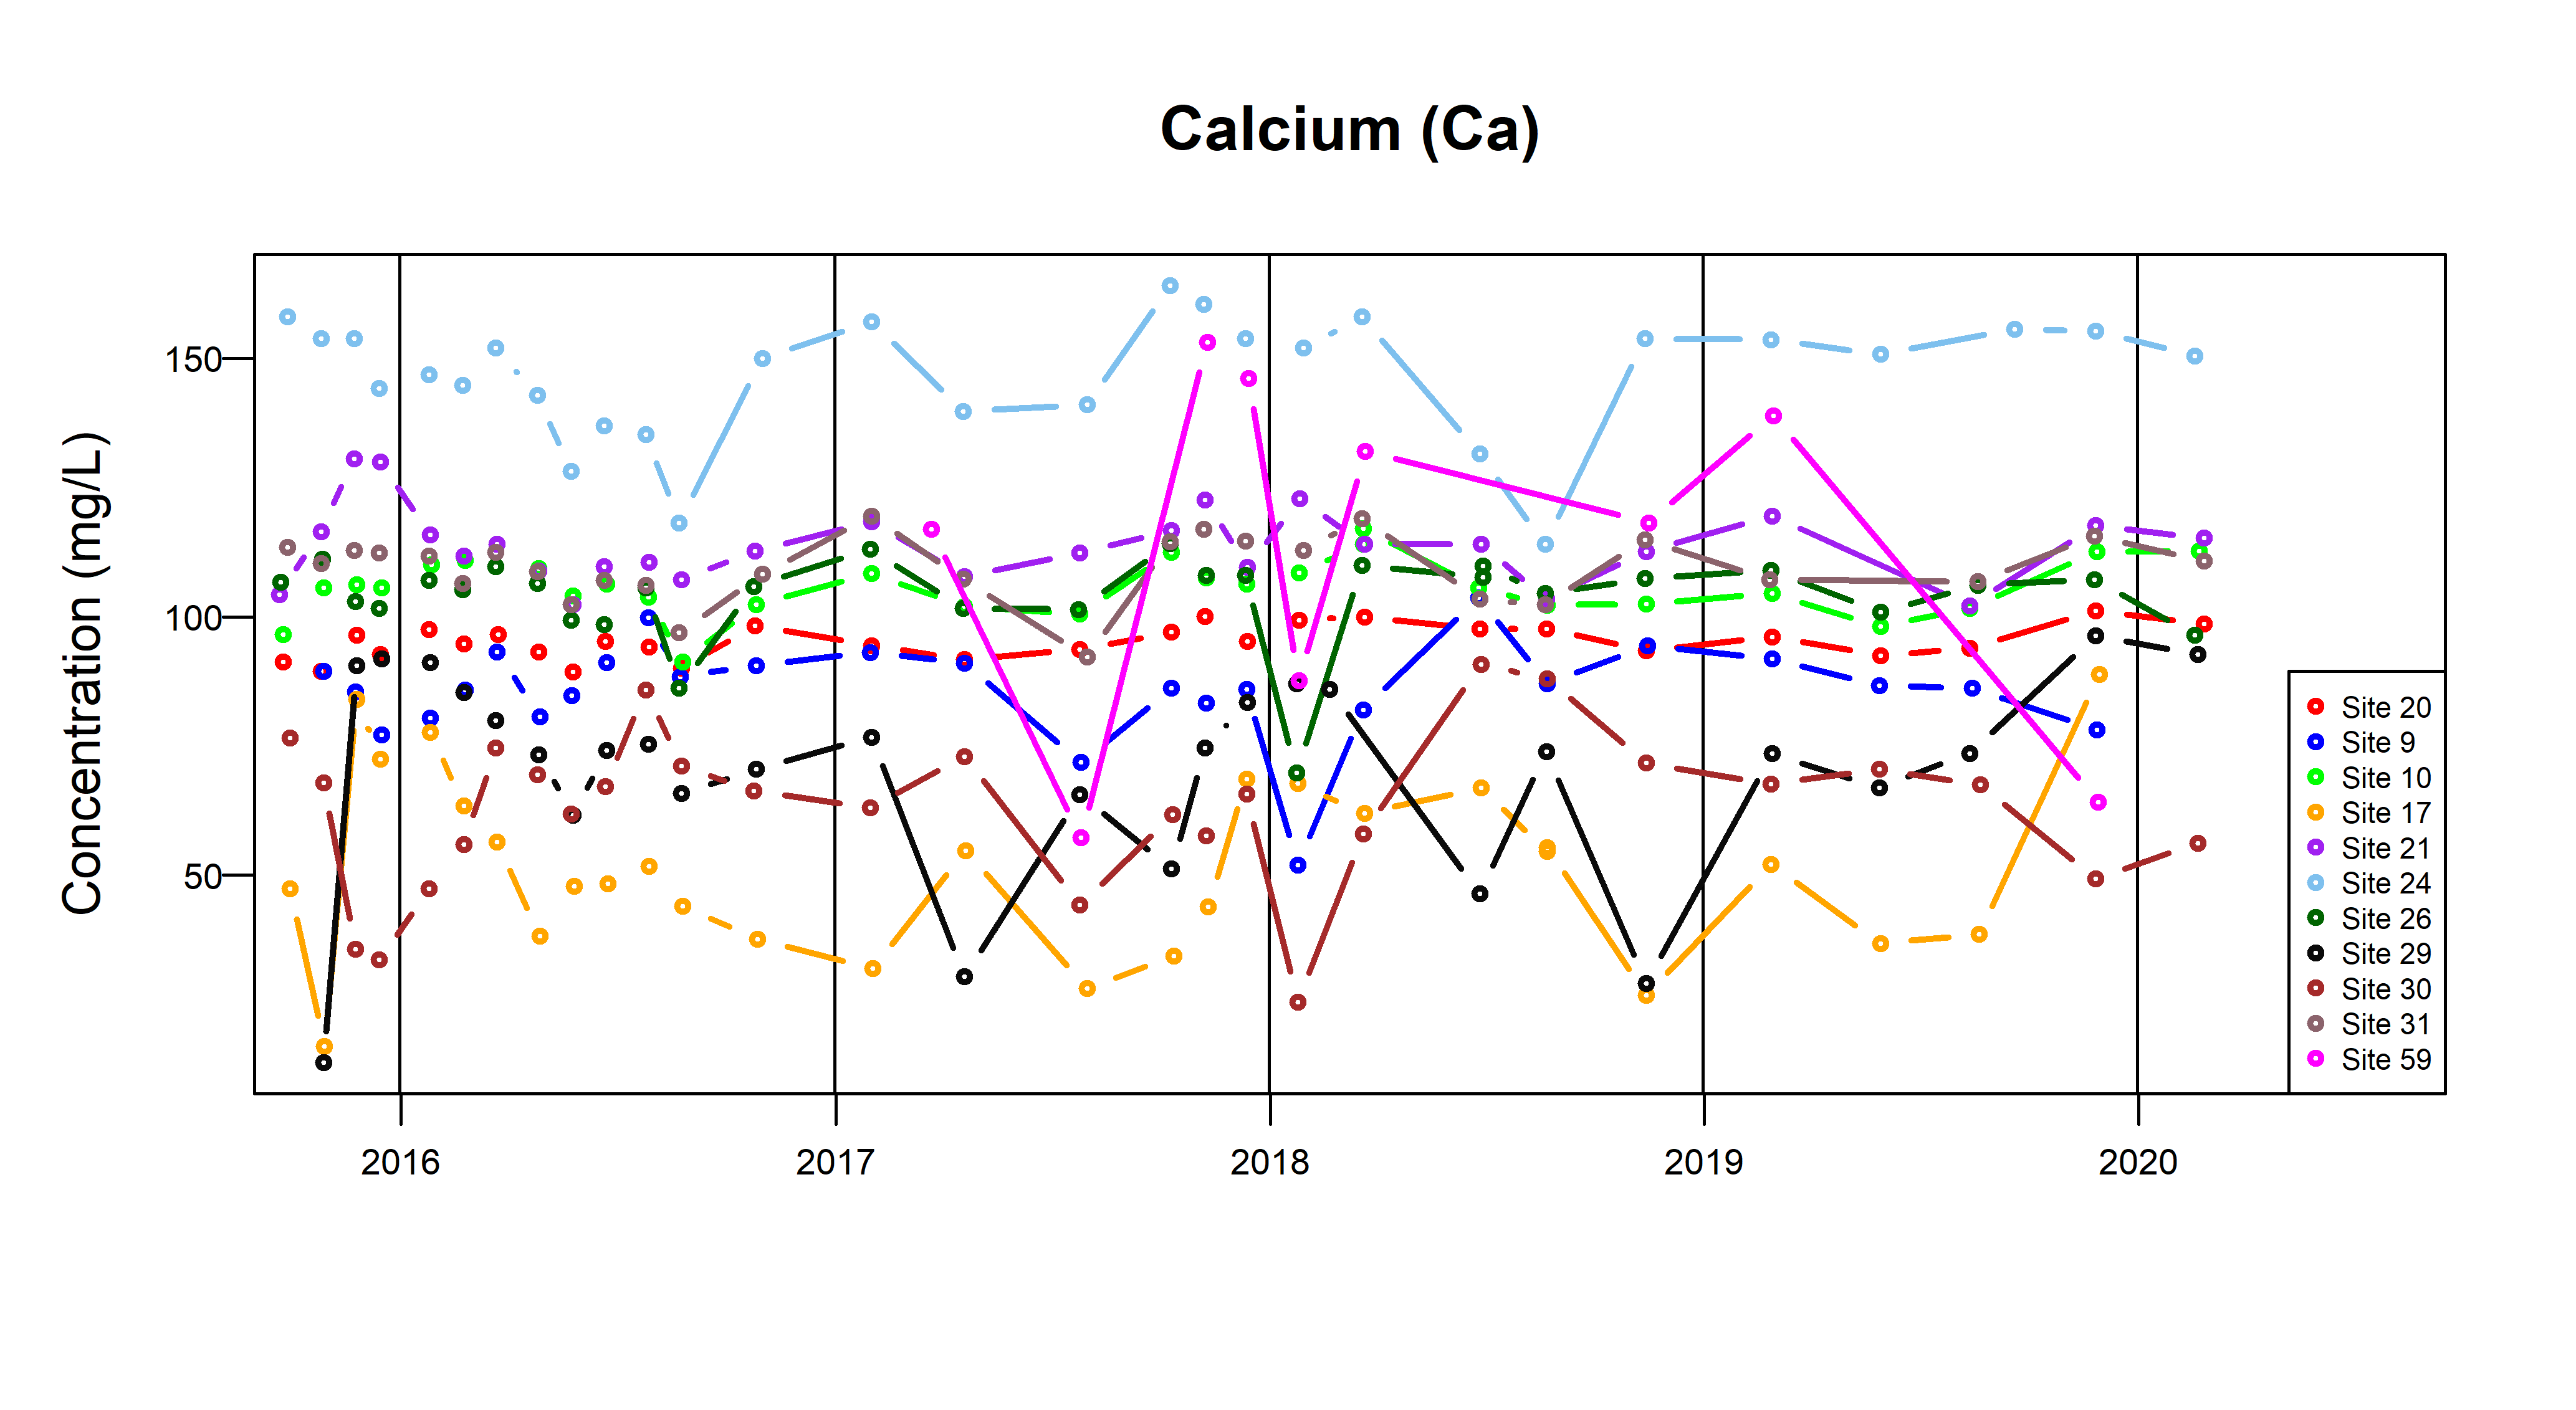
Figure 13a Time-series plots for calcium measured in streams (from September 2015). BGS © UKRI.

Figure 13b Time-series plots for sodium measured in streams (from September 2015). BGS © UKRI.
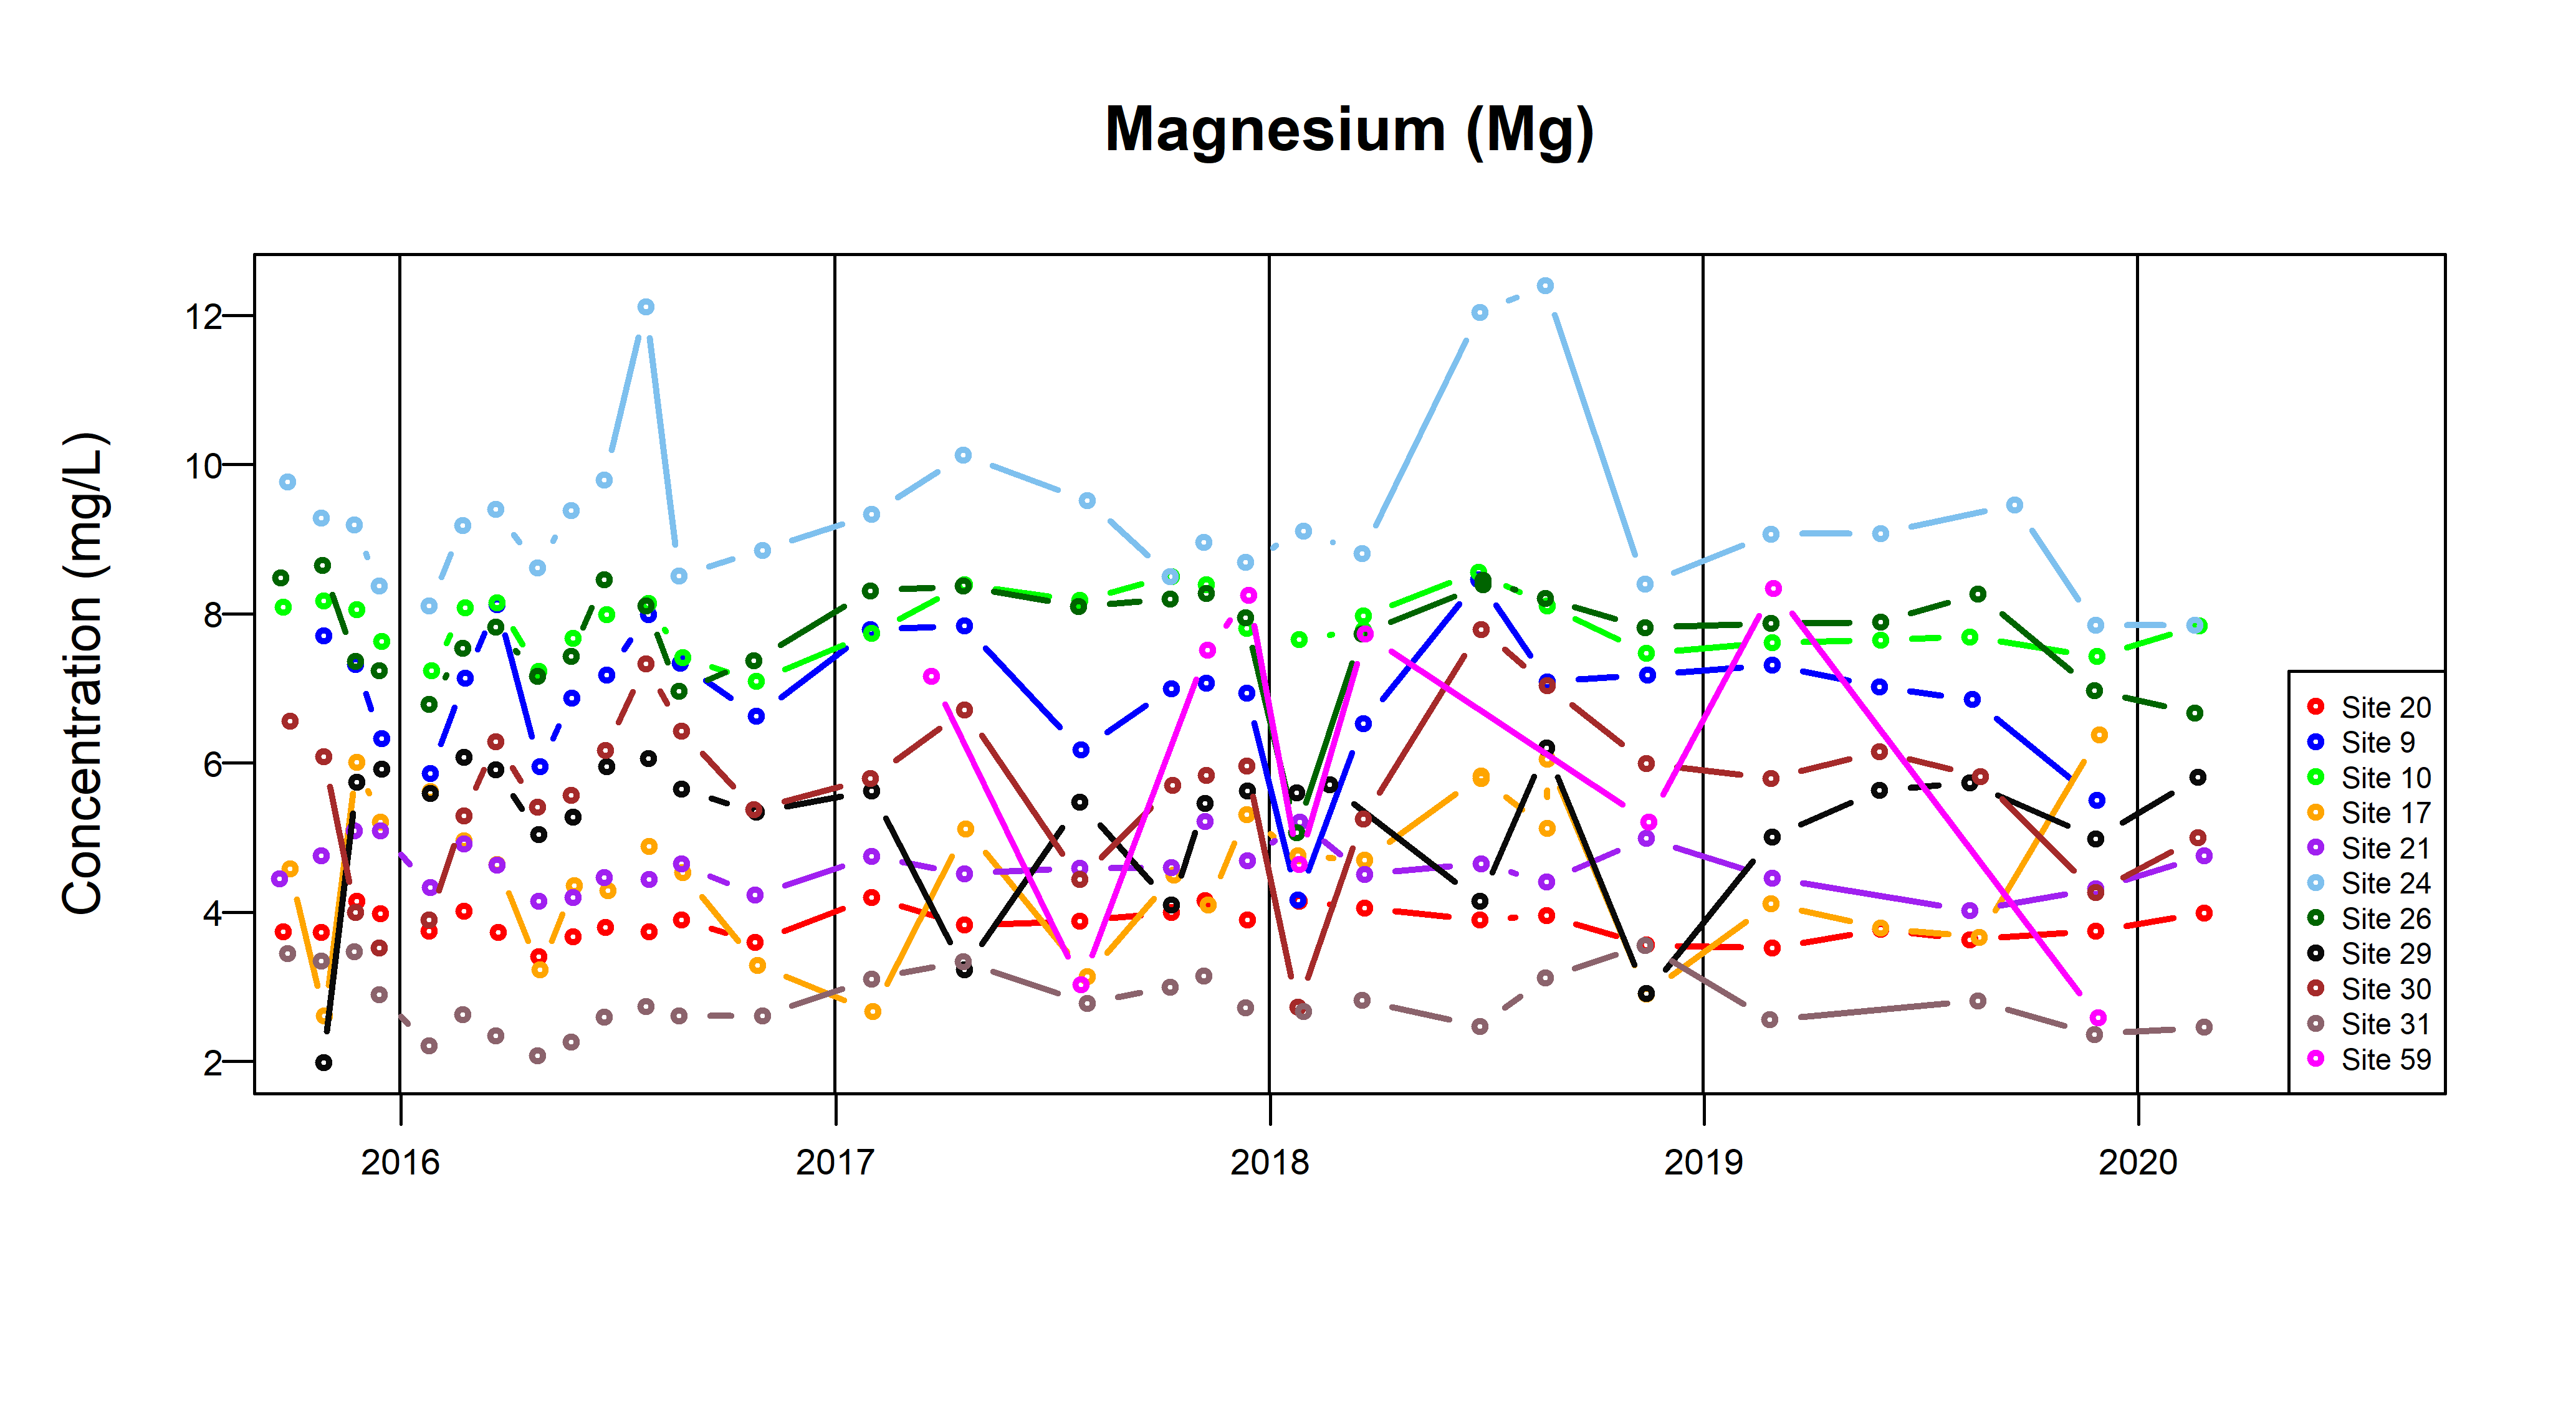
Figure 13c Time-series plots for magnesium measured in streams (from September 2015). BGS © UKRI.

Figure 13d Time-series plots for chloride measured in streams (from September 2015). BGS © UKRI.

Figure 13e Time-series plots for sulfate measured in streams (from September 2015). BGS © UKRI.
Further reading
Ford, J R, Hughes, L, Burke, H F, and Lee, J R. 2015. The Vale of Pickering: an initial summary of the Quaternary/superficial geology and data holdings. British Geological Survey Open Report OR/15/064. (Nottingham, UK: British Geological Survey.)
Bearcock, J B, Smedley, P L, and Milne, C J. 2015. Baseline groundwater chemistry: the Corallian of the Vale of Pickering, Yorkshire. British Geological Survey Open Report OR/15/048. (Nottingham, UK: British Geological Survey.)
Newell, A J, Ward, R S, and Fellgett, M W. 2016. A preliminary 3D model of post–Permian bedrock geology in the Vale of Pickering, North Yorkshire, UK. British Geological Survey Open Report OR/15/068. (Nottingham, UK: British Geological Survey.)
Smedley, P L, Ward, R S, Bearcock, J M, and Bowes, M J. 2017. Establishing the baseline in groundwater chemistry in connection with shale–gas exploration: Vale of Pickering, UK. Procedia Earth and Planetary Science, Vol. 17, 678–681. DOI: https://doi.org/10.1016/j.proeps.2016.12.143.
Smedley, P L, Ward, R S, Allen, G, Baptie, B, Daraktchieva, Z, Jones, D G, Jordan, C J, Purvis, R M and Cigna, F. 2015. Site selection strategy for environmental monitoring in connection with shale–gas exploration: Vale of Pickering, Yorkshire and Fylde, Lancashire. British Geological Survey Open Report OR/15/067. (Nottingham, UK: British Geological Survey.)
Ward, R S, Smedley, P L, Allen, G, Baptie, B J, Barker, P, Barkwith, A K A P, Bates, P, Bateson, L, Bell, R A, Coleman, M, Cremen, G, Crewdson, E, Daraktchieva, Z, Gong, M, Howarth, C H, France, J, Lewis, A C, Lister, T R, Lowry, D, Luckett, R, Mallin Martin, D, Marchant, B P, Miller, C A, Milne, C J, Novellino, A, Pitt, J, Purvis, R M, Rivett, M O, Shaw, J, Taylor-Curran, H, Wasiekiewicz, J M, Werner, M, and Wilde, S. 2020. Environmental monitoring: phase 5 final report (April 2019 – March 2020). British Geological Survey Open Report OR/20/035 (Nottingham, UK: British Geological Survey.)
Ward, R S, Smedley, P L, Allen, G, Baptie, B J, Barkwith, A, Bateson, L, Bell, R A, Bowes, M, Coleman, M, Cremen, G, Daraktchieva, Z, M, Fisher, R E, Gong, M, Howarth, C H, Jones, D G, Jordan, C J, Lanoiselle, M, Lewis, A, Lister, T R, Lowry, D, Luckett, R, Mallin–Mertin, D, Marchant, B, Miller, C A, Milne, C J, Novellino, A, Pitt, J, Purvis, R M, Rivett, M, Shaw, R, Wasikiewicz, J M, Werner, M, and Wilde S. 2020. Environmental monitoring: phase 4 final report (April 2018 – March 2019). British Geological Survey Open Report OR/19/044. (Nottingham, UK: British Geological Survey.)
Ward, R S, Smedley, P L, Allen, G, Baptie, B J, Cave, M R, Daraktchieva, Z, Fisher, R, Hawthorn, D, Jones, D G, Lewis, A, Lowry, D, Luckett, R, Marchant, B P, Purvis, R M, and Wilde, S. 2018. Environmental baseline monitoring: phase III final report (2017 – 2018). British Geological Survey Open Report OR/18/026. (Nottingham, UK: British Geological Survey.)
Ward, R S, Smedley, P L, Allen, G, Baptie, B J, Daraktchieva, Z, Horleston, A, Jones, D G, Jordan, C J, Lewis, A, Lowry, D, Purvis, R M, and Rivett, M O. 2017. Environmental baseline monitoring project. Phase II, final report. British Geological Survey Open Report OR/17/049. (Nottingham, UK: British Geological Survey.)