
Radon (chemical symbol: Rn) is a naturally occurring radioactive gas that is released from the ground and is present everywhere. Outdoor Rn levels in the UK are low, typically a few becquerels (Bq) per cubic metre (m3) of air. (1 Bq means one event per second on average for aperiodic radioactive decays.)
Indoor Rn levels vary across the UK from less than ten to thousands of Bq per m3 of air. More information is available at UKradon.
The 2014 Public Health England (PHE; now the UK Health Security Agency, UKHSA) report on the potential public health impact of shale gas in the UK recognised that Rn may be released into the environment from shale gas activities but at levels that are not expected to result in significant additional Rn exposure. The report recommended the establishment of baseline Rn levels in areas of interest for shale gas activities.
PHE monitored the existing outdoor and indoor Rn concentrations in the Fylde, Lancashire for this project .
Radon affected areas
‘Radon affected areas’ are those where at least 1 per cent of homes are expected to have high Rn levels. The area of the Fylde in Lancashire is not a Rn affected area. This is illustrated in Figure 1.
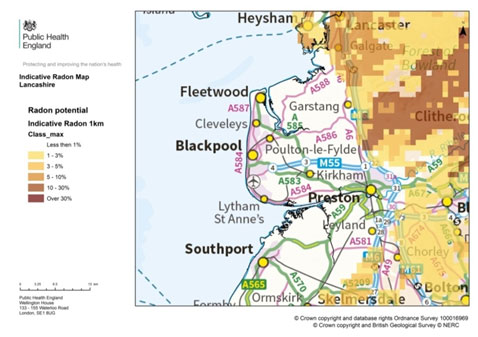

Figure 1 Rn potential in the Fylde. BGS © UKRI.
Indoor radon monitoring
Results from the five three-month periods (May 2017 to August 2018)
Three areas were selected for indoor Rn monitoring in the Fylde:
- the area around Little Plumpton, about 2 to 3 km from the Preston New Road extraction site
- the area around Roseacre Wood
- the area around Woodplumpton (control site)
The control site was chosen as it was situated at a similar distance from both the Preston New Road site and the Roseacre Wood site.
In early April 2017, a total of 600 households were sent letters inviting them to take part in the indoor Rn monitoring. There were 135 positive replies (23 per cent response rate). In early May 2017, detectors were sent to those householders that had agreed to monitor Rn in their homes. These were in the target areas around Little Plumpton (51 houses), Roseacre Wood (47 houses) and Woodplumpton (37 houses).
Each test consists of PHE’s standard pack of two passive detectors that are placed in an occupied bedroom and living area for three months. Indoor Rn was monitored over the length of this study in the selected houses. Each participant received several three-month packs. In addition, each home received detectors to carry out monitoring for a longer, continuous period.
Results from the reported annual average Rn concentrations estimated from the five three-month back-to-back tests in homes were analysed and are presented in Table 1. The annual average Rn concentrations were calculated employing seasonal correction factors as outlined in the PHE validation scheme (Howarth and Miles, 2008). Distribution parameters were calculated for each area, assuming log–normality. The results for the homes around Little Plumpton, Roseacre Wood and Woodplumpton are consistent with the expected low Rn potential for this area.
Outdoor radon monitoring
This part of the project established the baseline level of Rn in outdoor air. Two areas were selected for outdoor Rn monitoring in the Fylde:
- the area around Little Plumpton, about 2 km from the Preston New Road site (9 sampling points)
- the area around Woodplumpton, about 10 km from the Preston New Road site (control site: 10 sampling points)
Passive Rn monitors, very similar to those used routinely in homes, were placed in small aluminium-wrapped plastic pots in discreet but open-air locations for three months or longer. The outdoor Rn monitoring pack and placement of detectors are shown in Figure 3.

Figure 3 Placement of PHE outdoor Rn monitoring pack. BGS © UKRI.
Results from the monitoring (March 2017 to September 2018)
The aluminium-wrapped plastic pots placed at each sampling point initially contained four three-month and four one-year passive detectors to record Rn concentrations. The detectors were replaced and processed following the standard procedures during the monitoring period. Some of the sites around Woodplumpton were vandalised, with pots or detectors missing. No data was reported for some of the periods at these sites.
Aggregated results for outdoor monitoring from the four three-month measurement and one six-month period, including the one-year test, are given in Table 2. The analysis of the detectors for these periods indicates that the average Rn levels were similar around the Little Plumpton area and the Woodplumpton area.
The results are similar to those measured in previous studies (Wrixon et al., 1988). The results for the three-month for both areas show low Rn levels and are close to the detection limit for the passive Rn detection technique.
The estimated average Rn concentrations at each sampling point in the areas around Little Plumpton and Woodplumpton are presented in Figures 5a and 5b.
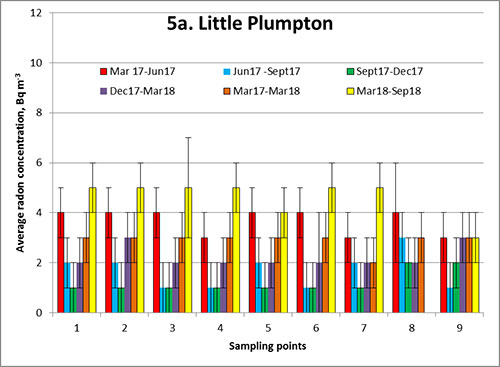
Figure 5a Average radon concentrations at the sampling points around Little Plumpton. BGS © UKRI.
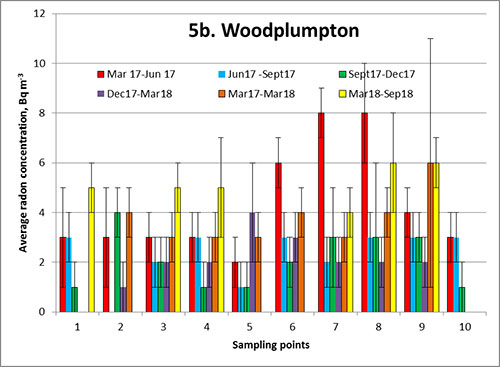
Figure 5b Average Rn concentrations at the sampling points around Woodplumpton. BGS © UKRI.
Monitoring near the Preston New Road site
Measurements of Rn in outdoor air were made close to the Preston New Road site. Continuous measurements were made using an active monitor called AlphaGUARD.
The data from the AlphaGUARD for the period March 2017 to September 2018 was analysed. The inherent background reading of the instrument of 2 Bq m-3, resulting from the longer half-life, alpha-emitting radionuclides, was taken into account when the data was processed. The Rn data, which was taken at one-hour intervals, was log-normally distributed.
The distribution parameters for the five monitoring periods are given in Table 3. The first four monitoring periods were three months, while the fifth period was six months. The average Rn concentrations measured over the five monitoring periods were in the range 2 to 9 Bq m-3.
Ten passive monitors were also placed at the same location. The average Rn concentrations measured using the passive detectors were similar to the arithmetic means (AM) of the distributions measured with the AlphaGUARD for these periods, as shown in Table 3.
Time series of the measured Rn without background correction are given in Figure 6. The results show that there are variations in the hourly concentrations measured at the site, however the overall average Rn concentrations agrees well with the results of the passive detectors from the same location.
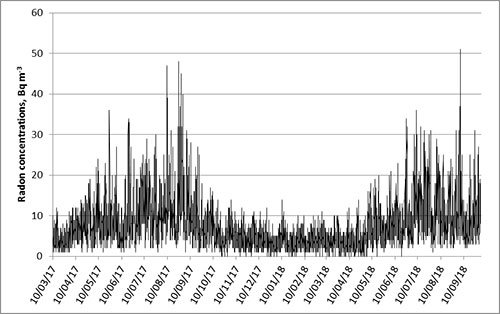
Figure 6 Time series of Rn concentrations as recorded by the AlphaGUARD. BGS © UKRI.
Summary
The results for both the outdoor and indoor Rn monitoring show low Rn concentrations that are consistent with the anticipated Rn levels in this area.
Data tables
Range and distribution of reported annual average Rn concentrations. GM: geometric mean; GSD: geometric standard deviation.
| Area (number of homes per period) | May–Aug 17, Bq/m3 | Aug–Nov 17, Bq/m3 | Nov–Feb 18, Bq/m3 | Feb–May 18, Bq/m3 | May–Aug 18, Bq/m3 | ||||||||||
|---|---|---|---|---|---|---|---|---|---|---|---|---|---|---|---|
| Range | GM | GSD | Range | GM | GSD | Range | GM | GSD | Range | GM | GSD | Range | GM | GSD | |
| Little Plumpton
(36/36/40) |
6–90 | 33 | 1.9 | 4–100 | 29 | 2.1 | 1–50 | 14 | 2.5 | 2–60 | 16 | 2.0 | 2–90 | 25 | 2.1 |
| Roseacre Wood
(34/33/33) |
8–90 | 25 | 1.7 | 7–70 | 23 | 1.7 | 2–40 | 13 | 1.8 | 5–30 | 12 | 1.7 | 6–100 | 23 | 1.9 |
| Woodplumpton
(40/36/32) |
10–80 | 26 | 1.7 | 8–80 | 21 | 1.8 | 4–60 | 11 | 1.7 | 5–40 | 11 | 1.7 | 5–60 | 20 | 1.7 |
Analysis of outdoor Rn results.
| Area | Mar–Jun 17, Bq/m3 | Jun–Sep 17, Bq/m3 | Sep–Dec 27, Bq/m3 | Dec 17–Mar 18, Bq/m3 | Mar 17–Mar 18, Bq/m3 | Mar–Sep 2018, Bq/m3 |
|---|---|---|---|---|---|---|
| Little Plumpton | 4±1 | 2±1 | 1±1 | 2±1 | 3±1 | 5±1 |
| Woodplumpton | 4±1 | 3±1 | 2±1 | 2±1 | 4±2 | 5±1 |
Range and distribution of AlphaGUARD Rn measurements. AM: arithmetic mean; GM: geometric mean; GSD: geometric standard deviation; SD: standard deviation.
| Monitoring period | Alphaguard | Passive detectors | ||||
|---|---|---|---|---|---|---|
| Bq/m3 | Bq/m3 | |||||
| Range | AM | GM | GSD | AM | SD | |
| Mar 17 – Jun 17 | 1–35 | 6 | 5 | 1.9 | 7 | 2 |
| Jun 17 – Sep 17 | 1–46 | 9 | 7 | 2.0 | 10 | 1 |
| Sep 17 – Dec 17 | 1–12 | 3 | 3 | 1.8 | 4 | 1 |
| Dec 17 – Mar 18 | 1–12 | 2 | 2 | 1.8 | 2 | 1 |
| Mar 18 – Sep 18 | 1–49 | 6 | 5 | 2.2 | 4 | 1 |
Further reading
Howarth, C B, and Miles, J C H. 2008. Validation scheme for organisations making measurements of radon in dwellings: 2008 Revision HPA-RPD-047. (Chilton, UK: National Radiological Protection Board.)
Wrixon, A D, Green, B M R, Lomas, P R, Miles, J C H, Cliff, K D, Francis, E A, Driscoll, C M H, James, A C, and O’Riordan, M C. 1988. Natural Radiation Exposure in UK Dwellings. Report number
NRPB-R–190. (Chilton, UK: National Radiological Protection Board.) ISBN: 0 85951 260 6. Available: https://inis.iaea.org/records/f540x-ttm61
Miles, J C H, and Algar, R A. 1988. Variations in radon–222 concentrations. Journal of Radiological Protection, Vol. 8(2), 103–106. DOI: http://doi.org/10.1088/0952-4746/8/2/005
Kibble, A, Cabianca, T, Daraktchieva, Z, Gooding, T, Smithard, J, Kowalczyk, G, McColl, N P, Singh, M, Mitchem, L, Lamb, P, Vardoulakis, S, and Kamanyire, R. 2014. Review of the Potential Public Health Impacts of Exposures to Chemical and Radioactive Pollutants as a Result of the Shale Gas Extraction Process. (Chilton, UK: National Radiological Protection Board.) Available: https://assets.publishing.service.gov.uk/media/5b9a360140f0b678692eb5ca/PHE-CRCE-009_3-7-14.pdf