
In Lancashire and Cheshire, 23 sites have been sampled for methane (CH4) in three aquifers, the main aquifer being Permo–Triassic sandstone. The Environment Agency also holds extensive CH4 data across the region.


Geology of Lancashire and Cheshire. Contains Ordnance Survey data © Crown copyright and database rights 2015.
Permo–Triassic sandstone
Permo–Triassic sandstone forms an important aquifer in this region and is used extensively for public water supply. Groundwater flow occurs mainly through pore spaces in the rock due to its high porosity, although the presence of fractures is also important. Permo–Triassic sandstone is at the surface along the Lancashire coast and can be up to 600 m thick.
Millstone Grit and shallow sand deposits
The two other aquifers sampled for CH4 are the Millstone Grit Group and other shallow sand deposits. These are classed as secondary B aquifers and are not used for public water supply.
Shale units
The shale units present in this area are the Bowland Shale Formation and the Craven Groups, which are organic-rich mudstones. In the Cheshire Basin, the shale is at its deepest, reaching depths of over 6000 m below OD. The Bowland Shale Formation and Craven Group are reported to have potential to form a shale gas resource, although this is complicated by Britain’s complex tectonic history (NSTA Bowland shale gas study 2013).
Results
These summaries are based on the results collected from single visits to each site for the purpose of the CH4 baseline project. The data is summarised for Lancashire and Cheshire as a whole and for individual aquifers, where enough data is available.
The blue boxes highlight where summary data is available for baseline groundwater quality in the different aquifers present in this region and link to the summaries for each region.
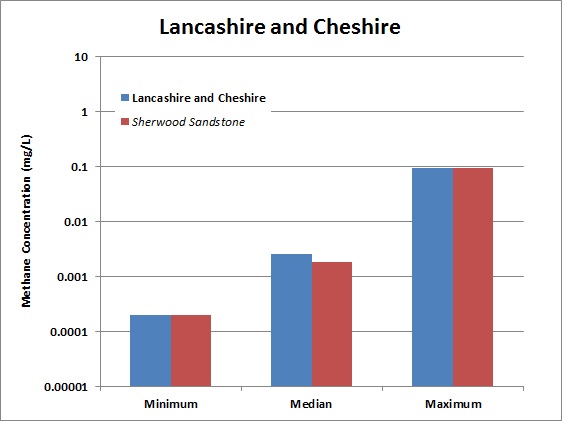
CH4 concentrations chart for the Lancashire and Cheshire basins. BGS © UKRI.
| Area | Concentration | (mg/l) | No. samples | |
|---|---|---|---|---|
| Minimum | Median | Maximum | ||
| Lancashire and Cheshire | 0.0002 | 0.0025 | 0.091 | 23 |
| Sherwood Sandstone (P/T sst) | 0.0002 | 0.0018 | 0.091 | 10 |
CH4 samples and concentrations in Lancashire and Cheshire.
Environment Agency methane data
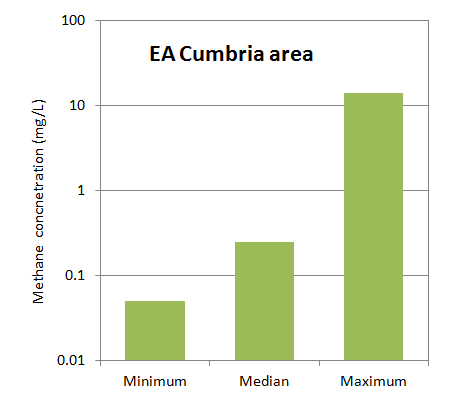
Additional CH4 data is available from monitoring carried out by the Environment Agency, North West Region, between 1985 and 2012. This sampling was done for different reasons, such as landfill monitoring. Many of the values represent multiple analyses of samples from the same site. The data has been separated into two regions: Lancashire-Cheshire and Cumbria.

| EA area | Concentration | (mg/l) | No. samples | |
|---|---|---|---|---|
| Minimum | Median | Maximum | ||
| Lancashire-Cheshire | <0.01 | <0.5 | 132 | 2842 |
| Cumbria | <0.1 | <0.5 | 14.2 | 836 |
Note: values less than the analytical detection limit have been converted to half the detection limit for the purposes of this statistical summary and graph, but the relevant detection limit is quoted in this table.
Baseline groundwater quality data
This data was collected as part of a collaborative project between BGS and the Environment Agency to investigate the baseline quality of groundwater in major UK aquifers. The UK baseline study results page provides downloads of all the reports produced by the project.
Permo–Triassic sandstone in Cheshire
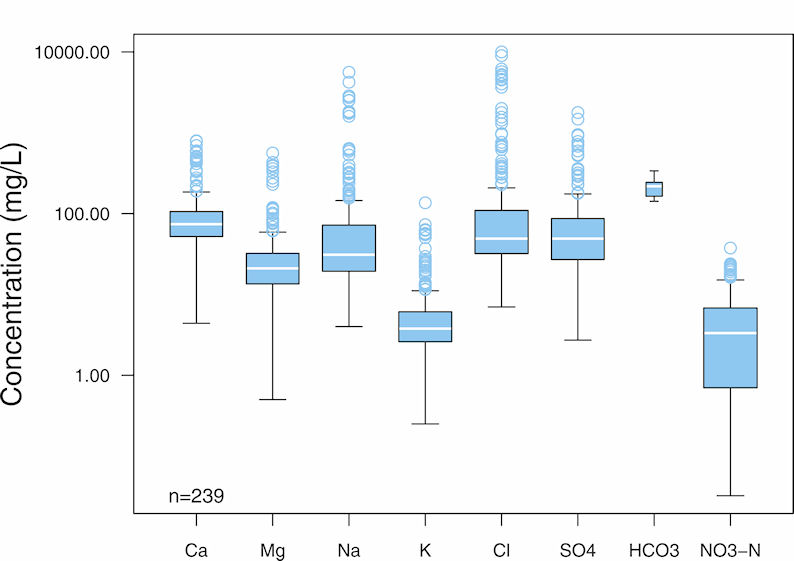
The quality of groundwater in the Permo–Triassic sandstone is determined by natural reactions between rain water and the bedrock, which creates a variable baseline. Chemical reactions take place during recharge, the most important being mineral dissolution and precipitation. The baseline in Lancashire and Cheshire has been modified by diffuse pollution, including agricultural fertilisers, which has led to locally high levels of nitrate (NO3.N), potassium (K) and sodium (Na). The ingress of saline water also has an impact on groundwater chemistry along the Mersey estuary.
| Analysis | Concentration | (mg/l) | No. samples | |
|---|---|---|---|---|
| Minimum | Median | Maximum | ||
| Ca | 4.4 | 74 | 795 | 239 |
| Mg | <1 | 21 | 562 | 239 |
| Na | 4 | 31 | 5600 | 243 |
| K | 0.25 | 3.75 | 136 | 242 |
| Cl | 7 | 49 | 10000 | 244 |
| SO4 | <4 | 49 | 1780 | 240 |
| HCO3 | 142 | 218 | 338 | 23 |
| NO3.N | <0.05 | 3.3 | 37.5 | 246 |
Baseline quality data for the Permo–Triassic sandstone in Cheshire.
Permo–Triassic sandstone in Manchester
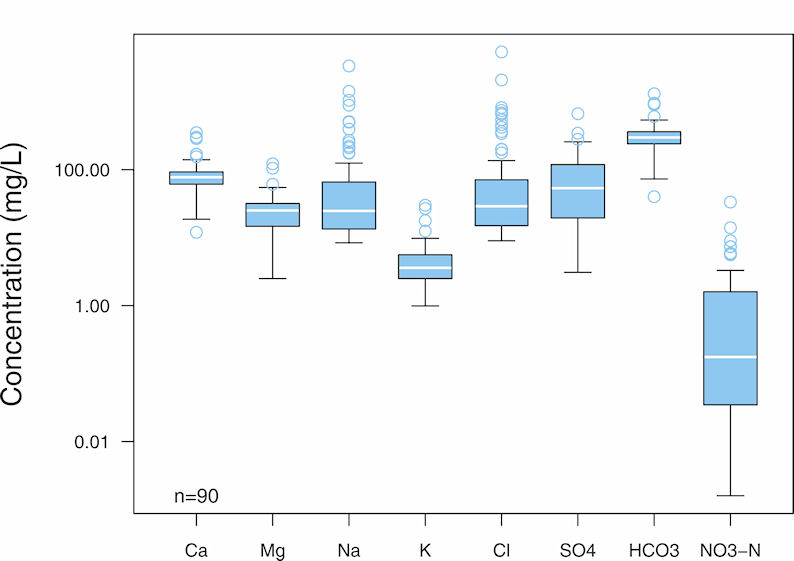
The groundwaters of the Permo–Triassic aquifer of Manchester display a wide range of chemical characteristics with concentrations for most elements varying over several orders of magnitude. These characteristics are determined largely by natural reactions between the groundwater and the rocks through which it passes. This baseline has been modified by diffuse pollutants including agricultural fertilisers leading locally to high nitrate (NO3.N) and increases in other major elements such as potassium (K), sodium (Na) and sulfate (SO4).
Most chemical parameters are highly variable due to the complex geology and the presence of drift deposits, which differ in thickness and type. These drift deposits have a significant effect on recharge of the aquifer but provide a degree of protection from diffuse or point source pollution.
| Analysis | Concentration | (mg/l) | No. samples | |
|---|---|---|---|---|
| Minimum | Median | Maximum | ||
| Ca | 12 | 86.2 | 350 | 90 |
| Mg | 2.5 | 26.8 | 122 | 90 |
| Na | 8.4 | 133 | 3360 | 90 |
| K | 0.99 | 4.85 | 30 | 90 |
| Cl | 9 | 185 | 5400 | 88 |
| SO4 | <5 | 82.9 | 666 | 90 |
| HCO3 | 40 | 316 | 1310 | 89 |
| NO3.N | <0.003 | 1.61 | 33.4 | 90 |
| Fe | <5 | 1050 | 9600 | 85 |
Baseline quality data for the Permo–Triassic sandstone in Manchester.