
There have been a number of major groundwater flooding events on the outcrop of the Chalk Group in England, with serious implications for people, property, infrastructure and transport.
Although groundwater flood risk has been investigated through localised case studies, limited research has been carried out on the hydrogeological controls on groundwater flooding at the regional scale. We undertook a study to improve our understanding of the variations over space and time in groundwater flooding across the Chalk aquifer in south-east England (Figure 1).
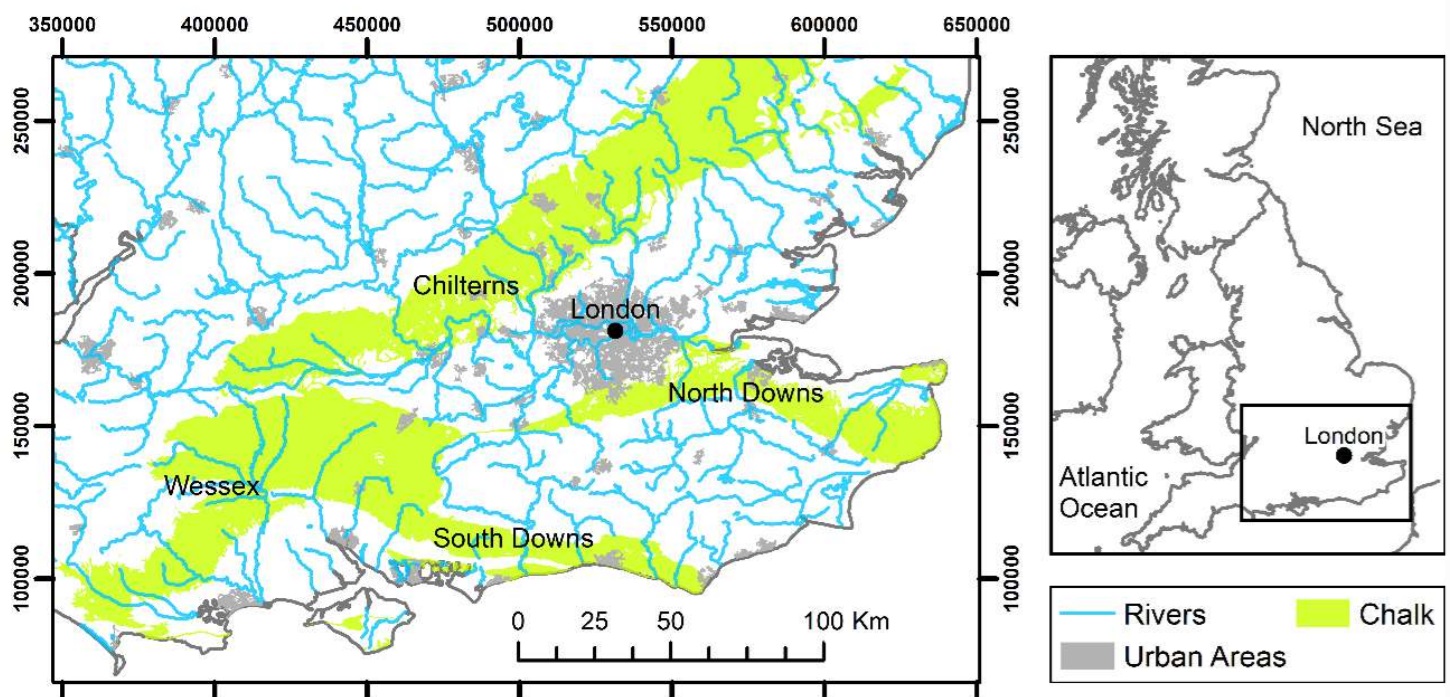

Figure 1 Location of Chalk outcrop (green), rivers (blue) and urban areas (grey). BGS © UKRI.
We determined the impact of a flood event by analysing the length of groundwater flood alerts issued by the Environment Agency, flood-related BBC travel alerts and media reports of flooding. We then developed a new index to systematically quantify regional differences in groundwater levels during flood events, called the standardised groundwater flooding index (SGFI).
This research improved our understanding of the spatial variability of groundwater flooding behaviour in the Chalk, which will assist the UK Government’s national crisis management during major groundwater flooding events.

Figure 2 The village water pump in Chilton, in the Chiltern Hills in England. The borehole feeding the pump became artesian in February 2014 after an extended period of heavy rainfall resulted in prolonged high groundwater levels.
Groundwater flooding in winter 2013 to 2014
Gathering evidence
In the study, we gathered evidence of the effects of groundwater flooding in the Chalk in south-east England during the winter of 2013 to 2014. Figure 3 shows the impact of the flood event. The vast majority of the affected places were located on Chalk outcrop and flooding was assumed to be due to groundwater emergence. The rainfall distribution is also reflected in the impact data.
There were significantly more groundwater flood alerts in the South Downs and Wessex areas than in the Chilterns. This is in contrast to previous events such as that in the winter of 2001, when substantial groundwater emergence occurred in the Chilterns area.
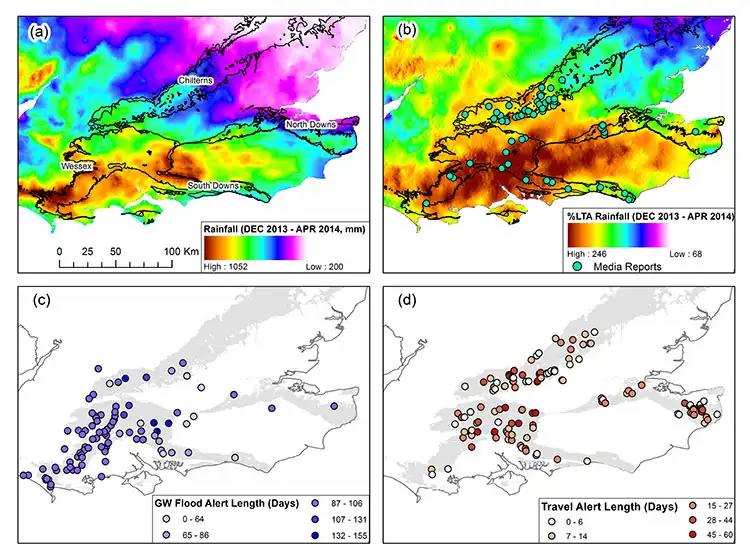
Figure 3 Datasets related to the winter 2013 to 2014 groundwater flood. BGS © UKRI.
New analytical tools
We then developed a new index, the SGFI, to systematically quantify regional differences in groundwater levels during flood events. The SGFI is the transformation of monthly groundwater levels to a normal distribution (zero mean, unit variance), with all negative normalised values set to zero. We applied it to 26 boreholes with monthly groundwater levels recorded from 1980 to 2014, with clustering on the SGFIs to identify observation boreholes with similar responses. Two distinct groups were identified (figures 4 and 5).
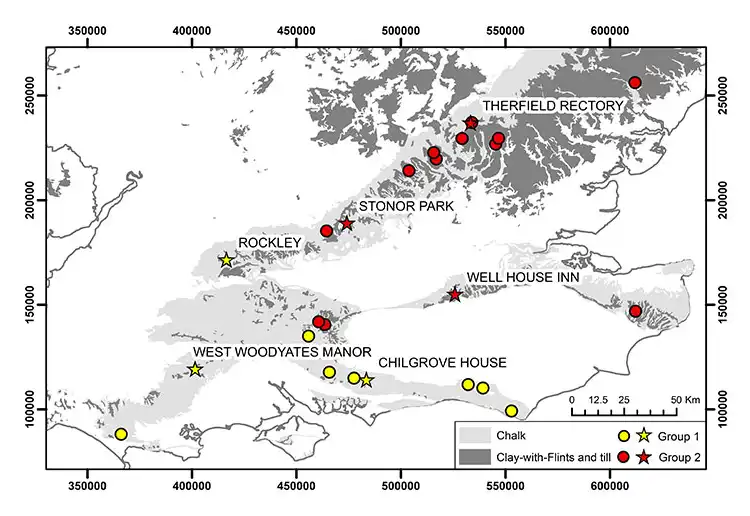
Figure 4 Location of boreholes within the two groups and the overlying clay-with-flints and till. BGS © UKRI.

Figure 5 SGFI for boreholes (grey) within each group and the SGFI centroid (black) for each group. BGS © UKRI.
Groundwater levels were ‘flashy’ in group 1, rising and recessing rapidly in response to recharge. The highest groundwater levels across the full period analysed occurred in the 2013 to 2014 flood.
In contrast, groundwater levels were slow to rise in response to recharge and to recess in group 2, sustaining high and low levels for longer periods compared with group 1. There were several multi-year periods where SGFI remained greater than 0. The highest groundwater levels occurred in the 2000 to 2001 flood.
The analysis also shows the clear spatial differences in groundwater level response during a flood event (Figure 5). Group 2 sites (mostly in the Chilterns and North Downs) respond more slowly to rainfall input, with a greater lag between rainfall and groundwater levels compared to Group 1 (Wessex and South Downs areas).
A primary difference in the hydrogeology of the two group areas is the extent of low permeability clay-with-flints and till in the north of study region. These deposits lie above the Chalk and act to slow and attenuate the recharge signal, causing groundwater levels to both rise and fall more slowly.
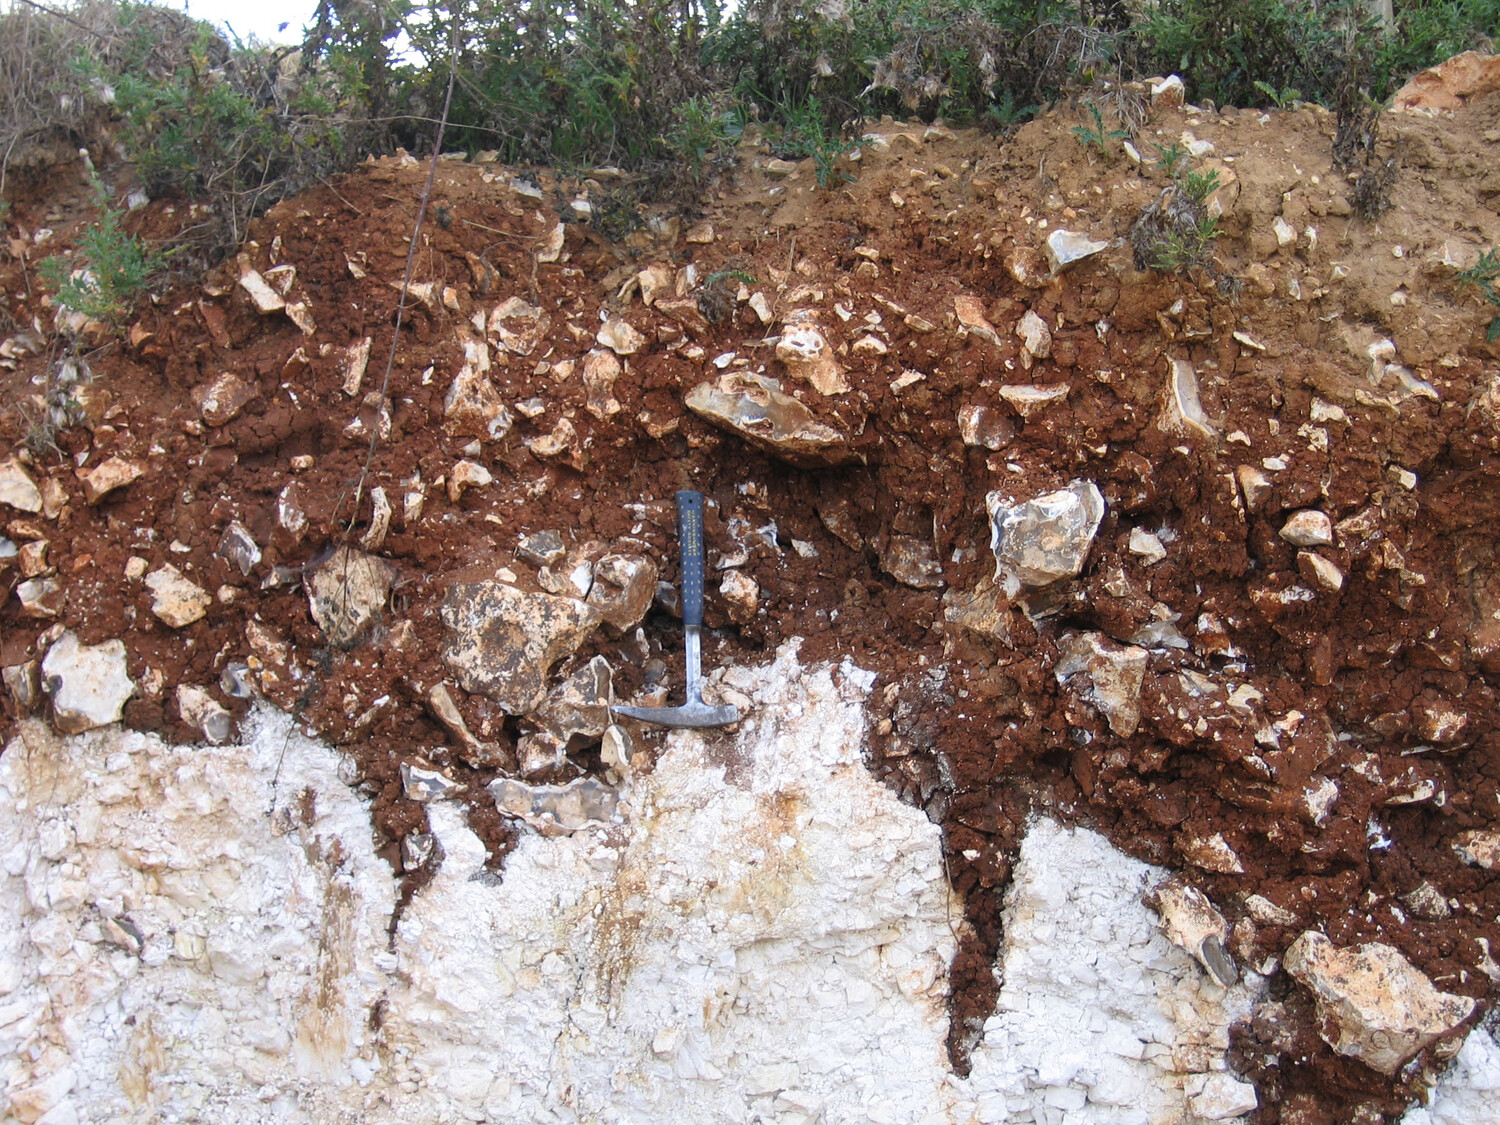
Figure 6 Clay-with-flints (red-brown layer) is a low-permeability superficial deposit. This example comes from Hampshire. BGS © UKRI.
Our analysis suggests that bulk permeability of the Chalk beneath the clay-with-flints and till is lower than elsewhere and the Chalk takes longer to drain as a result, prolonging flooding conditions once they are initiated.
Implications for groundwater flood management
This study has significant implications for management of groundwater flooding at the regional scale.
In the group 1 area to the south, emergency responders should anticipate relatively rapid onset when previous and ongoing rainfall conditions make groundwater flooding likely. However, in the group 2 area more to the north, a relatively slow rise in groundwater levels does not mean groundwater flooding will not occur but, if it does, responders should anticipate longer persistence than in the group 1 area.
Overall, the study identifies the controls on groundwater flooding as a combination of previous conditions, rainfall inputs and Chalk and superficial deposit hydraulic properties. Analysis shows that the locations of groundwater flooding in the 2013 to 2014 event were predominantly controlled by rainfall distribution.
Further reading
Ascott, M J, Marchant, B P, Macdonald, D M J, McKenzie, A A, and Bloomfield, J P. 2017. Improved understanding of spatiotemporal controls on regional scale groundwater flooding using hydrograph analysis and impulse response functions. Hydrological Processes, Vol. 31(25), 4586–4599. DOI: https://doi.org/10.1002/hyp.11380