
Water levels have been recorded in the Chalk Group at Therfield Rectory in Hertfordshire, south-east England, since 1883. It is one of the few sites with continuous monitoring prior to 1900.
BGS Enquiries can help you to access data from the National Groundwater Level Archive (NGLA) for this well.

Location of Therfield Rectory. BGS © UKRI.
Hydrograph
Information about the well
Hydrogeological setting
| Therfield Rectory | |
|---|---|
| Wellmaster ID | TL33/4 |
| NGR | 5335 2369 |
| Datum | 154.81 m AOD |
| Monitoring details | |
| Type | Groundwater level |
| Aquifer | Chalk |
| Confinement | Confined |
| Depth | 83.23 m |
| Record | |
| Monitored by | EA Thames |
| Records commence | 1883 |
| Records end | Active |
This well penetrated the Lewes Nodular Chalk Formation and Seaford Chalk Formation (undifferentiated). The chalk aquifer is overlain and confined by 3 m of low-permeability Lowestoft Formation till.
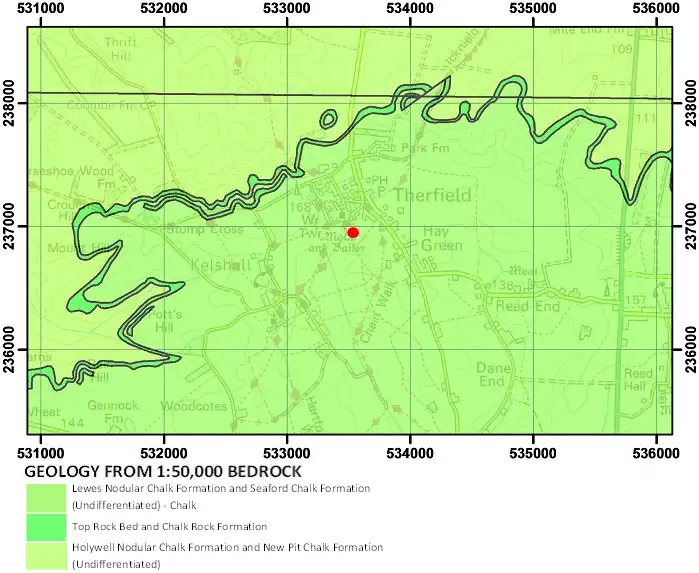
Geological map of the area around Therfield Rectory. BGS © UKRI.
Well or borehole construction
The well consists of an 83.23 m deep, 1.52 m-diameter well, brick lined to 4.57 m. The well was originally only 81.1 m deep; it was deepened to 84.1 m prior to measurements commencing in 1883. When plumbed in 1992, it was found to be only 83.2 m deep, presumably due to silting.
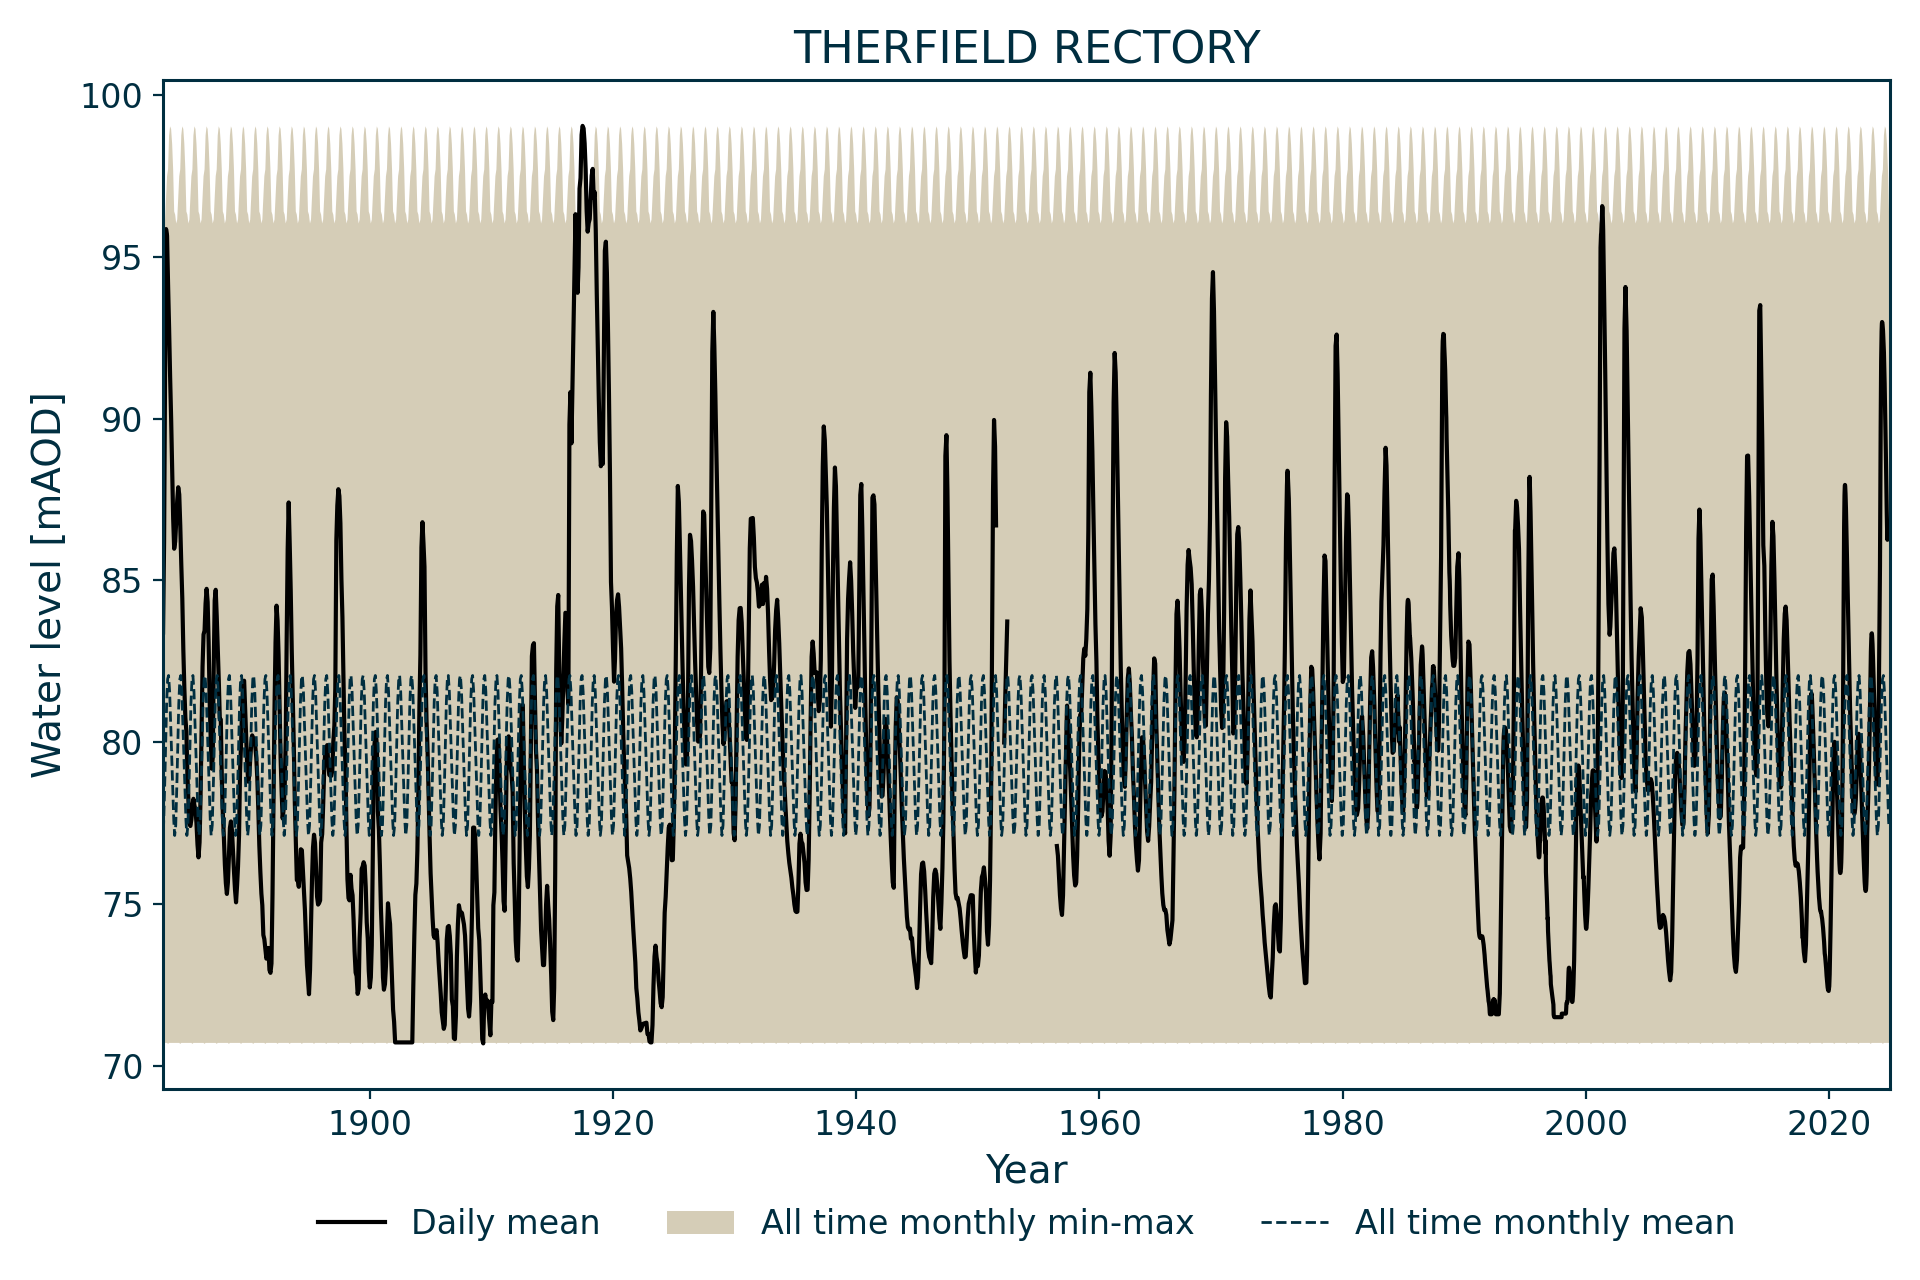
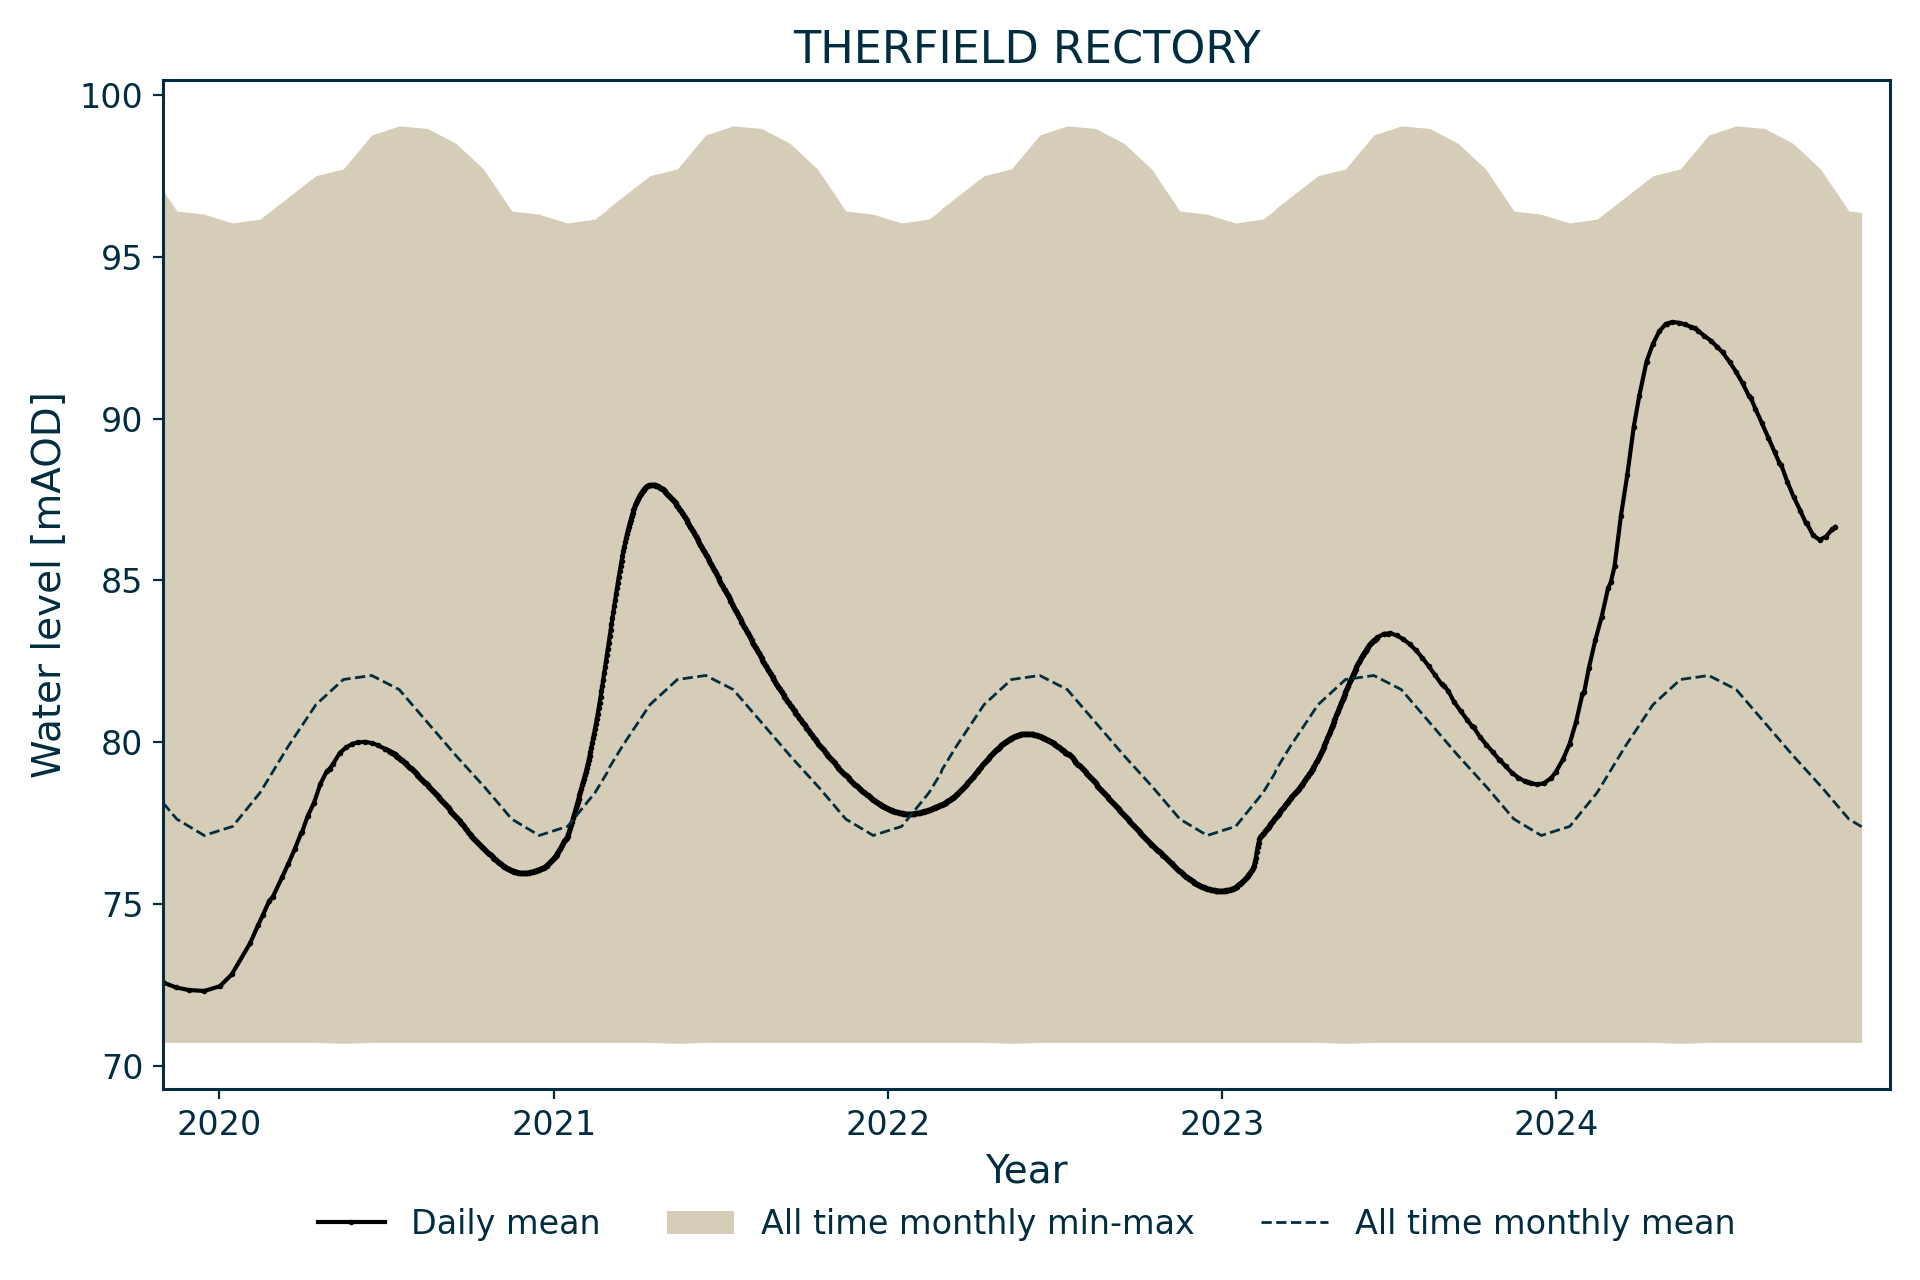
Hydrograph response
The well hydrograph has an annual sinusoidal appearance, except when it goes dry. As the average thickness of the unsaturated zone is between 75 and 80 mbgl, there is normally a two to three month time lag between the start of winter recharge and when the water level starts rising. The time lag has been known to reach five months.
Data issues
The method used to measure the water level in the earliest measurements was presumably a line with some kind of float on the end. These lines underwent considerable amounts of stretching and shrinking over time. Between the start of records in 1883 and August 1885, the line was found to have stretched 3.5 m; between September 1885 and December 1895 it had stretched a further 4.0 m. The line used between July 1903 and February 1923 stretched 6.9 m over this period, whereas the line used from May 1921 to December 1937 shrank 2.2 m, and a further 4.2 m by May 1949. Measurements were corrected assuming that the stretching and shrinkage had occurred uniformly, which may not have been the case.
There are no records for the period June 1952 and June 1956 and there is a note on the file that the EA consider the levels for the period between 1914 and 1920 as very dubious.
In 1999, a dedicated observation well was constructed at Hay Farm (TL33/67) and this has replaced Therfield Rectory as an index well.
References
Ó Dochartaigh, B. 1999. Long groundwater records: Processing and presentation of the Therfield Rectory hydrograph. British Geological Survey Technical Report WD/99/11. (Nottingham, UK: British Geological Survey.)
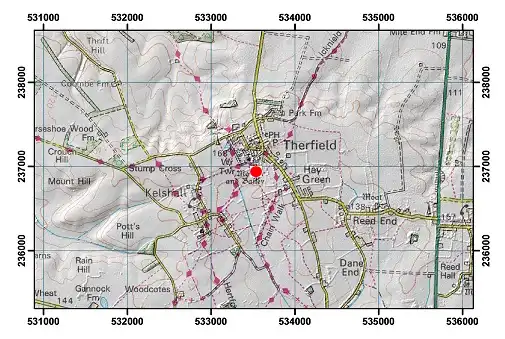
Topographical map with hillshade of the area around Therfield Rectory. BGS © UKRI.
Acknowledgements
Groundwater level data are provided to the NGLA by the Environment Agency (EA), Natural Resources Wales – Cyfoeth Naturiol Cymru (NRW), the Scottish Environment Protection Agency (SEPA) and, for Northern Ireland, the Department for Infrastructure – Rivers and the Northern Ireland Environment Agency.
Further information about these monitoring networks can be found on these pages:
Contact
Please contact BGS Enquiries for further information.