BGS Geophysical Tomography (GTom) has analytical and numerical expertise in all aspects of geoelectrical theory and data processing. We are actively researching and developing new modelling and data analysis methods. Recent advances in acquisition, reconstruction and analysis include:
- optimal survey design to maximise image information content
- adaptive acquisition strategies for time-lapse monitoring applications
- automated segmentation and clustering for image analysis
- joint analysis of geoelectrical and seismic imaging data
We have also developed inversion strategies to extract electrode movements from geoelectrical monitoring data, which reduces or eliminates image distortion for applications on unstable ground and enables the electrode grids to act as distributed motion sensors.
Quick links
- Optimised survey design and image reconstruction
- Adaptive monitoring
- Electrode movement tracking
- Automated image analysis
- Coupled modelling
Optimised survey design and image reconstruction
Electrical resistivity tomography (ERT) surveys have tended to use well-understood, traditional electrode configurations to gather resistivity data. PRIME permits the use of arbitrary arrangements of electrodes and enables the collection of very large measurement sets that can cover extensive areas at high data density. Research is therefore ongoing into algorithms that can make use of this flexibility to maximise ERT image resolution.
Software has been developed that can automatically generate optimal electrode arrays for ERT surveys with 2D, 3D, cross-borehole and buried electrode arrays. These optimised surveys make efficient use of multichannel systems (e.g. PRIME) and have been tested using synthetic modelling studies both in the laboratory and in the field. They have been shown to provide better image resolution than traditional arrays of the same size (e.g. dipole-dipole).

Improved resolution given by using optimised 2D arrays for a synthetic model.
Loke, M H, Wilkinson, P B, and Chambers, J E. 2010. Fast computation of optimised electrode arrays for 2D resistivity surveys. Computers & Geosciences, Vol. 36(11), 1414–1426.
Loke, M H, Wilkinson, P B, and Chambers, J E. 2010. Parallel computation of optimised arrays for 2D electrical imaging surveys. Geophysical Journal International, Vol. 183(3), 1302–1315.
Loke, M H, Wilkinson, P B, Chambers, J E, and Strutt, M. 2014. Optimised arrays for 2D cross-borehole electrical tomography surveys. Geophysical Prospecting, Vol. 62(1), 172–187.
Loke, M H, Wilkinson, P B, Uhlemann, S S, Chambers, J E, and Oxby, L S. 2014. Computation of optimised arrays for 3D electrical imaging surveys. Geophysical Journal International, Vol. 199(3), 1751–1764.
Loke, M H, Kiflu, H, Wilkinson, P B, Harro, D, and Kruse, S. 2015. Optimised arrays for 2D resistivity surveys with combined surface and buried arrays. Near Surface Geophysics, Vol. 13(5), 505–518.
Loke, M H, Wilkinson, P B, Chambers, J E, Uhlemann, S S, and Sorensen, J P R. 2015. Optimised arrays for 2D resistivity survey lines with a large number of electrodes. Journal of Applied Geophysics, Vol. 112, 136–146.
Uhlemann, S, Wilkinson, P B, Maurer, H, Wagner, F M, Johnson, T C and Chambers, J E. 2018. Optimised survey design for electrical resistivity tomography: combined optimisation of measurement configuration and electrode placement. Geophysical Journal International, Vol. 214(1), 108–121.
Wilkinson, P B, Loke, M H, Meldrum, P I, Chambers, J E, Kuras, O, Gunn, D A, and Ogilvy, R D. 2012. Practical aspects of applied optimised survey design for electrical resistivity tomography. Geophysical Journal International, Vol. 189(1), 428–440.
Wilkinson, P B, Meldrum, P I, Chambers, J E, Kuras, O, and Ogilvy, R D. 2006. Improved strategies for the automatic selection of optimized sets of electrical resistivity tomography measurement configurations. Geophysical Journal International, Vol. 167(3), 1119–1126.
Adaptive monitoring
Typically, ERT monitoring involves repeating the same survey on a time-lapse basis. The resolution of the monitoring images can be improved by using an adaptive, optimal, experimental design method. This uses previous images to guide the choice and design of future surveys. These survey designs are time dependent and, compared to dipole-dipole or static optimised surveys that do not change over time, focus a greater degree of the image resolution on regions of the subsurface that are actively changing.
The adaptive optimisation method was validated with a controlled laboratory monitoring experiment comprising a well-defined cylindrical target moving along a trajectory that changes its depth and lateral position. The algorithm was implemented on a standard PC in conjunction with a modified, automated, multichannel resistivity imaging system. Data acquisition using the adaptive survey designs required no more time or power than with comparable standard surveys and the algorithm processing was sufficiently rapid to be carried out while the measurement system batteries recharged. The results showed that adaptively designed optimal surveys gave an extra increase of 15 per cent in image quality over and above that gained by using static (time independent) optimised surveys instead of dipole-dipole.
Adaptive monitoring of a moving cylindrical target in a laboratory environment.
Wilkinson, P B, Uhlemann, S, Meldrum, P I, Chambers, J E, Carrière, S, Oxby, L, and Loke, M H. 2015. Adaptive time-lapse optimised survey design for electrical resistivity tomography monitoring. Geophysical Journal International, Vol. 203(1), 755–766.
Electrode movement tracking
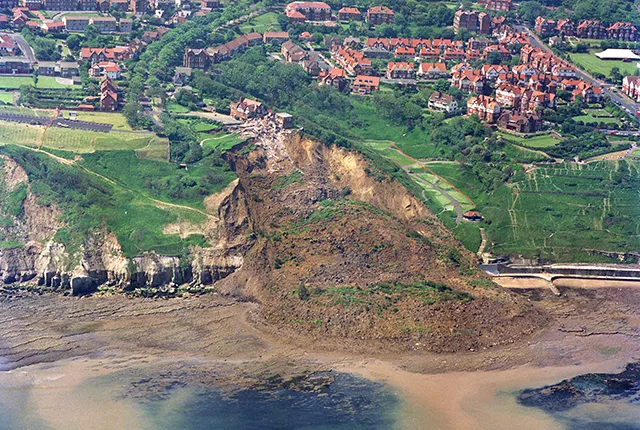
If the electrode positions used in geoelectrical resistivity inversion are uncertain then the resulting tomographic images will exhibit artefacts that can obscure genuine features and time-lapse changes in the subsurface. This is a particular problem when using resistivity monitoring on unstable slopes such as landslides. We have developed innovative inverse methods to recover movements of resistivity imaging electrodes on unstable ground, either for 2D surveys (movement along a linear electrode array) or 3D surveys (movements in both directions across a grid electrode array).
Electrode movement of a 2D ERT array on a landslide in Yorkshire, UK. Contains Ordnance Data © Crown Copyright and database rights 2020 . Ordnance Survey Licence no. 100021290.
The efficacy of these techniques has been demonstrated using numerical simulations, laboratory experiments and data from field monitoring sites.
Using a monitoring installation on an active landslide, it was possible to recover sequences of movement over timescales of days to years. Typically these methods are able to recover the movements of the electrodes to an accuracy of 5–10 per cent of the spacing between the electrodes. Over short timescales, when the resistivity of the ground did not change significantly, an order-of-magnitude better accuracy was achievable. This enabled the onset and acceleration of landslide activity to be detected with a spatial resolution of a few centimetres and a temporal resolution of a few days.
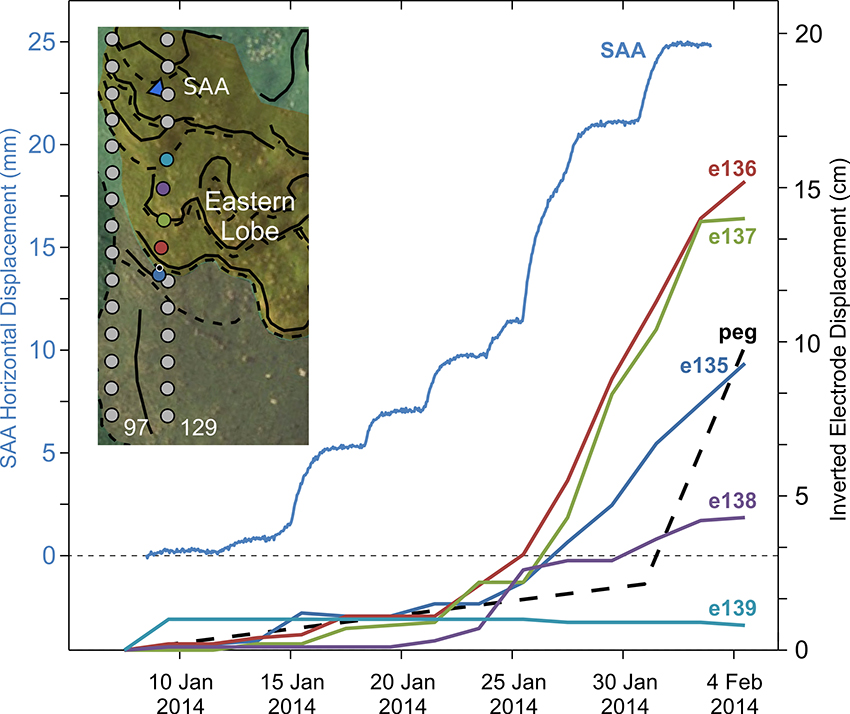
3D electrode movement of a grid array on a landslide in Yorkshire, UK. Contains Ordnance Data © Crown Copyright and database rights 2020 . Ordnance Survey Licence no. 100021290.
Boyle, A, Wilkinson, P B, Chambers, J E, Meldrum, P I, Uhlemann, S, and Adler, A. 2018. Jointly reconstructing ground motion and resistivity for ERT-based slope stability monitoring. Geophysical Journal International, Vol. 212(2), 1167–1182.
Loke, M H, Wilkinson, P B, Chambers, J E, and Meldrum, P I. 2018. Rapid inversion of data from 2D resistivity surveys with electrode displacements. Geophysical Prospecting, Vol. 66(3), 579–594.
Wilkinson, P B, Chambers, J E, Lelliott, M, Wealthall, G P, and Ogilvy, R D. 2008. Extreme sensitivity of crosshole electrical resistivity tomography measurements to geometric errors. Geophysical Journal International, Vol. 173(1), 49–62.
Wilkinson, P B, Chambers, J E, Meldrum, P I, Gunn, D A, Ogilvy, R D, and Kuras, O. 2010. Predicting the movements of permanently installed electrodes on an active landslide using time-lapse geoelectrical resistivity data only. Geophysical Journal International, Vol. 183(2), 543–556.
Wilkinson, P B, Uhlemann, S Chambers, J E, Meldrum, P I, and Loke, M H. 2015. Development and testing of displacement inversion to track electrode movements on 3D electrical resistivity tomography monitoring grids. Geophysical Journal International, Vol. 200(3), 1566–1581.
Wilkinson, P, Chambers, J, Uhlemann, S, Meldrum, P, Smith, A, Dixon, N, and Loke, M H. 2016. Reconstruction of landslide movements by inversion of 4D electrical resistivity tomography monitoring data. Geophysical Research Letters, Vol. 43(3), 1166–1174.
Automated image analysis
We have applied computer vision and machine learning methods to automatically interpret geoelectrical resistivity images.
Identifying interfaces in resistivity images can be difficult due to the smoothness constraints typically used in the inversion. A statistical, population-based approach has been used to guide a ‘fuzzy clustering’ method, which identifies clusters of related cells in the resistivity images while avoiding the assumption of hard edges. It also provides a measure of the uncertainties in the cluster boundaries. The algorithm was validated by direct comparisons with known bedrock depths at two 3D resistivity survey sites and performed as well as other image analysis methods but with much less user input.
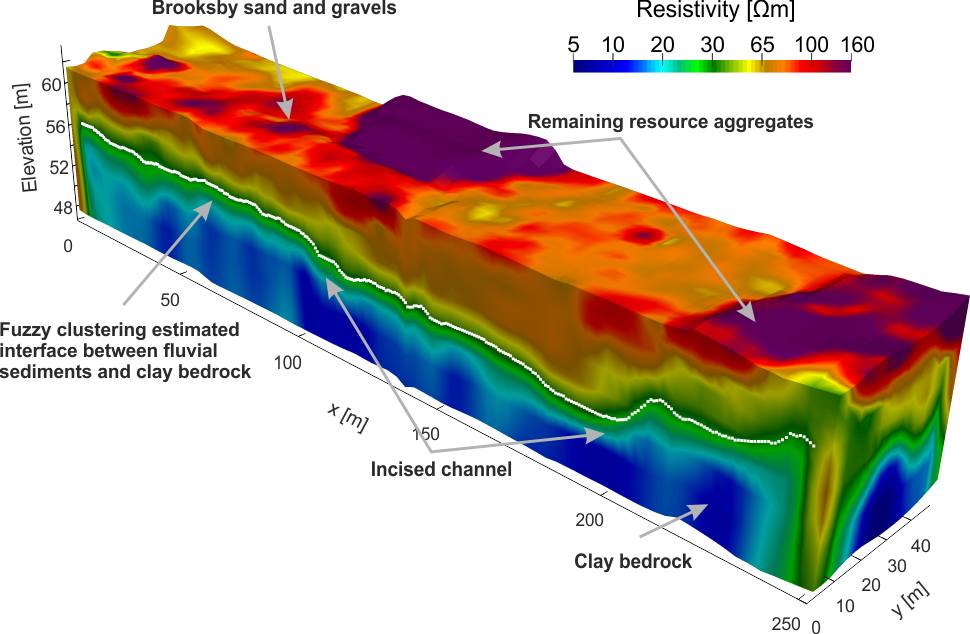
Fuzzy clustering of related resistivity cells avoids the assumption of hard edges and estimates the bedrock–sediment interface.
Such techniques were also used to automatically track the motion of tracers in resistivity monitoring images. Using Bayesian inference techniques, in the form of a Kalman filter, the trajectory of the tracer was monitored by predicting and updating a state model representing its movements. Observations for the Kalman filter were gathered using a maximally stable volumes algorithm to isolate the tracer from the background in the resistivity images. This method was able to track the movements of tracers in 2D and 3D monitoring experiments successfully in the presence of noise without manual intervention.
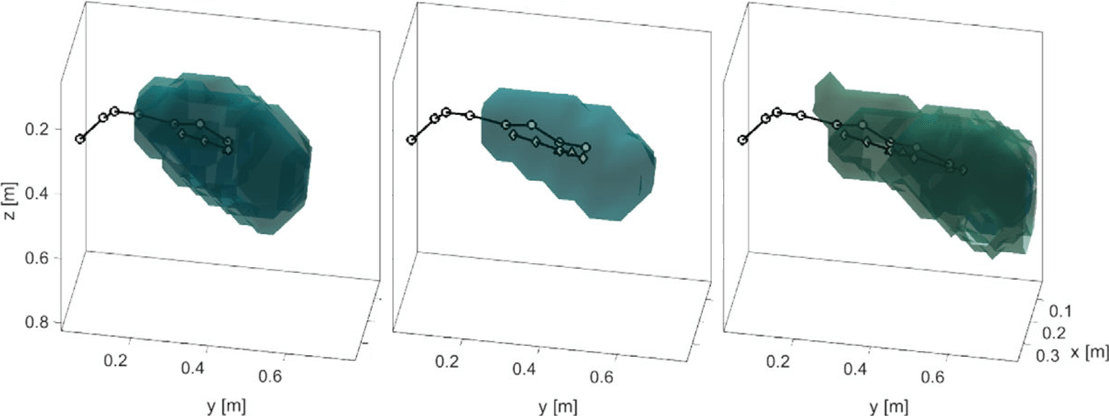
Automated image analysis of a tracer experiment.
Ward, W O C, Wilkinson, P B, Chamber, J E, Oxby, L S, and Bai, L. 2014. Distribution-based fuzzy clustering of electrical resistivity tomography images for interface detection. Geophysical Journal International, Vol. 197(1), 310–321.
Ward, W O C, Wilkinson, P B, Chambers, J E, Nilsson, H, Kuras, O, and Bai, L. 2016. Tracking tracer motion in a 4-D electrical resistivity tomography experiment. Water Resources Research, Vol. 52(5), 4078–4094.
Coupled modelling
Resistivity imaging of the Hollin Hill landslide in Yorkshire clearly shows formations with different resistivities (Redcar and Whitby Mudstone formations (RMF; WMF) with lower resistivities at the base and top of the image and the intermediate Staithes Sandstone Formation (SSF) with higher resistivities). These images have smooth boundaries, which make locating the exact interface difficult (Figure 1).
Figure 1: separate inversions of 2D electrical resistivity and seismic data.
P- and S-wave seismic refraction tomography surveys have also been carried out and used to produce images of Poisson’s ratio, which give a very clear indication of the boundary between the WMF and SSF. By extracting the surface from the seismic images and including it as a structural constraint in the resistivity inversion, the resolution of the WMF/SSF boundary was much improved in the resistivity image (Figure 2).
Figure 2: inversion of 3D ERT data using seismic data as a structural constraint.
Coupled hydrogeophysical modelling links flow and transport modelling to geophysical modelling. It enables simulation of geophysical monitoring responses to flow scenarios and inverse modelling to predict hydrological parameters from geophysical measurements, e.g. leak locations from geoelectrical monitoring data.
Animation 1 shows a 2D flow and transport model simulating a tracer injection at an injector in the upper left of the domain. Groundwater movement is towards an extraction well to the lower right. An ERT imaging cell with four boreholes is located at the centre of the domain. As the conductive tracer migrates through the ERT imaging cell, there is a corresponding increase in electrical conductivity in the ERT imaging cell.
Animation 1: modelling of a tracer experiment using a 2D flow and transport model.
The possibility for geoelectrical resistivity monitoring data to inform and update slope stability models in near-real-time is being investigated using coupled geophysical and geomechanical modelling. This work links temperature-corrected resistivity models via soil suction modelling to volumetric estimates of shear strength.
The preliminary results in the animation show the changes in resistivity in the Hollin Hill 3D geoelectrical model and the subsequent effects on the distribution of shear strength, which drops dramatically in the winter months around the break of slope near the top of the modelled region.
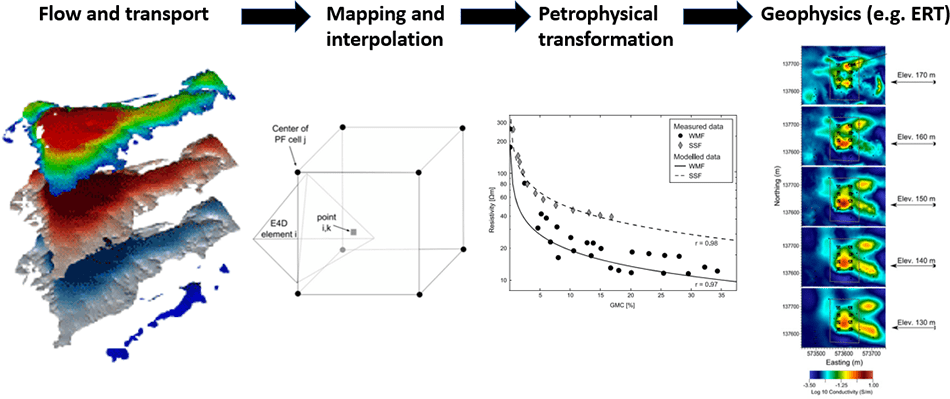
Figure 3: the process of simulating geophysical responses to hydraulic flow scenarios.
Figure 4: shear strength geomechanical model derived from geoelectrical measurements on a landslide in Yorkshire, UK.
Uhlemann, S, Chambers, J, Wilkinson, P, Maurer, H, Merritt, A, Meldrum, P, Kuras, O, Gunn, D, Smith, A, and Dijkstra, T. 2017. Four-dimensional imaging of moisture dynamics during landslide reactivation. Journal of Geophysical Research: Earth Surface, Vol. 122(1), 398–418.
Contact
If you want to discover more then please contact Paul Wilkinson or Jonathan Chambers.
You may also be interested in

Landslides
Building resilience both in the UK and internationally to landslides and carrying out many aspects of landslide research.
Engineering and Geotechnical Capability
Leading the development and application of field and laboratory infrastructure and long-term management of geophysical and geotechnical property data.
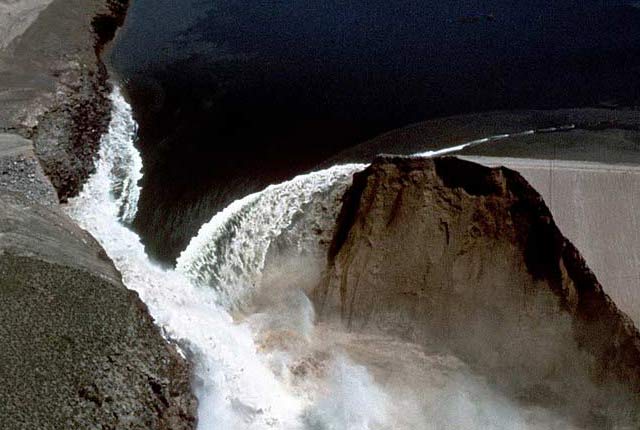
BGS PRIME: an early warning system for slope failure
Dam and slope failures can lead to the wide-scale destruction of property and, in some cases, catastrophic loss of life.